ENHANCED ADAPTATION TO CLIMATE VARIABILITY IN
THARAKA-NITHI AND KITUI COUNTIES
ESTHER WANGECI MUGI (BSc.)
N50/24880/2011
A Thesis Submitted in Partial Fulfillment for the Degree of Master of
Environmental Studies (Agroforestry and Rural Development), School
of Environmental Studies of Kenyatta University
DECLARATION Candidate’s Declaration
This thesis is my original work and has not been presented for a degree in any other university or any other award.
Signature……… Date………
Esther Wangeci Mugi N50/ 24880/2011
Declaration by Supervisors
We confirm that the work reported in this thesis was carried out by the student under our supervision
Signature………. Date……….
Dr. Monicah Mucheru-Muna
Department of Environmental Sciences Kenyatta University
Signature……… Date………
Dr. Jayne Mugwe
DEDICATION
ACKNOWLEDGEMENT
My appreciation and profound gratitude goes to my supervisors, Dr. Monicah Mucheru-Muna (the Principal Investigator of the project; RU/CGC/GRG/15/10/109 funded by Regional Universities Forum for Capacity Building in Agriculture (RUFORUM) and Dr. Jayne Mugwe for their invaluable insights that have guided my thinking and understanding in the course of this study. I am indebted to Prof. Daniel Mugendi, Dr. Felix Ngetich and Franklin Mairura for their unfailing support and facilitation. I acknowledge the Regional Universities Forum for Capacity Building in Agriculture (RUFORUM) for providing the financial support that has enabled me to take a step higher in achieving my career objectives.
TABLE OF CONTENTS
DECLARATION ... ii
DEDICATION ... iii
ACKNOWLEDGEMENT ... iv
LIST OF TABLES ... viii
LIST OF FIGURES ...x
ABBREVIATIONS AND ACRONYMS ... xi
ABSTRACT ... xii
CHAPTER ONE: ...1
INTRODUCTION ...1
1.1 Background Information ...1
1.2 Problem Statement ...2
1.3 Research questions ...3
1.4 Objectives ...3
1.5 Research Hypothesis ...4
1.6 Significance of the study ...4
1.7 Conceptual framework ...4
1.8 Definition of terms ...5
CHAPTER TWO ...7
LITERATURE REVIEW ...7
2.1 Overview ...7
2.2 Farmers’ knowledge on indigenous strategies used in adapting to climate variability ...7
2.4 Influence of household socio-economic factors on the level of adaptation to
climate variability ...10
2.5 Summary of reviewed literature and research gaps ...12
CHAPTER THREE ...14
METHODOLOGY ...14
3.1 Study area...14
3.2 Research design ...16
3.3 Sampling strategy...16
3.4. Pre –testing the research instruments ...17
3.5 Data collection ...18
3.6 Data management and analysis ...19
CHAPTER FOUR ...21
RESULTS AND DISCUSSION ...21
4.1 Socio-demographic characteristics of respondents ...21
4.2: Indigenous strategies and preparedness techniques employed by small-holder farmers in coping with climate variability in Tharaka-Nithi and Kitui Counties ...23
4.2.1: Indigenous strategies employed by small-holder farmers in weather forecasting ...23
4.2.2: Preparedness/adaptation strategies used by small-holder farmers to cope with climate variability ...24
4.3: Integration of Indigenous and Conventional Knowledge of weather forecasting for adaptation to climate variability in Tharaka-Nithi and Kitui Counties ...28
4.3.1: Indigenous Knowledge indicators used when planning for various activities in maize production ...28
4.3.3 Evidence of climate variability and trends from conventional
knowledge ...34
4.3.4: Integration of conventional and indigenous knowledge of weather forecasting ...37
4.4: Influence of household socio-economic factors on the level of adaptation to climate variability in Tharaka-Nithi and Kitui Counties41 4.4.1: Farmers’ level of adaptation to climate variability ...41
4.4.2 The extent of use of crop adjustment factor ...43
4.4.3 The extent of use of crop management factor ...46
4.4.4: The extent of use of soil and water conservation factor ...49
4.4.5: The extent of use of water harvesting and crop types factor ...52
4.4.6: The extent of use of boreholes and crop variety factor ...56
CHAPTER FIVE ...60
CONCLUSION AND RECOMMENDATIONS ...60
5.1 Conclusion ...60
5.2 Recommendations ...62
5.3 Further Research ...62
REFERENCES ...63
APPENDICES ...75
APPENDIX 1: HOUSEHOLD SURVEY INTERVIEW SCHEDULE ...75
APPENDIX 2: KEY INFORMANTS INTERVIEW SCHEDULE ...90
LIST OF TABLES
Table 4.1:Socio-demographic characteristics of the respondents in Tharaka and Kitui-Central Sub-Counties ...21
Table 4.2:Indigenous strategies of weather forecasting employed by small-holder farmers in Tharaka and Kitui-Central Sub Counties ...23
Table 4.3:Adaptation strategies used by small-holder farmers when planning for maize production in Kitui Central and Tharaka Sub-counties ...25
Table 4.4:The IK indicators and their level of use (%) while planning for various field management and activities in maize production in the study area ...28
Table 4.5:Droughts experienced since 1980 in Tharaka and Kitui...33
Table 4.6:Specific indigenous indicators used in weather forecasting in Kitui Central ...38
Table 4.7:Specific indigenous indicators used in weather forecasting in Tharaka39
Table 4.8:Extent of utilization of climate variability adaptation strategies (indicating level of adaptation) by small-holder farmers on maize crop in the study area ...42 Table 4.9:Socio-economic factors influencing the extent of use of crop
adjustment factor in Tharaka and Kitui Central Sub- Counties ...44
Table 4.10: Socio-economic factors influencing the extent of use of crop adjustment factor in Tharaka and Kitui-Central Sub-Counties ...45
Table 4.11: Socio-economic factors influencing the extent of use of crop management factor (Univariate analysis) ...47
Table 4.12: Socio-economic factors influencing the extent of use of crop management factor ...48
Table 4.13: Socio-economic factors influencing the extent of use of soil and water conservation factor ...50 Table 4.14: Socio-economic factors influencing the extent of use of soil and
Table 4.15: Social-economic factors influencing the extent of use of water harvesting and change of crop types factor ...53
Table 4.16: Socio-economic factors influencing the extent of use of water harvesting and crop type factor ...54
Table 4.17: Socio-economic factors influencing the extent of use of boreholes/ water pans and changing crop varieties factor ...57
LIST OF FIGURES
Figure 1.1: Conceptual framework showing the relationship among the
objectives ...5
Figure 3.1: A map showing the study area where data was collected ...14
Figure 4.1: Variations in rainfall pattern as perceived by small-holder farmers over the past 30 years ...30
Figure.4.2: Variations in temperature pattern as perceived by small-holder farmers in Tharaka and Kitui-Central ...32
Figure 4.3: Annual rainfall series and linear trends for Tharaka and Kitui Central Sub-Counties from 1980 to 2012 ...34
Figure 4.4: Annual Rainfall anomalies for Tharaka and Kitui Central Sub-Counties from 1980 to 2012 ...35 Figure 4.5: Mean annual temperature series and linear trend for Tharaka and
Kitui Central Sub-Counties from 1980 to 2012 ...36
Figure 4.6: Annual mean minimum temperature anomalies for Tharaka and Kitui Central Sub-Counties from 1980 to 2012 ...36
Figure 4.7: Annual mean maximum temperature anomalies for Tharaka and Kitui Central Sub-Counties from 1980 to 2012 ...37
ABBREVIATIONS AND ACRONYMS
ASALs : Arid and Semi-Arid Lands
CEEPA : Centre for Environmental Economics and Policy in Africa
FGDs : Focus Group Discussions
GOK : Government of Kenya
HH : Household
HHH : Household Head
IK : Indigenous Knowledge
IPCC : Intergovernmental Panel on Climate Change
KIs : Key Informants
KMD : Kenya Meteorological Department
LDCs : Less Developed Countries
LR : Long Rains
MNLR : Multinomial Logit Regression
MoA : Ministry of Agriculture
PCA : Principal Component Analysis
SPSS : Statistical Package for Social Sciences
SR : Short Rains
SSA : Sub- Saharan Africa
SSTs : Sea Surface Temperatures
ABSTRACT
CHAPTER ONE:
INTRODUCTION
1.1 Background Information
Over 80% of the agriculture in Sub-Saharan Africa (SSA) is rain-fed and the bulk is under small-holder farming (Hulme et al., 2001; Barron et al., 2003). Not only are agricultural systems in the region diverse and vast but are often characterized by unreliable rainfall which is caused by climate variability (Parry et al., 2004; Matari et al., 2008). This has led to a wide recognition of adaptation as a fundamental and necessary response to the threats posed by climate variability (Adger et al., 2003; IPCC, 2007). Adaptation in this context includes all adjustments that reduce the vulnerability of farmers to conditions caused by climate variability (Smith et al., 1996; Smit et al., 2001; Tanner and Mitchell, 2008; van Aalst et al., 2008).
The conditions caused by climate variability have negative effects on agricultural productivity (Manneh et al., 2007; Laux et al., 2010) by introducing unfavourable growing conditions into the existing cropping calendar (Ziervogel and Calder, 2003; Dovers, 2009). The level of adaptation is influenced by many factors and varies among individuals and within communities, countries and regions (Ericksen et al., 2011). According to Ramphelle (2004) and UNEP (2007), such adaptive responses include among others indigenous knowledge (IK) that is passed on among local communities and helps them to predict disasters caused by climate variability and hence devise coping mechanisms to deal with this. The use of such knowledge has, however, not been properly documented in a way that can be of great help to small-holder farmers.
agricultural sector to these adverse effects becomes imperative so as to protect the livelihoods of farmers and also ensure food security.
A better understanding of how the small-holder farmers perceive climate variability and the ongoing adaptation measures is crucial in promoting their successful adaptation since they rely mainly on rain-fed agriculture (Smithers and Smit, 2009). This calls for comprehensive information on the impact of climate variability on agricultural systems as well as the effects on land use changes at household level (Manneh et al., 2007). This is so that reliable adaptation options can be targeted appropriately. Small-holder have tried to adapt to such conditions caused by climate variability such as drought through the use of indigenous approaches and preparedness techniques in combination with conventional approaches (Liebenstein and Marrewijk, 2000). However, the indicators are not quantified on any scale and are normally subjective, their documentation being quite limited. Also, there is no communication mechanism available for their transmission to the small holder farmers in future.
1.2 Problem Statement
determine the influence of socioeconomic characteristics on the level of adaptation to climate variability amongst small-holder farmers in Tharaka-Nithi and Kitui Counties.
1.3 Research questions
The study sought to answer the following questions:
1. What are the indigenous strategies and preparedness techniques employed by small-holder farmers in coping with climate variability in Kitui and Tharaka-Nithi Counties?
2. How can indigenous and conventional knowledge of weather forecasting be integrated in adapting to the impacts of climate variability in Kitui and Tharaka-Nithi Counties?
3. How do household socio-economic factors influence the level of adaptation to climate variability in Kitui and Tharaka-Nithi Counties?
1.4 Objectives
The overall objective was to assess the indigenous knowledge used in weather forecasting and how it can be integrated with conventional approaches of weather forecasting to enhance small-holder farmers’ adaptation to climate variability in the study area.
To achieve this objective, the study sought to address the following specific objectives: 1. To identify the indigenous knowledge and preparedness techniques employed by
small-holder farmers in coping with climate variability in Tharaka-Nithi and Kitui Counties
2. To integrate indigenous and conventional knowledge of weather forecasting for adaptation to climate variability in Tharaka-Nithi and Kitui Counties
1.5 Research Hypothesis
The study was guided by the following hypothesis:
1. There is a significant relationship between households’ socio-economic factors and the level of adaptation to climate variability in Tharaka-Nithi and Kitui Counties
1.6 Significance of the study
The information generated from this study will enrich the knowledge of extension service providers as well as the small-holder farmers in regard to adapting to climate variability. This is after gaining a better understanding of how the small-holder farmers in the study area perceive climate variability and the ongoing adaptation measures. Since they rely mainly on rain-fed agriculture, identifying the IK of weather forecasting used and integrating it with conventional knowledge of climate forecasting was very crucial. This is because it is one of the adjustments that reduce the vulnerability of the small-holder farmers to conditions caused by climate variability, since such conditions have negative impacts on agricultural productivity. The knowledge is therefore envisaged to eventually improve the resilience of small holder farmers in the study area from the adverse effects of climate variability and the eventual increase in agricultural production.
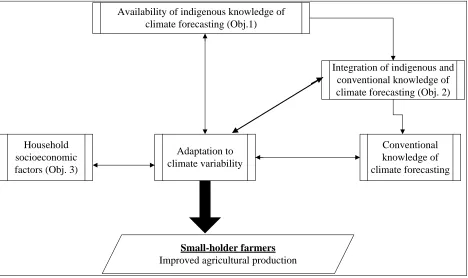
1.7 Conceptual framework
Availability of indigenous knowledge of climate forecasting (Obj.1)
Household socioeconomic factors (Obj. 3)
Adaptation to climate variability
Conventional knowledge of climate forecasting Integration of indigenous and
conventional knowledge of climate forecasting (Obj. 2)
Small-holder farmers
Improved agricultural production
Figure 1.1: Conceptual framework showing the relationship among the objectives
1.8 Definition of terms
Adaptation: Adjustments in ecological, social and economic systems in response to the effects or impacts of climatic variability.
Climate variability: Fluctuations in climatic elements such as rainfall, temperature, wind flow patterns, ocean currents and air pressure on time scales of months, years, decades and centuries. It includes conditions such as droughts and floods.
Drought: A prolonged period of abnormally low or scanty rainfall, especially one that adversely affects growing or living conditions.
Household: Those members living under the same roof and whose labour, income and expenditures were considered as part of the household’s economic conditions
CHAPTER TWO
LITERATURE REVIEW 2.1 Overview
Africa is highly vulnerable to the negative impacts of climate variability and in particular, this has a negative impact on agricultural production in East African region because most of its agriculture is mainly rain-fed (Fugile, 2007; Thorton et al., 2009). Kenya has experienced the adverse effects of climate variability which has been found to include drastic changes in rainfall patterns leading to low agricultural productivity (Manneh et al., 2007). These drastic changes in rainfall patterns introduce unfavourable growing conditions into the existing cropping calendars thereby modifying growing seasons which subsequently reduce crop productivity (Thorton et al., 2009). This is even exacerbated when the situation extends over a prolonged period of time (Parry et al., 2004).
Anandaraja et al. (2008) noted that any technological management of climate variability requires medium to long-term climate prediction and information to be translated into early warning and response. With the threat of climate variability, the latest knowledge and capacities in climate science needs to be translated into operational products and services for stakeholders’ use (Ngugi, 1999). This will enable countries to enhance their capacities in climate-related risk management (Adejuwon, 2002). In this context, integrating indigenous and conventional knowledge of climate forecasting can be seen as a way to improve the adaptation to climate related risks for small-holder. The adoption of various strategies used in adapting to climate variability by small-holder farmers are seen to be rather context specific (Nhemachena and Hassan, 2007).
2.2 Farmers’ knowledge on indigenous strategies used in adapting to climate variability
strategies which have evolved over time in addition to the conventional strategies to help in reducing the overall vulnerability to climate variability shocks. Local perceptions of climate variability are deemed important since they reflect local concerns (Danielsen et al., 2005; Chang’a et al., 2010) and focus on the actual impacts of climate variability on people’s lives (Laidler, 2006; Baumwell, 2008). Alessa et al. (2008) stress that local knowledge and perceptions influence people’s decisions both in deciding whether to act or not. Small-holder farmers in marginal environments have characteristically adopted livelihood strategies which have evolved over time to help in reducing the overall vulnerability to climate variability shocks (Tschakert, 2007).
As observed by Anandaraja et al. (2008), these have included various indigenous ways in which future events can be foretold. For instance, an occurrence of a certain phenomena (biological, climatic or socio-economic) heralds the anticipation of an event (Aoki, 2003). Small-holder farmers are able to understand and incorporate such forecast information into their decision- making process (Luseno et al., 2003; Suarez and Patt, 2004; Lybbert et al., 2007). For instance, Mhita (2006) noted that presence of higher than normal flowering intensity of some trees in Tanzania during the month of July to November indicates that the upcoming season will have a good amount of well distributed rainfall, while a good fruit harvest from some other trees is a signal of impending climate variability in the upcoming season. Appearance of large swarms of red ants in September to November and occurrence of large swarms of butterflies is an indication of imminent rainfall onset and also indicates that the upcoming rainfall season would be good (Mhita, 2006).
communities the IK is likely to be lost due to limited documentation and condemnation of its ability in natural hazard management. In connection to this, the research study sought to identify the knowledge of small-holder farmers in the study area on indigenous technologies and preparedness techniques employable in coping with climate variability
2.3 Integration of indigenous with conventional knowledge of climate forecasting in adapting to climate variability
Climate variability has often been dealt with in a reactive manner rather than by applying a pre-emptive management approach that allows the effective use of all available information (Zorita and Tilya, 2002). Policy development related to national and regional management of climate variability is generally unsatisfactory and even lacking in most developing countries. A common understanding of climate variability and its effects is essential for its comprehensive management in an integrated approach (Kihupi et al., 2002) addressing the overall development goals and well being of the people living in prone areas, and involving the different sectors and stakeholders affected (Emery, 2000; Agrawal, 2008). Indigenous knowledge belongs to people local in an area and is in most cases absent in conventional knowledge. Such knowledge can be useful in providing information about local conditions and redirect empirical investigations to issues that have been overlooked by conventional knowledge. In addition, incorporating the IK into climate change policies can lead to the development of effective adaptation strategies that are cost effective, participatory and sustainable (Robinson and Herbert, 2001).
years (Patt and Gwata, 2002). This kind of information can therefore be used to provide early warnings in an area and enable farmers to develop preparedness techniques since it reflects whether the cropping season will be better, worse or equal to the previous season (O’Brien and Vogel, 2003; Gissila et al., 2004; Johnston et al., 2004). There is need for calibration and validation of such information by crosschecking and identifying explanations based on scientific research results (Rengalakshmi, 2002). This can be achieved by interpretation based on IK in order to be relevant and sound (Kloprogge and Van, 2006; Rengalakshmi, 2010; Kalanda et al., 2011). There is therefore need for a better understanding of the scientific basis of climate variability (Ensor and Berger, 2009).
At the same time, the latest knowledge and adaptive capacities to climate variability in the study area need to be translated into operational products and services and should be widely shared and the capacity to apply such approaches built and developed (Brascoupe and Mann, 2001; West et al., 2008). Oluonko-Odingo (2009) noted that recognizing IK belonging to a community confirms to them that their knowledge is valuable and this gives them authority over the process of risk reduction. This in turn provides the enhanced capacity needed to respond to potential threats since local community members are the immediate responders. In this context, the study sought to integrate the indigenous practices with conventional knowledge systems in adapting to climate variability in the study area. This is envisaged to enable small-holder farmers to enhance their capacities in climate-related risk management.
2.4 Influence of household socio-economic factors on the level of adaptation to climate variability
information relevant to adaptation to the effects of climate variability (Nkonya et al., 1997). It has also been shown that more educated farmers are more exposed to understand new ideas and concepts related to climate variability (Nkonya et al., 1997).
Gender, especially of the household head, is also considered to influence the uptake of adaptation strategies (Nhemachena and Hassan, 2007). In respect to gender of the household head, Asfaw and Admassie (2004) argue that male headed households are more likely to access information on the availability of new technologies than female headed households. In addition to this, having a female heading a household may have negative effects on the adoption of coping strategies to climate variability such as soil and water conservation measures. This is due to the fact that women may have limited access to information, land and other resources due to traditional social barriers (Tenge and Hella, 2004). Contrary to these findings, Nhemachena and Hassan (2007) argue that female headed households are more likely to adapt to climate variability by taking up coping strategies because they are responsible for much of the agricultural work thus have greater experience.
Household size is also a determinant of the level of adaptation to climate variability by small holder farmers. Tizale (2007) and Yirga (2007) found that households with large families may be forced to divert part of their labor force to off-farm activities in an effort to earn extra income so as to ease the consumption pressure that is known to be imposed by a large family. On the contrary, large family size is associated with a higher labor endowment which would enable a household to accomplish various agricultural tasks that would serve as coping strategies to climate variability since they have large pool of labor during peak times (Croppenstedt et al.,2003; Dolisca et al., 2006; Anley, 2007 and Nyangena, 2007). As such, the study endeavored to find out how socio-economic factors influence adaptation capacity to climate variability among small-holder farmers in the study area.
2.5 Summary of reviewed literature and research gaps
Small holder farmers suffer the adverse effects of climate variability. This has had a negative impact on agricultural production mainly because most of their agriculture is rain-fed. The farmers have characteristically adopted indigenous strategies which have evolved over time in addition to the conventional strategies to help in reducing the overall vulnerability to climate variability shocks. Indigenous knowledge is localized and is in most cases absent in conventional knowledge. Such knowledge can be useful in providing information about local conditions and redirect empirical investigations to issues that have been overlooked by conventional knowledge. However, in spite of all these benefits of IK, it is not well documented.
CHAPTER THREE
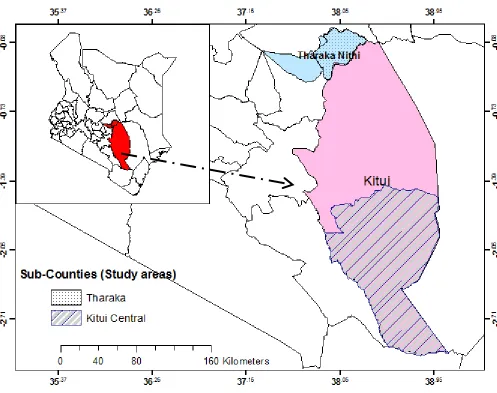
METHODOLOGY 3.1 Study area
The study was carried out in Tharaka and Kitui Central Sub-Counties in Tharaka-Nithi and Kitui Counties respectively (Figure 3.1)
Figure 3.1: A map showing the study area where data was collected
bi-modal pattern of rainfall with average annual rainfall of 500 mm per annum. The area lies within an altitude of 350 to 1500 m above sea level and has a mean annual temperature of 11-25.9°C. During the 2009 population and housing census, Tharaka Sub-County had recorded a population of 130,098 people (GOK, 2010) and 27,393 households. The predominant soil type is ferralsols which is highly weathered and leached acid infertile soil (Jaetzold et al., 2006). The major crops grown are; millet (Pennisetum glaucum), cowpeas (Vigna unguiculata), pigeon peas (Cajanus cajan), green grams (Vigna radiata), sorghum (Sorghum bicolor), cotton (Gossypium hirsutum), cassava (Manihot esculenta), maize (Zea mays), beans (Phaseolus vulgaris), mangoes (Mangifera indica), pawpaw (Asimina triloba) and bananas (Musa spp.).
3.2 Research design
Triangulation approach (O’ Donoghue and Punch, 2003) was adopted in collecting both quantitative and qualitative data and merging the data. The results were used for in-depth investigation into the subject under study. The approach was used so as to serve as a vehicle for cross checking the authenticity and validity of the various generated data sets. This was achieved by using and cross checking information across both primary and secondary data sources. Primary data was obtained through a survey (household survey, key informant interviews and Focus Group Discussions (FGDs)). Secondary data was obtained by reviewing relevant literature. These included among others; journals, text books, annual reports and periodicals.
3.3 Sampling strategy
Several sampling procedures were used to select the required respondents for the household survey, key informant interviews and FGDs. Random sampling was used to select the specific wards where data was collected upon a purposive sampling of the two Sub-Counties (Tharaka- South and Kitui- Central) due to their high agricultural potential and their unique presence of the use of IK in climate forecasting. In Tharaka- Nithi County, Tharaka Sub-County, Tharaka-South constituency, the wards that were randomly sampled were; Kithino, Tunyai, Gakurungu, Nkarini and Chiakariga. In Kitui County, Kitui- Central Sub-County, Central constituency, the wards that were sampled were Township, Changwithia West, Tungutu, Mutuni and Mulundi.
Random sampling of the households (HH) to be interviewed was done. Lists of all household heads were obtained from the Ministry of Agriculture (MoA) offices and random sampling was used to select the required sample size. A sample size of 100 households per Sub-County was arrived at using Equation 1(CRS, 2007).
2 2
)
1
(
*
)
(
*
c
p
p
Z
Where: S is sample size, Z is Z value (e.g. 1.96 for 95% confidence level), P is percentage of picking a choice, expressed as decimal (0.5), C is confidence interval, expressed as a decimal (0.098= ±9.8%).
In order to select the target population to participate in key informant interviews and focus group discussions (FGDs), a purposive sampling was used to preferentially recruit elderly men and women (60 years and above) who are locally regarded to possess special knowledge on rainfall. This was also due to the well known truism that such people have a wealth of information regarding IK systems. This was used in combination with the snow balling technique (Hay, 2000). A snowball sample was achieved by asking opinion leaders with whom contact was already established to suggest people who could potentially participate in or contribute to the study. This technique was employed because this group of respondents represent a population that is not so common thus not easily accessible through probability sampling strategies. Stratification based on gender was also put into consideration to ensure proportionate representation of both genders. This assisted in eliciting information on climate variability. One FGD was conducted per Sub-County and 33 key informants (15 from Tharaka and 18 from Kitui- Central) were successfully interviewed. For the data from Kenya Meteorological Department, the choice of the rainfall station was informed by agro-ecological zones, percentage of missing data and length of the data available. Rainfall data was obtained from Tunyai and Ithokwe stations while temperature data was obtained from Machakos and Embu stations.
3.4. Pre –testing the research instruments
3.5 Data collection
The actual data collection was preceded by an exploratory study in each of the two Sub-Counties which helped to enhance an understanding of climate variability issues and aid in designing of the data collection instruments. The kind of information collected during the exploratory study included; the IK that is deemed popular in the areas of study, the popular preparedness techniques employed by small-holder farmers and small-holder farmers’ perception in regard to climate variability.
To gain a better insight into the subject under study, a survey (household survey, key informants interviews and FGDs) were conducted in an attempt to extract both quantitative and qualitative data in accordance to Newing (2011). Data on climate attributes (rainfall and temperature data from 1980 to 2012) were obtained from Kenya Meteorological Department (KMD). The data was used to produce trends on how rainfall and temperature varied over time in accordance to Patt et al. (2007). These were then compared with small-holder farmers’ perception on how climate had varied.
3.6 Data management and analysis
The first stage of data handling involved checking whether the interview schedules were consistently filled. Thereafter, the questions were numerically coded and responses stored in SPSS software (version 16) (Bryman and Cramer, 1999; Bryman, 2008) under assigned variable names. This was followed by data cleaning. After that, the data from household survey was subjected to descriptive statistics (frequencies, means and percentages) with the aim of displaying the data. In order to express the degree of correspondence between two random variables, chi square was used. Binary logistic regression model and multinomial choice model similar to the one used by Greene (2003) and Hassan & Nhemachena (2008) was fitted to the data from the survey of 200 households. This was done with the aim of determining how socio-economic factors influenced the level of adaptation to climate variability.
This was done upon subjecting the data to data reduction using Principal Component Analysis (PCA). The PCA was used to study the relationship among the various adaptation strategies. This was done by statistically grouping 10 adaptation strategies popularly used by small-holder farmers in the study area into 5 factors that represented the major adaptation strategies, similar to Barbier et al. (2009). Varimax rotation with Kaiser Normalization procedure was employed, similar to Mairura et al. (2007) and Ngetich (2012). The 5 factors were retained for subsequent analyses.
Data from FGDs and key informants interviews that was obtained by the use of open-ended questions was summarized according to key themes and illustrated by direct quotes, recounting particularly relevant experiences and views of smallholder farmers, essential for authenticity of findings in accordance to Newing (2011). Analysis of the data provided an insight into participants’ perspectives on their living situations and climate variability.
and temperature over the same period were also computed to show long-term trends of annual and seasonal rainfall and temperature using Equation 2 and 3 below (Tilahun, 2006):
For Positive Anomalies
Equation 2
For Negative Anomalies
Equation 3
Where: RAI is rainfall anomaly index, RF is actual rainfall for a given year, MRF is mean of the total Length of record, MH10 is mean of 10
highest values of rainfall of the period of record, ML10 is the lowest 10
CHAPTER FOUR
RESULTS AND DISCUSSION
4.1 Socio-demographic characteristics of respondents
In Tharaka sub-county, out of the 100 respondents, there were 85% and 15% male and female headed households respectively, while in Kitui-Central, out of the 100 respondents, there were 63% and 37% male and female headed households, respectively (Table 4.1).
Table 4.1: Socio-demographic characteristics of the respondents in Tharaka and Kitui-Central Sub-Counties
Parameters Tharaka (n=100) Kitui-Central (n=100)
Gender of HH head
Male 85 63
Female 15 37
Marital status of HH head
Single 3 10
Married 84 60
Divorced/separated & widowed
13 30
Education level
None 23 20
Primary 59 55
Post-Primary 18 25
Main occupation of HH head
Full time farmer 89 81
Part time farmer 11 19
Mean SD Mean SD
Age (years) 55.1 15.1 51.5 16.1
HH size (members) 7 3.0 6 2.3
Farming experience (years) 27 14.1 24 14.1
Total land size owned (acres)
10.2 10.1 4.4 3.7
Average area under maize crop (acres)
The higher percentage of male headed households in Tharaka and Kitui Central Sub-Counties was attributed to the fact that culture in the region dictates that men should be the heads of the household. In addition, men have a better access to land, assets, education and other critical services such as credit, technology and input supply. This therefore qualifies them to be the main decision makers in the household (FAO, 2010). The average age of the HH heads was 55.1 and 51.5 in Tharaka and Kitui-Central Sub-Counties, respectively and a relatively high number of them were fully involved in farming (89% and 81% in Tharaka and Kitui-Central Sub-Counties, respectively). In terms of implementation of adaptation strategies, such a population is likely to be more willing to access information on such strategies and take up even more labour intensive ones as compared to their elderly counterparts (Onu, 2007).
All the household heads were involved in farming for over 20 years (27 and 24 years) of farming experience in Tharaka and Kitui-Central Sub-Counties, respectively. They are therefore expected to have a better adaptation to climate variability owing to the fact that experienced farmers are expected to have more knowledge and information about climate variability (Maddison, 2006). Family size in Tharaka Sub-county was 7 members while in Kitui-Central Sub-county was 6 members (Table 4.1). This implies that family sizes were large and as was noted by Nyangena (2007), large family size is expected to be an enabling factor for farmers to take up labour intensive adaptation strategies. This is however contradicted by Tizale (2007) who noted that large family sizes might be forced to divert part of their labour into other off-farm activities so as to generate extra income.
study area can be regarded as being educated. Average farm sizes were higher in Tharaka Sub-county, 10.2 acres (4.08 hectares) compared to Kitui-Central Sub-county which was 4.4 acres (1.76 hectares). Despite the significant difference in farm sizes in the two sites, average area under maize cultivation was 1.5 acres (0.6 hectares) in Kitui Central and 1.4 acres (0.56 hectares) in Tharaka (Table 4.1).
4.2: Indigenous strategies and preparedness techniques employed by small-holder farmers in coping with climate variability in Tharaka-Nithi and Kitui Counties
4.2.1: Indigenous strategies employed by small-holder farmers in weather forecasting
Majority of the surveyed farmers were aware of the indigenous knowledge of weather forecasting (91% in Tharaka and 97% in Kitui-Central). They indicated different indigenous strategies of weather forecasting. These included observing changes in trees, sky, moon, wind and behavior of animals (Table 4.2). The use of these strategies varied between Tharaka and Kitui- Central Sub Counties (Table 4.2).
Table 4.2: Indigenous strategies of weather forecasting employed by small-holder farmers in Tharaka and Kitui-Central Sub Counties
Indigenous strategies (Changes in ;)
Sub-County name 2 P-Value
Tharaka (n=100)
Kitui (n=100) Total
Tree leaves’ colour 83 (83) 91 (91) 174 (87) NS
Behaviour of animals 79 (79) 74 (74) 153 (77) NS
Sky colour 64 (64) 87 (87) 151 (76) 0.001
Moon size/ shape 66 (66) 83 (83) 149 (75) 0.005
Wind direction 65 (65) 80 (80) 145 (73) 0.015
Values in parenthesis are in percentages
of the small-holder farmers in Kitui Sub-County while in Tharaka Sub-County 64% of the farmers used the strategy. On checking change in the moon, 83% of the small-holder farmers interviewed were employing the strategy while Tharaka Sub-County had 66% of the small-holder farmers using the strategy. Change in wind direction was a strategy employed by 80% of the interviewed small- holder farmers from Kitui Sub-County while in Tharaka Sub-County, 65% of the respondents used the strategy. These results confirm findings by Egeru (2012) that the indigenous prediction practices of using moon characteristics, tree phenology and particular animal behaviour patterns are still being utilized.
4.2.2: Preparedness/adaptation strategies used by small-holder farmers to cope with climate variability
Table 4.3: Adaptation strategies used by small-holder farmers when planning for maize production in Kitui Central and Tharaka Sub-counties
Preparedness Techniques Sub-County Chi-Square
(2) P Value Tharaka Kitui-
Central
Total
Changing of planting dates 92 (92) 83 (83) 175 (88) NS
Changing of crop varieties 79 (79) 81 (81) 160 (80) NS
Changing of crop spacing 40 (40) 83 (83) 123 (62) 0.001
Changing of crop types 81 (81) 72 (72) 153 (77) NS
Increasing the use of manure/ fertilizer
71 (71) 83 (83) 154 (77) NS
Water harvesting 32 (32) 91 (91) 123 (62) 0.001
Digging boreholes/ water pans 14 (14 ) 95 (95) 109 (55) 0.001
Agroforestry 48 (48) 75 (75) 123 (62) 0.001
Crop rotation 99 (99) 59 (59) 158 (79) 0.001
Storing food in stores to be used later
87 (87) 90 (90) 177 (89) NS
Values in parenthesis are in percentages.
There was a significant association between the use of changing of crop spacing as a strategy (p<0.001) and small-holder farmers in the two Sub-Counties with 83% of the interviewed farmers in Kitui-Central Sub-County using the strategy while only 40% of the farmers in Tharaka Sub-County used the strategy (Table 4.3). This implies that farmers in Kitui are more likely to use change of planting spacing more than those in Tharaka. The explanation of this according to the farmers in Kitui Central was that they had received numerous trainings from extension officers in the area on the importance of spacing. In Tharaka, the minimal use of crop spacing as a strategy was attributed by the farmers to lack of knowledge on the importance of spacing such that small-holder farmers in the area do not use a specified spacing but mainly broadcast their seeds.
the strategy (Table 4.3). Farmers attributed this to the fact that Kitui region lacks piped water and therefore farmers have to look for strategies to ensure water availability at all times. This lack of piped water in Kitui-Central further explains the significant association in the use of digging boreholes/water pans as a strategy in the two Sub-Counties (p<0.001) with 95% of the interviewed farmers in Kitui-Central Sub-County using it while only 14% of the farmers in Tharaka Sub-County were using the strategy. According to the interviewed small-holder farmers, this was also contributed by the many projects dealing with boreholes and water pans that have previously been implemented in Kitui Central.
There was a significant association (p<0.001) between the use of agro forestry and the Sub-Counties with 75% of the interviewed farmers in Kitui- Central Sub-County using the strategy while only 48% of the farmers in Tharaka Sub-County used the strategy (Table 4.3). This implies that farmers in Kitui Central were more likely to practice agro forestry than those in Tharaka. The explanation for this observation was that small-holder farmers in Kitui valued agro-forestry for multiple benefits and its contribution to soil fertility was said to override the others. They also added that Kenya Forestry Research Institute (KEFRI) had put a lot of effort in promoting agro-forestry in the area. Additionally, this can be supported by Jaetzold et al. (2006) in that, since fertilizing alone will only increase yields in the short term, means of obtaining a stable agro-biological system with continuous production, such as agro forestry becomes inevitable.
Basically, the significant associations between the use of the strategies and the Sub-Counties can be attributed to the difference in agro-ecological zonations (Jaetzold et al., 2006). The use of the various adaptation strategies is in line with Recha et al. (2011) who reported that small-holder farmers need to adopt different cropping systems and farm management strategies to curb the negative effects of climate variability. Their use can be attributed to the fact that natural hazards associated with climate variability such as droughts and floods greatly impact on small-holder farmers’ agricultural productivity (Slegers, 2008). This has therefore necessitated the farmers to devise a variety of adaptation strategies to enable them survive the adverse effects of climate variability (Bradshaw et al., 2004; Maddison, 2006; Nhemachena and Hassan, 2007; Hassan and Nhemachena, 2008; Kurukulasuriya and Mendelsohn, 2008; Deressa et al., 2009). Furthermore, such kinds of hazards invariably cause famine, food insecurity and poverty, hence adaptation becomes inevitable.
4.3: Integration of Indigenous and Conventional Knowledge of weather forecasting for adaptation to climate variability in Tharaka-Nithi and Kitui Counties
4.3.1: Indigenous Knowledge indicators used when planning for various activities in maize production
In planning for the various activities in maize production, small-holder farmers in the study area were found to make use of the IK differently. The main activities in which the IK indicators were used in maize production were found to be land preparation and determination of planting time with over 40% of the small-holder farmers using it when planning for the two activities. Only 10% of the farmers used the IK indicators to determine when to carry out weeding, harvesting and storage activities in the maize production process (Table 4.4).
Table 4.4:The IK indicators and their level of use (%) while planning for various field management and activities in maize production in the study area
IK Indicators Activities in maize production
Land preparation (%)
Planting (%)
Weeding (%)
Harvesting (%)
Storage (%)
Behaviour of plants 73 77 3 7 1
Behaviour of animals 60 69 1 9 1
Behaviour of sky 48 64 6 8 2
Behaviour of moon 46 57 9 7 2
Behaviour of wind 44 57 1 4 1
rituals were mainly performed by specialized people commonly referred to as the rainmakers. Key informants were able to recall how such ceremonies were performed especially after a long period of rainfall failure. For example, John Mugambi (87 years) from Tharaka explained that;
“………in case of a long period with no rains, we would get a black goat
together with two kids (male and female) and take them to our shrine. We could
then sing songs as the rainmaker repeatedly shouted that we wanted rains moving
round and round. We could then slaughter the goats, roast the meat as we
continued calling to our God and by the time the event was concluded, a lot of
rain could be experienced. In 1942, a memorable event occurred in that, after
such a ceremony was performed, torrential rains occasioned by heavy hailstones
were experienced and ended up killing livestock”.
In another acoount, Makau Mutuku (86 years) from Kitui explained that;
“……….in case of a prolonged period with no rains, we would organize a feast to
appease our gods and we could go to the shrines and slaughter a goat of one
colour (any colour). Only old people were allowed to go to the shrines for the
sacrifice but the rest of the people would be invited later to feast on the roasted
meat as we danced “kilumi”, a popular dance among the Kamba community
during those days so as to continue appeasing and provoking our gods. By the
time we left the shrine, heavy rains fell. We also had beliefs that entailed a
specialized person (a seer) being requested to foretell the quality of a season and
the seer could dream and then communicate the results of the dream to the rest of
us by advising on the most appropriate crops to grow in that particular season”.
modernity and education. The farmers also indicated that failure to perform such ceremonies had played a role in the recent rainfall failures they had been experiencing in the region.
4.3.2 Small-holder farmers’ perception of climate variability
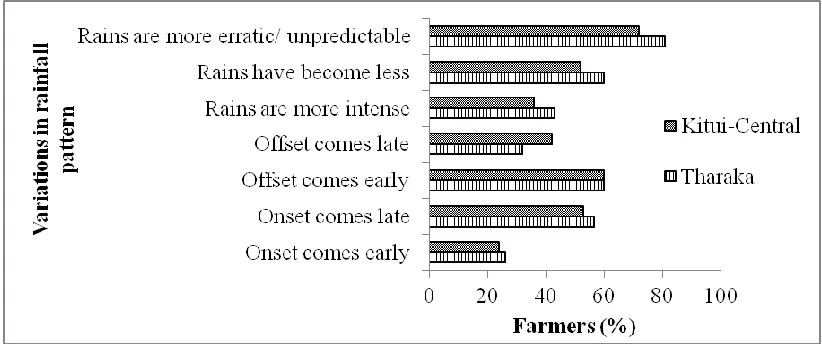
Results from household survey on farmers’ perceptions of rainfall and temperature variations in the study area showed that all the interviewed farmers noticed variations in rainfall patterns and temperature over the past 30 years (Figure 4.1).
Figure 4.1: Variations in rainfall pattern as perceived by small-holder farmers over the past 30 years
This observation concurs with the findings by Maddison (2007) and Mertz et al. (2009) that rainfall and temperature has been fluctuating in the recent past. The farmers were found to perceive the changes differently. The changes identified in rainfall patterns included; early rainfall on-set, late rainfall onset, early rainfall offset, late rainfall offset, more rainfall intensity, rainfall reduction and more erratic/unpredictable rainfall (Figure 4.1), similar to the changes highlighted by Bryan et al. (2010).
CEEPA (2006) that in Africa, rains have become less predictable. The change that was perceived by the least number of farmers (26% and 24% in Tharaka and Kitui-Central, respectively) was that the rains onset came early (Figure 4.1). Their perception of how rainfall and temperature was changing was considered crucial in anticipating the effects of climate variability. This is due to the fact that only farmers who perceive a problem will adapt to it (Nhemachena and Hassan, 2008). Key informants were able to recall variations that they had identified in climatic patterns from 1980s and they were asked if they had experienced any variations in climate over the period. All of the key informants from both sites recognized that climate had varied over time, in line with Maddison (2007) and Mertz et al. (2009). The major climatic parameters that were reported to have varied were rainfall and temperature patterns, in line with the findings by CEEPA (2006).
Similar to Gissila et al. (2004) and IPCC (2007), rainfall pattern were observed to have varied in such a way that it had become insufficient thus tampering with the cropping pattern. The kind of rains experienced were said to be of torrential nature and then cessation comes at an earlier stage than what was experienced in the past where the rains were quite systematic. Such kind of rains was said not to take maize (the staple crop in the study area) to maturity stage thus resulting to frequent crop failure. This concurs with Recha et al. (2011) that rainfall in the region varies a lot leading to frequent crop failure.
favour a local enhancement of precipitation with the resultant latent heating altering regional wind and moisture flux patterns, ultimately reducing LR precipitation (Funk et al., 2008) leading to the shorter growing period.
The small-holder farmers also identified events when rainfall has been higher than normal since 1980s. Results showed that such events were experienced in the year 1989/1990 and 1997/1998. The event in 1997/1998 was identified as the worst in the living memory and was referred to as EL-Niño, during which buildings and roads were destroyed thus hampering the day to day activities. This abnormally wet period similar to what was noted by Camberlin et al. (2001) destroyed crops especially in Tharaka Sub-County. However, in Kitui Central Sub-County, there was a bumper harvest as a result of the excess rainfall though the farmers were concerned that poor post-harvest handling resulted to maize being affected by aflatoxin. Majority of the small-holder farmers (over 80%) perceived temperatures to have increased in the recent years (Figure 4.2) as compared to what was experienced in the past.
Figure.4.2: Variations in temperature pattern as perceived by small-holder farmers in Tharaka and Kitui-Central
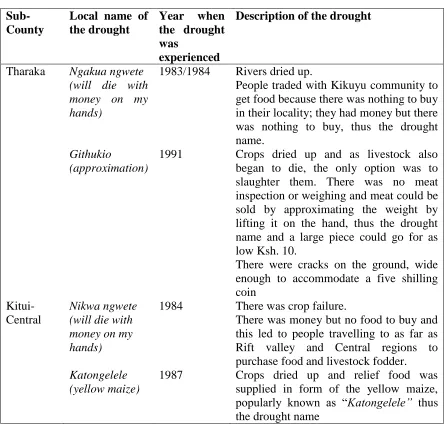
identified. These were 2009 in Tharaka Sub-County and 1983/1984, 2005, 2012 in Kitui Central Sub-County. Events of temperatures being higher than normal combined with rainfall failure were said to result to drought conditions. This corroborates with Few et al. (2006) who noted that the trends of increasing temperatures coupled with less reliable rainfall increases the likelihood of droughts in Kenya. Respondents were able to recall events when droughts have been experienced and results of the most extreme droughts from 1980 are shown in Table 4.5.
Table 4.5: Droughts experienced since 1980 in Tharaka and Kitui
Sub-County
Local name of the drought
Year when the drought was
experienced
Description of the drought
Tharaka Ngakua ngwete
(will die with money on my hands)
1983/1984 Rivers dried up.
People traded with Kikuyu community to get food because there was nothing to buy in their locality; they had money but there was nothing to buy, thus the drought name.
Githukio
(approximation)
1991 Crops dried up and as livestock also
began to die, the only option was to slaughter them. There was no meat inspection or weighing and meat could be sold by approximating the weight by lifting it on the hand, thus the drought name and a large piece could go for as low Ksh. 10.
There were cracks on the ground, wide enough to accommodate a five shilling coin
Kitui-Central
Nikwa ngwete (will die with money on my hands)
1984 There was crop failure.
There was money but no food to buy and this led to people travelling to as far as Rift valley and Central regions to purchase food and livestock fodder. Katongelele
(yellow maize)
1987 Crops dried up and relief food was
This occurrence of droughts was found to be in line with Anyamba and Tucker (2005). The study identified that in the analysis of Sahelian vegetation dynamics using Normalized Difference Vegetation Index (NDVI), the period between 1982 and 1993 was characterized by below average NDVI and persistent droughts. Also, Bryan et al. (2010) noted an increasingly prolonged periods of droughts over the past 20 years in some Kenyan regions.
4.3.3 Evidence of climate variability and trends from conventional knowledge
Based on the findings, the perceptions of small-holder farmers in regard to climate variability using their experiences from rainfall and temperature variability in the study area were traced back to the 1980s. Results from analysis of rainfall and temperature data from KMD traced from the same period supported the small-holder farmers’ perceptions on the years of occurrence of abnormal events in regard to rainfall and temperatures. Illustration of the trends of rainfall (Figure 4.3) and temperature data from KMD (1980 to 2012) showed variations over time.
Figure 4.3: Annual rainfall series and linear trends for Tharaka and Kitui Central Sub-Counties from 1980 to 2012
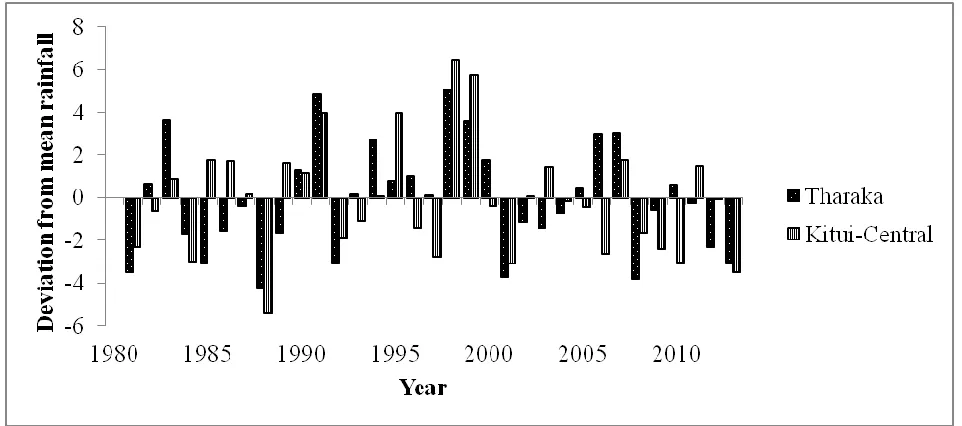
the entire study area thus supporting small-holder farmers’ perception. The trends were similar to the findings by Hulme et al (2005) who noted that inter-annual rainfall variability is large over most of Africa. Also, Christensen et al. (2007) and McSweeney et al. (2008) projected that there would be an increase in rainfall variability in Kenya. It was also observed that 1989/1990 and 1997/1998 seasons had higher rainfall thus confirming farmers’ observation of such events as El Nino that was said to have been experienced in 1997/1998. This was well reflected by the highly variable temporal rainfall pattern depicted by the rainfall anomalies (Figure 4.4) during the reference period.
Figure 4.4: Annual Rainfall anomalies for Tharaka and Kitui Central Sub-Counties from 1980 to 2012
Figure 4.5: Mean annual temperature series and linear trend for Tharaka and Kitui Central Sub-Counties from 1980 to 2012
The variation reported by the farmers was also evident from the trends and the anomalies on temperature which shows events of fluctuations in temperature throughout the reference period (Figures 4.5, 4.6 and 4.7). The fact that temperature has been increasing recently was also clearly reflected by the anomalies. The observed minimum temperatures (Figure 4.6) reflected more positive anomalies in the recent years (from the year 2000).
Similarly, the observed maximum temperatures (Figure 4.7) reflected more positive anomalies in the recent years (from the year 2000).
Figure 4.7: Annual mean maximum temperature anomalies for Tharaka and Kitui Central Sub-Counties from 1980 to 2012
4.3.4: Integration of conventional and indigenous knowledge of weather forecasting
An overview of small-holder farmers’ experience on the use of the knowledge on local indicators based on a combination of trees, animals, sky, wind and moon was given. On observing change in behaviour of these strategies, the small-holder farmers were able to predict the local weather and then interpret based on the implication of the changes in regard to weather forecasting. These were said to help them prepare accordingly in regard to their agricultural activities. For instance, changes in the phenology of specific trees was used as indicators in prediction of weather. Likewise, changes in the behaviour and movement of animals such as cattle, snakes, bees, specific insects and birds were observed and interpreted accordingly. The behaviour of the sun, wind and appearance of the sky and moon were also used in forecasting.
they made included change in the colour of leaves of a tree locally referred to as “Githumura” from green to reddish brown and insects commonly referred to as “Ivandaathano” were seen jumping up and down for a prolonged period of time. Similarly, birds commonly referred to as “Thugururu” were spotted flying in groups towards the same direction. A very strong wind blowing in a circular motion repeatedly was also experienced (Table 4.6).
Table 4.6: Specific indigenous indicators used in weather forecasting in Kitui Central
Indicators (general term)
Specific indicators
Observation Prediction Implications
Trees “Githumura” Changes from green
to reddish-brown
Wet conditions approaching
Start land
preparations in the field
Animals
Insects-“Ivandaathano”
Jumping up and
down for a
prolonged period (a day or two)
Wet conditions Approaching
Land preparations in the field should start
Birds- “Ivulu”
Walking along
rivers
Rains will
resume after a break
Start weeding the
crops
Birds-
“Thugurururu”
Flying in groups
towards one
direction
Rains
expected in the next 1 or 2 days
Prepare accordingly
Cattle Running all over More rains
expected
Prepare accordingly
Snakes Invading their
homesteads
Persistence
of a dry
spell
Danger of an
agricultural drought
Sky Sky 3-5 stars seen
appearing on the sky
More rains expected
Prepare accordingly
Wind Wind A very strong wind
blowing in circles and repeatedly for some days
Rains are
just about to begin
Prepare seeds in
readiness for planting
same time, insects commonly referred to as “Miunjuri” were seen jumping up and down for a prolonged period of time. Similarly, glaring sun with much heat was also experienced (Table 4.7).
Table 4.7: Specific indigenous indicators used in weather forecasting in Tharaka
Indicators (general term)
Specific indicators
Observation Prediction Implications
Trees -Fig tree
(Mugumo), Acacia (Mugaa) and Baobab (Muramba)
Re-growth Onset of
rains
Land preparation in the fields
Animals Insects (Miunjuri)
Jumping up and down but very close to the ground for a prolonged period
Rains will begin
Prepare accordingly
and start planting
Sky Sky Clear during full moon Low
rainfall to drought conditions
Early planting would be beneficial. Also planting of drought tolerant crops
Moon Moon When the moon is
slightly tilted to the west and the crescent is facing down during the months
of September and
October
Imminent rainfall
Intercrop and plant even crops that do well only when there are enough rains.
Sun Glaring sun and very hot Rains will
begin
Prepare lands to plant
Sun Sun Glaring sun with no
much heat
Inadequate rains
Plant drought resistant crops
Sun Its movement towards the
Kianjege mountain
observed very early in the morning (5 am). If it passes a point called kirikuyu and goes beyond it,
Long dry
spell expected
All these observations (in Table 4.6 and 4.7 above) were made during the first week of March 2013 and gave a signal that rains were about to start. Consequently, farmers prepared their lands in readiness for planting. These local indicators used to predict the weather in the study area were found to be similar to those highlighted by Chang’a et al. (2010) and Kijazi et al. (2012) in Tanzania.
Conventional data from KMD showed that the onset of the long rains was 8th and 13th March 2013 in Kitui Central and Tharaka Sub-Counties respectively (Figure 4.8). This therefore concurred with the observations made by the small-holder farmers in the first week of March.
Figure 4.8: Rainfall distribution during the study period for (a) Kitui Central and (b) Tharaka Sub-Counties
Note: Day 1 represents 1st March
(2004), they are key in making decisions regarding agricultural production since they dictate the right time to begin land preparation in readiness for planting.
4.4: Influence of household socio-economic factors on the level of adaptation to climate variability in Tharaka-Nithi and Kitui Counties
4.4.1: Farmers’ level of adaptation to climate variability
Farmers’ level of adaptation was measured by the extent of use of the various adaptation strategies in Tharaka and Kitui Central Sub-Counties. Factor analysis indicated a significance of 0.001 and Kaiser-Meyer-Olkin (KMO) measure of sampling adequacy of 0.76, a clear indication that the solution was statistically viable. Five factors were identified to represent the 10 adaptation strategies popularly employed by the small-holder farmers to adapt to climate variability. The 5 identified factors had a total explained variance of 64.3% indicating that the percentage of the original data that was explained and had Eigen values that were greater than 1 (Table 4.8).
Table 4.8: Extent of utilization of climate variability adaptation strategies (indicating level of adaptation) by small-holder farmers on maize crop in the study area
Parameters
Component (Factor) Comm
unaliti es (%)
1 2 3 4 5
Extent of use of crop rotation 0.73 60
Extent of use of changing planting dates 0.70 54
Extent of use of changing crop spacing 0.77 63
Extent of use of storing food in stores to
be used later 0.71 55
Extent of use of agro forestry 0.79 74
Extent of use of increasing the use of
manure/fertilizer 0.64 65
Extent of use of water harvesting 0.81 74
Extent of use of changing crop types -0.60 72
Extent of use of digging boreholes/water
pans 0.80 74
Extent of use of changing crop varieties -0.64 53
Eigen Values 1.5 1.3 1.3 1.2 1.1
%Explained variance 15.3 13.3 13.2 11.7 10.8
% Cumulative variance 15.3 28.6 41.8 53.5 64.3
Extraction Method: Principal Component Analysis; Rotation Method: Varimax with Kaiser Normalization; Kaiser-Meyer-Olkin Measure of Sampling Adequacy (0.76, Chi-square=107.5, Sig=0.001); Cut point for loadings and communalities=0.5
because the use of the two strategies had a negative correlation in such a way that small-holder farmers who dig boreholes/ water pans do not change crop varieties and they do not make use of most of the other popular strategies. The strategies in factor 4 and 5 (with negative correlations) can be collectively referred to as tactical management strategies because decisions for their use calls for a foresight and were made based on the expected or forecasted weather conditions.
The 5 extracted factors explained percentages of variance in the popularly used adaptation strategies by small-holder farmers in the study area. These were, 60% in the extent of use of crop rotation, 54% in changing planting dates, 63% in changing crop spacing, 55% in storing food in stores to be used later, 73% in agro forestry, 64% in increasing the use of manure/fertilizer, 73% in water harvesting, 72% in changing crop types, 73% in digging boreholes/water pans and 53% in changing crop varieties as indicated by their communalities (Table 4.8).
This section also presents descriptive statistics, the estimated p-levels of the predictor variables from the Multinomial Logit Regression (MNLR) and Binary Logistic Regression model at statistical significance of 5% probability level. The estimation of the MNLR model for this study was undertaken by normalizing one category (the reference/base category) as being the third category (high adaptation to climate variability) and therefore all results were explained in reference to this category. This was in respect to the level of use of crop adjustment factor, crop management factor, soil fertility management factor and water harvesting & crop types factor.
4.4.2 The extent of use of crop adjustment factor