P R O C E E D I N G S
Open Access
Two-stage study designs combining
genome-wide association studies, tag single-nucleotide
polymorphisms, and exome sequencing: accuracy
of genetic effect estimates
Laura L Faye
1,2, Shelley B Bull
1,2*From
Genetic Analysis Workshop 17
Boston, MA, USA. 13-16 October 2010
Abstract
Genome-wide association studies (GWAS) test for disease-trait associations and estimate effect sizes at tag single-nucleotide polymorphisms (SNPs), which imperfectly capture variation at causal SNPs. Sequencing studies can examine potential causal SNPs directly; however, sequencing the whole genome or exome can be prohibitively expensive. Costs can be limited by using a GWAS to detect the associated region(s) at tag SNPs followed by targeted sequencing to identify and estimate the effect size of the causal variant. Genetic effect estimates obtained from association studies can be inflated because of a form of selection bias known as the winner’s curse. Conversely, estimates at tag SNPs can be attenuated compared to the causal SNP because of incomplete linkage disequilibrium. These two effects oppose each other. Analysis of rare SNPs further complicates our understanding of the winner’s curse because rare SNPs are difficult to tag and analysis can involve collapsing over multiple rare variants. In two-stage analysis of Genetic Analysis Workshop 17 simulated data sets, we find that selection at the tag SNP produces upward bias in the estimate of effect at the causal SNP, even when the tag and causal SNPs are not well correlated. The bias similarly carries through to effect estimates for rare variant summary measures. Replication studies designed with sample sizes computed using biased estimates will be under-powered to detect a disease-causing variant. Accounting for bias in the original study is critical to avoid discarding disease-associated SNPs at follow up.
Background
Selection bias in genetic association studies arises when the same sample is used for both gene discovery and effect estimation. Under the low power that is common in a gen-ome-wide association study (GWAS), selection causes upward bias in the magnitude of genetic effect estimates because the effect size is estimated only when the test sta-tistic exceeds the threshold for significance. This
phenom-enon is also known as the winner’s curse, and its effect on
linkage analyses and on case-control association was demonstrated by Goring et al. [1] and Garner [2], respec-tively. In a two-stage design, the correlation between the
tag single-nucleotide polymorphism (SNP) used for selec-tion and one or more causal variants adds complexities to
the understanding of the winner’s curse.
Linkage disequilibrium causes the test statistics and effect size estimates at the tag and causal SNPs to be correlated. Linkage disequilibrium can be quantified by
r2
or other measures, but in this case we focus on the
Pearson correlation coefficientr as an estimate of
corre-lationr. Low correlation between the tag SNP and
cau-sal SNPs decreases the power to detect the effect at the tag SNP, which induces upward selection bias in both the tag and causal SNP estimates. On the other hand, as correlation decreases, the tag effect attenuates and selec-tion at the tag SNP exerts less influence on the estimate at the causal SNP [1-3]. The balance between these two trends determines the degree of bias in the estimates.
* Correspondence: [email protected]
1
Dalla Lana School of Public Health, University of Toronto, Health Sciences Building, 155 College Street, Toronto, ON M5T 3M7, Canada
Full list of author information is available at the end of the article
Faye and BullBMC Proceedings2011,5(Suppl 9):S64 http://www.biomedcentral.com/1753-6561/5/S9/S64
Sequencing studies can uncover rare SNPs, for which conventional tests, such as single-SNP linear or logistic regression, are not powerful. Recently, methods to test for and estimate the effect size of multiple rare variants have been proposed. Several investigators have proposed a region-specific regression method that collapses geno-types at all rare variants in a specified region [4,5].
Within the region,ni is the number of rare SNPs
geno-typed for individual i, riis the number of rare SNPs at
which individuali has a rare allele, and the independent
variable isri/ni. Morris and Zeggini define the regression
parameter las the genetic effect size for an individual
carrying the rare allele at each of thesenirare SNPs [4].
In a two-stage design the relationship between the tag SNP and a rare causal SNP is complicated by the minor allele frequency (MAF) and the contribution of multiple
causal SNPs to ri/ni. The correlation coefficient r
between two SNPs has an upper bound that depends on the difference between the MAFs. A tag SNP with MAF > 5% will capture little of the variation at a rare SNP with MAF < 0.1%, especially in a small sample. A tag SNP with a low MAF tends to do better at capturing variation at a rare causal SNP. When multiple rare SNPs contribute to the genetic score for an individual, a useful tag SNP would be correlated with multiple SNPs.
In this paper, we study the consequences of a two-stage design for estimating the genetic effect at both the GWAS and sequencing stages. Using the Genetic Analy-sis Workshop 17 (GAW17) unrelated mini-exome data set [6] and the corresponding tag SNP genotypes drawn from the publicly available HapMap data set [7], we
esti-mate the magnitude of the winner’s curse and the
attenuation resulting from incomplete correlation between the tag SNP and causal SNPs. We demonstrate that selection bias occurs in both stages, even when the tag SNP is poorly correlated with the rare or the com-mon causal SNP(s).
Methods
We examine three different two-stage scenarios described below in which first a genetic effect is detected at a tag SNP in a GWAS, then the gene is sequenced to find the true causal SNP(s), and finally the genetic effect is estimated at the true causal SNP(s). We compare the distribution of genetic effect estimates over varying correlations between the tag SNP and the causal SNP and over varying MAFs at both SNPs. The exami-nation of the design matrix for the additive model
shows that the relevant quantity, gTC, for comparing
the tag SNP and causal SNP effects is:
gTC C C r
MAF, and rTC is the correlation between the tag SNP
and causal SNPs. Without loss of generality, we userTC
to refer to both the correlation parameter and the Pear-son correlation coefficient in the finite sample.
For analysis, we classify the GAW17 data into the fol-lowing subpopulations: CEPH (European-descent Utah residents), Chinese, Japanese, Tuscan, Luhya, Yoruba, Europeans (CEPH + Tuscan), Asians (Chinese + Japa-nese), and Africans (Luhya + Yoruba). We define a com-mon SNP as one with MAF > 5% and a rare SNP as one
with MAF < 5% within a subpopulation. We computeri/
ni over all rare SNPs in a gene. We use a linear model
with covariates Age and Smoking for trait Q1 and no covariates for Q2, as specified in the simulation model. To avoid sparse data when stratifying by ethnicity, we use a logistic model with no covariates for disease status.
Scenario 1: common tag SNP, common causal SNP
In the first scenario, the tag SNP detected in the stage 1 GWAS is common and the causal SNP found in the stage 2 sequencing study is also common. We construct a two-stage study combining the GAW17 data set with the HapMap data set as follows. For the stage 1 GWAS, we obtain genotypes at tag SNPs for the individuals in the GAW17 data set (matched by individual ID) from the HapMap data set (build 36, available at http://hap-map.ncbi.nlm.nih.gov) [7]. For the stage 2 sequencing study, we use the GAW17 mini-exome data set for unrelated individuals. We included all 616 subjects for which there was genotype data in both the HapMap build 36 and GAW17 data sets.
For each stage 1 tag SNP, we test for additive genetic effect with trait Q2 using a linear model and select all
data sets that are significant at ap-value threshold of
0.05. For each data set in which the tag SNP is significant, we estimate the effect at the tag SNP. In stage 2, we esti-mate the additive genetic effect size for the common
cau-sal SNP or rare SNP collapsing statisticri/nifor all data
sets in which the tag SNP is significant. We compare the estimates obtained from data sets in which the tag SNP is significant with the estimates obtained for all 200 data sets. PLINK was used for all analyses [8,9].
We describe the distribution of estimates using a box-plot (Figure 1). We present results for quantitative trait Q2 with causal SNP C6S5380 and tag SNPs from the
HapMap data set that fall within the VNN1 gene, as
correlated with the causal SNP. Because we observed large effect sizes for this uncorrelated tag SNP on both
sides of the null value, we used a one-sided test (a =
0.025) to ensure that the boxplot would reflect the mag-nitude of the effect. Using the causal SNP as its own tag, we also include the case in which the tag SNP is perfectly correlated with the causal SNP. In Figure 1 we present 4 boxplots for each tag SNP: (1) the causal SNP genetic effect estimates over all 200 replicates (light blue), (2) the tag SNP estimates over all 200 replicates (orange), (3) the tag SNP estimates for all replicates in which the tag SNP is significant (red), and (4) the causal SNP estimates for all replicates in which the tag SNP is significant (blue).
Scenario 2: common tag SNP, multiple rare causal SNPs
In the second scenario, the tag SNP is common and there are multiple rare causal SNPs in the same gene at the sequencing stage. We construct a two-stage study from the GAW17 data set using all 697 individuals: The com-mon SNPs are used as tag SNPs and the rare SNPs are used as sequencing SNPs. For each stage 1 tag SNP, we test for additive genetic effect with traits Q1, Q2, and dis-ease status and select all data sets for which the tag SNP
p-value is smaller than the significance threshold (the
threshold was chosen so that estimated power was less than 20%) indicated in Table 1. We estimate the additive
genetic effects of the parameterbat the tag SNP and the
parameterlfor theri/nirare SNP collapsing statistic.
-0
causal SNP - no selection
tag SNP - no selection
tag SNP with selection at tag
causal SNP with selection at tag
causal SNP - no selection
tag SNP - no selection
tag SNP with selection at tag
causal SNP with selection at tag
causal SNP - no selection
tag SNP - no selection
tag SNP with selection at tag
causal SNP with selection at tag
causal SNP - no selection
tag SNP - no selection
tag SNP with selection at tag
causal SNP with selection at tag
causal SNP - no selection
tag SNP - no selection
tag SNP with selection at tag
causal SNP with selection at tag
Figure 1Distribution of estimates for a common tag SNP and a common causal SNP.Boxplot of estimates of genetic effect at a tag SNP (GWAS stage 1) and causal SNP C6S5380 (sequencing stage 2) on quantitative trait Q2 over 200 replicates with and without selection at a stage 1 tag SNP for additive genetic effect using a selection thresholdp< 0.05.pCis the MAF of the causal SNP,pTis the MAF of the tag SNP,rTCis
the correlation between the tag SNP and the causal SNP. Horizontal lines are the null effect size (zero) and the mean of causal SNP genetic effect estimates without selection. Because of sampling variation, the mean is different from the median (band in middle of boxplots).
Faye and BullBMC Proceedings2011,5(Suppl 9):S64 http://www.biomedcentral.com/1753-6561/5/S9/S64
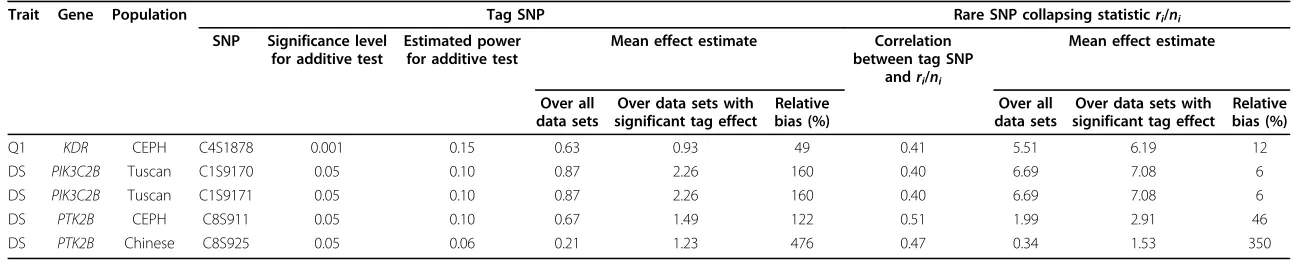
Table 1 Bias in genetic effect estimates for a common tag SNP and multiple rare causal SNPs
Trait Gene Population Tag SNP Rare SNP collapsing statisticri/ni
SNP Significance level for additive test
Estimated power for additive test
Mean effect estimate Correlation between tag SNP
andri/ni
Mean effect estimate
Over all data sets
Over data sets with significant tag effect
Relative bias (%)
Over all data sets
Over data sets with significant tag effect
Relative bias (%)
Q1 KDR CEPH C4S1878 0.001 0.15 0.63 0.93 49 0.41 5.51 6.19 12
DS PIK3C2B Tuscan C1S9170 0.05 0.10 0.87 2.26 160 0.40 6.69 7.08 6
DS PIK3C2B Tuscan C1S9171 0.05 0.10 0.87 2.26 160 0.40 6.69 7.08 6
DS PTK2B CEPH C8S911 0.05 0.10 0.67 1.49 122 0.51 1.99 2.91 46
DS PTK2B Chinese C8S925 0.05 0.06 0.21 1.23 476 0.47 0.34 1.53 350
Results for scenario 2. Values computed as described in the Results section. DS is disease status.
BMC
Proceedings
2011,
5
(Suppl
9):S64
tral.com/1753
-6561/5/S9/S
64
Page
4
of
Scenario 3: tag SNP with MAF 1–5%, multiple rare causal SNPs
In the third scenario, we consider the case in which the tag SNP has a low MAF and there are multiple rare cau-sal SNPs in the same gene in the sequencing stage. We construct a two-stage study from the GAW17 data set using all 697 individuals: Each SNP in a causal gene with MAF between 1% and 5% is in turn used as the GWAS tag SNP; the rest are used as sequencing SNPs (i.e., the tag SNP is excluded from the collapsing
statis-tic ri/ni). For each tag SNP, we test for additive genetic
effect with traits Q1, Q2, and disease status. We select data sets and estimate effect sizes as in scenario 2.
Results
We use boxplots or summary measures to describe the effect of selection on the distribution of estimates at the tag SNP and causal SNPs. For scenario 1, we test at a fixed threshold for significance (Figure 1). For scenarios 2 and 3, we select significance thresholds required for low power. Power is estimated as the proportion of data sets for which the tag SNP test is significant. The mean effect estimate is computed over all 200 data sets and is also computed over all data sets for which the tag SNP additive test is significant. We compute the summary measure relative bias as the difference between the mean estimate over data sets for which the tag SNP is significant and the mean estimate over all 200 data sets, divided by the mean estimate over all 200 data sets (Table 1 and 2).
Scenario 1
The expected pattern of attenuation resulting from imperfect correlation is evident in the distributions of the genetic effect estimates at the tag SNP and causal SNP. The tag SNP estimates (Figure 1, orange boxplots)
increase with the gTCquantity from equation 1.
Selec-tion for significant genetic effect at the tag SNP induces
upward bias into the estimate. As gTC increases, the
power increases and the effect of selection decreases. The difference between the tag SNP estimates with and
without selection is much smaller when gTC is larger
(Figure 1, orange and red box plots). When gTCis 0, as
for the null case, only the most extreme data sets are selected, and the bias away from the null value is large.
WhengTCis 1, power is high and the bias is smaller.
Because of correlation between the tag SNP and the causal SNP, selection bias in the tag SNP estimate carries through to the causal SNP estimate. Two factors influ-ence the bias at the causal SNP: (1) the correlation between the tag SNP and the causal SNP and (2) the
power to detect the effect at the tag SNP. WhengTCis
small, power is low and so the upward bias resulting
from selection at the tag SNP is large. AsgTCincreases,
power increases and selection bias decreases. On the
other hand, whengTCis small, the correlation between
the tag SNP and causal SNP estimates is small, and so the effect of selection at the tag SNP, although large, car-ries through to the causal SNP only to a small degree. As
gTCincreases, the correlation increases and the effect of
selection, although small, is carried through to a greater degree. These two effects tend to balance each other out
so that the bias is similar over the small range ofgTCin
the tag SNPs that we examined. The exceptions are at the extremes. If the tag SNP and the causal SNP are com-pletely uncorrelated, then none of the selection at the tag SNP carries through to the causal SNP (Figure 1, box-plots at far left). If the tag and causal SNPs are perfectly correlated (in our case the tag SNP is in fact the causal SNP), then power to detect the SNP is so high that selec-tion bias is minimal (Figure 1, boxplots at far right).
Scenario 2
Rare causal SNPs can be difficult to tag with common SNPs because of the upper bound for correlation between two SNPs with different MAFs. In causal genes with multiple rare SNPs, we found 68 SNPs with MAF > 5%. Of these, there were only five SNPs that tagged
the effect of the rare SNPs (correlation withri/niwasr
> 0.4 for power to detect effect above significance level
afor at least one ofa= 0.001, 0.01, or 0.05). The
corre-lation was low in all five cases (Table 1). The mean tag SNP genetic effect estimate was inflated by selection. Estimates of the rare SNP parameter were biased but to a lesser degree. When there is imperfect correlation between the tag SNP and causal SNPs, some but not all of the selection bias at the tag SNP is transferred to the causal SNP estimate.
Scenario 3
Rare causal SNPs can be more easily tagged with low-MAF SNPs, because two SNPs with similar low-MAFs have a higher upper bound for correlation. In causal genes with multiple rare SNPs, we found 162 SNPs with MAF between 1% and 5%. Of these, 12 tagged the effect of the rare SNPs (as defined earlier). The corre-lation was much higher for these rare tag SNPs than for the common tag SNPs in scenario 2. Bias in the estimate at the tag SNP was, on average, more severe when power was low (Table 2), and relative selection
bias atri/niwas also more severe when power was low,
although that bias was usually smaller at the causal SNP than at the tag SNP. When we examined cases
for which the tag SNP bias was similar (152–186%),
bias for the ri/ni estimate tended to be higher when
correlation was higher. This demonstrates how with higher correlation, more of the tag SNP bias is trans-ferred to the causal SNP.
Faye and BullBMC Proceedings2011,5(Suppl 9):S64 http://www.biomedcentral.com/1753-6561/5/S9/S64
Table 2 Bias in genetic effect estimates for a rare tag SNP and multiple rare causal SNPs
Trait Gene Population Tag SNP Rare SNP collapsing statisticri/ni
SNP Significance level for additive test
Estimated power for additive test
Mean effect estimate Correlation between tag SNP
andri/ni
Mean effect estimate
Over all data sets
Over data sets with significant tag effect
Relative bias (%)
Over all data sets
Over data sets with significant tag effect
Relative bias (%)
Q1 FLT4 Chinese C5S5141 0.01 0.075 0.52 1.00 94 0.46 3.26 4.05 24
Q2 PLAT Luhya C8S1797 0.05 0.105 0.29 0.98 241 0.46 0.37 1.71 356
Q2 SREBF1 CEPH C17S1023 0.05 0.135 0.59 1.63 177 0.81 2.00 3.97 98
Q2 VLDLR Tuscan C9S404 0.01 0.055 0.84 2.28 173 0.51 0.99 2.53 155
Q2 VLDLR Tuscan C9S471 0.01 0.055 0.84 2.28 173 0.51 0.99 2.53 155
Q2 VWF CEPH C12S193 0.01 0.070 0.34 0.93 171 0.65 0.61 1.12 85
Q2 VWF CEPH C12S200 0.01 0.080 0.41 1.15 182 0.61 0.57 1.04 84
Q2 VWF CEPH C12S203 0.05 0.075 0.21 0.53 157 0.48 0.63 0.93 47
Q2 VWF CEPH C12S211 0.01 0.070 0.34 0.87 152 0.78 0.65 1.39 113
Q2 VWF Japanese C12S193 0.05 0.070 0.21 0.72 244 0.56 -0.12 0.36 403
Q2 VWF European C12S193 0.05 0.200 0.31 0.79 153 0.62 0.55 1.03 87
Q2 VWF European C12S200 0.01 0.070 0.30 0.92 203 0.45 0.49 0.95 93
Q2 VWF European C12S203 0.05 0.070 0.18 0.50 180 0.46 0.58 0.85 47
Q2 VWF European C12S211 0.01 0.055 0.32 0.90 186 0.74 0.59 1.22 107
Q2 VWF All C12S203 0.05 0.140 0.16 0.41 160 0.48 0.69 1.06 54
DS PTK2B CEPH C8S883 0.05 0.075 0.95 2.40 153 0.53 2.35 13.83 489
DS PTK2B Chinese C8S885 0.05 0.050 0.16 1.24 692 0.87 0.38 2.68 610
DS PTK2B European C8S911 0.05 0.130 0.63 1.27 102 0.50 2.04 2.86 40
Results for scenario 3. Values computed as described in the Results section. DS is disease status.
BMC
Proceedings
2011,
5
(Suppl
9):S64
tral.com/1753
-6561/5/S9/S
64
Page
6
of
Discussion
Our mini-exome two-stage study design was different from a genome-wide two-stage study design in several ways. The sample size was small (hundreds instead of
thousands of SNPs), thep-value threshold for selection
was large (a= 0.05 instead of 10−6), and the correlation
was less than ideal in most cases. The low correlation resulting from linkage disequilibrium between the causal and tag SNPs attenuated the effect size at the tag SNP, causing tag SNP estimates to fall well below the true cau-sal SNP effect size. With a better set of tag SNPs, the attenuation would be less severe. To obtain an adequate number of significant data sets for each tag SNP, we used a liberal threshold for selection. A genome-wide
signifi-cance level (10−6) would have decreased power, causing
selection bias to be more severe.
Dickson et al. [10] demonstrated how multiple rare cau-sal SNPs can be correlated with a single common tag SNP and can produce an apparent association at that tag SNP. Their simulation studies also showed that this synthetic association can occur over long ranges, often longer than would be covered by targeted resequencing around an associated GWAS SNP. In our study, we searched for tag
SNPs that were correlated withri/niwithin the same gene
and did not find more than two. In practice, expanding the examined regions may detect additional tag SNPs
cor-related with theri/nistatistic for the region, but at the cost
of additional sequencing.
Recently, methods have been proposed to correct for upward bias in genetic effect estimates at a GWAS tag SNP caused by selection at that same tag SNP [3,11]. Extensions of the methods are needed for two-stage designs in which upward bias at one or more stage 2 sequencing SNPs is caused by selection at an imperfectly correlated stage 1 GWAS tag SNP. Selection bias is of practical importance when designing a replication study. If the sample size is estimated from an upward-biased esti-mate of effect size at the causal SNP, then the replication study may be underpowered to detect the true association. Reliable estimates of genetic effect are also important for clinical interpretation and estimation of the proportion of heritability explained.
Conclusions
Targeted resequencing following a GWAS is becoming a cost-effective way to uncover causal variants not included in commercial genotyping chips. Because of low power, many association studies will be of low to moderate signif-icance and follow-up studies will be required to confirm the associations. If the causal SNP genetic effect estimate in the original study is biased, then power to detect this SNP in a follow-up study will also be overestimated, and true associations not replicated because of low power may be misinterpreted as null associations. One might expect
that when tag and causal SNPs are not well correlated, the effect of selection on the causal SNP estimate will be negli-gible. Our work indicates that this is not the case. To avoid discarding disease-associated SNPs in the follow-up stage, it is critical that investigators account for selection bias in the original resequencing study.
Acknowledgments
This research was funded by the Canadian Institutes of Heath Research (operating grant MOP-84287 to SBB; doctoral research award MDR-88001 to LF). The Genetic Analysis Workshop is supported by National Institutes of Health grant R01 GM031575.
This article has been published as part ofBMC ProceedingsVolume 5 Supplement 9, 2011: Genetic Analysis Workshop 17. The full contents of the supplement are available online at http://www.biomedcentral.com/1753-6561/5?issue=S9.
Author details 1
Dalla Lana School of Public Health, University of Toronto, Health Sciences Building, 155 College Street, Toronto, ON M5T 3M7, Canada.2Samuel
Lunenfeld Research Institute of Mount Sinai Hospital, 60 Murray Street, Box 18, Toronto, ON M5T 3L9, Canada.
Authors’contributions
LF and SBB conceived of the study. LF designed and carried out the analyses and drafted the manuscript. All authors read and approved the final manuscript.
Competing interests
The authors declare that there are no competing interests.
Published: 29 November 2011
References
1. Göring HH, Terwilliger JD, Blangero J:Large upward bias in estimation of locus-specific effects from genomewide scans.Am J Hum Genet2001,
69:1357-1369.
2. Garner C:Upward bias in odds ratio estimates from genome-wide association studies.Genet Epidemiol2007,31:288-295.
3. Faye LL, Sun L, Dimitromanolakis A, Bull SB:A flexible genome-wide bootstrap method that accounts for ranking- and threshold-selection bias in GWAS interpretation and replication study design.Stat Med2011,
30(15):1898-1912, doi: 10.1002/sim.4228.
4. Morris AP, Zeggini E:An evaluation of statistical approaches to rare variant analysis in genetic association studies.Genet Epidemiol2010,34:188-193. 5. Dering C, Pugh E, Ziegler A:Statistical analysis of rare sequence variants:
an overview of collapsing methods.Genet Epidemiol2011,X(suppl X):X-X. 6. Almasy LA, Dyer TD, Peralta JM, Kent JW Jr, Charlesworth JC, Curran JE,
Blangero J:Genetic Analysis Workshop 17 mini-exome simulation.BMC Proc2011,5(suppl 9):S2.
7. International HapMap Consortium:A second generation human haplotype map of over 3.1 million SNPs.Nature2007,449:851-861.
8. Purcell S:PLINK, version 1.07., http://pngu.mgh.harvard.edu/purcell/plink/ (accessed September 12, 2010).
9. Purcell S, Neale B, Todd-Brown K, Thomas L, Ferreira MAR, Bender D, Maller J, Sklar P, de Bakker PIW, Daly MJ,et al: PLINK: a tool set for whole-genome association and population-based linkage analysis.Am J Hum Genet2007,81:559-575.
10. Dickson SP, Wang K, Krantz I, Hakonarson H, Goldstein DB:Rare variants create synthetic genome-wide associations.PLoS Biol2010,8(1):e100029. 11. Sun L, Dimitromanolakis A, Faye L, Bull SB:BR-squared: a practical solution to
the winner’s curse in genome-wide scans.Hum Genet2011,129:545-552.
doi:10.1186/1753-6561-5-S9-S64
Cite this article as:Faye and Bull:Two-stage study designs combining
genome-wide association studies, tag single-nucleotide polymorphisms,
and exome sequencing: accuracy of genetic effect estimates.BMC
Proceedings20115(Suppl 9):S64. Faye and BullBMC Proceedings2011,5(Suppl 9):S64
http://www.biomedcentral.com/1753-6561/5/S9/S64