EXPRESS LETTER
Three-dimensional S-wave attenuation
structure in and around source area of the 2018
Hokkaido Eastern Iburi Earthquake, Japan
Ryoichi Nakamura
*and Takahiro Shiina
Abstract
We investigate S-wave attenuation (Qs) structure in and around Hokkaido, Japan, including the source area of the 2018 Hokkaido Eastern Iburi Earthquake (M 6.7) and its aftershocks. From the strong-motion seismograms recorded in the nationwide seismograph network in Japan, we compute spectrum amplitude at 1–10 Hz with every 1 Hz and then estimate Qs structure by adopting tomographic inversion technique. The obtained Qs structure suggests that lateral variations of Qs are remarkably formed in the study areas. The low-Qs anomalies distributing north to south are imaged in both sides of the Hidaka mountain range which is built in the central Hokkaido. These characteristics tures of Qs are extended from the ground surface to depths by about 50 km, indicating that heterogeneous struc-tures resulted from the collision of the Kuril and northeastern Japan arcs develop at the depth ranges. Around the source area of the 2018 Hokkaido Eastern Iburi Earthquake, the abrupt changes of Qs values are identified. The 2018 Hokkaido Eastern Iburi Earthquake and its aftershocks seem to be arraigned on the high-Qs zones, whereas the low-Qs anomalies are also imaged next to the high-low-Qs zones. The boundary of the low- and high-low-Qs zones lies with near vertical, corresponding to aftershock distributions of the 2018 Hokkaido Eastern Iburi Earthquake. This agreement would propose that the heterogeneities formed due to the arc–arc collision would characterize faulting processes in the main shock of the Hokkaido Eastern Iburi Earthquake and the activities of its aftershocks.
Keywords: The 2018 Hokkaido Eastern Iburi Earthquake, S-wave attenuation, The arc–arc collision zone, Tomography
© The Author(s) 2019. This article is distributed under the terms of the Creative Commons Attribution 4.0 International License (http://creat iveco mmons .org/licen ses/by/4.0/), which permits unrestricted use, distribution, and reproduction in any medium, provided you give appropriate credit to the original author(s) and the source, provide a link to the Creative Commons license, and indicate if changes were made.
Introduction
The Hokkaido district in Japan belongs to the north-eastern Japan subduction zone. Due to the oblique sub-duction of the Pacific slab, the Kuril arc is dragged to the west and collides to the northeastern Japan arc at the central part (e.g., Kimura 1996). This arc–arc col-lision makes characteristic structures; they are seen as the surface topographies, such as the Hidaka mountain range (HMR), and the surface geology. In this region, some destructive earthquakes have occurred at depths of greater than 30 km, which is abnormally deep; the 1970 Hidaka earthquake (M6.7, 55 km depth), the 1982 Urakawa-oki earthquake (M7.1, 40 km depth) and the
2018 Hokkaido Eastern Iburi earthquake (M6.7, 37 km depth; hereafter we call 2018 Iburi Earthquake).
Heterogeneities with respect to seismic wave velocity (e.g., Kita et al. 2010, 2012) and attenuation (e.g., Taka-hashi 2012; Kita et al. 2014) were investigated in this region. These studies revealed that heterogeneous struc-tures resulted from the arc–arc collision developed at the west side of the HMR and suggested that these structures relate to occur the 1970 Hidaka and the 1982 Urakawa-oki earthquakes (e.g., Kita et al. 2012). The 2018 Iburi Earthquake and its aftershocks occurred at the abnormal depths of the crust. Thereby, the 2018 Iburi Earthquake would be the earthquake linking the arc–arc collision and its forming structures (e.g., Kita et al. 2012). Because attenuation structures can compare between locations of hypocenter and heterogeneity without a trade-off, such as between the hypocenter and the velocity models, it will significantly improve our understanding on why the
Open Access
*Correspondence: [email protected]
earthquakes occur at the abnormal depths in the Hok-kaido district.
In this study, therefore, we estimate the S-wave attenu-ation (Qs) structures of the Hokkaido district in precisely by the method using the spectrum inversion method (e.g., Nakamura and Uetake 2002). As a result, we could reveal very low-Qs at the west of the HMR at depths of 0–50 km and high-Qs zone along the HMR, as well as results for Qp (Kita et al. 2014). Around the 2018 Iburi Earthquake and its aftershocks, we find that boundary between the low-Qs and the high-Qs zones, indicating that attenuation property abruptly changes around the source area of the 2018 Iburi Earthquake.
Method and data
For the present study, we determine the three-dimen-sional (3D) S-wave attenuation (Qs) structure beneath the Hokkaido district of northern Japan using the tomo-graphic inversion method.
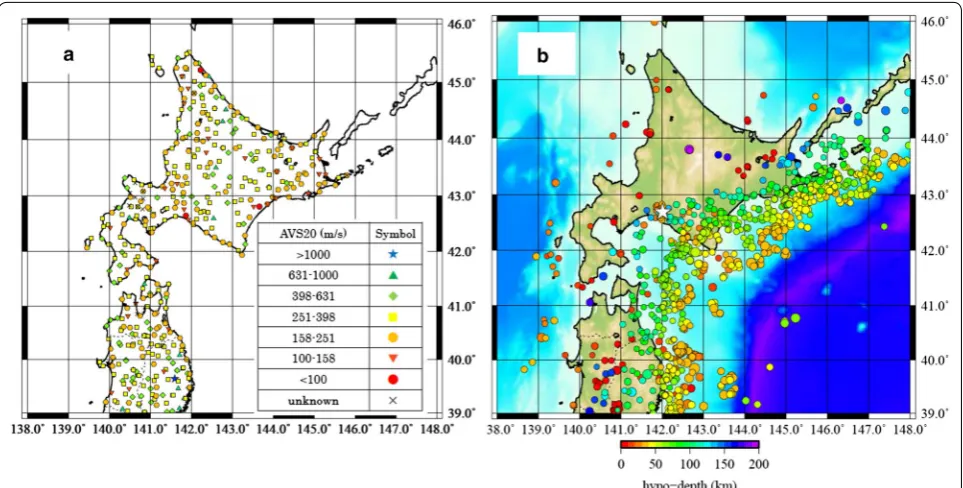
The National Research Institute for Earth Science and Disaster Resilience (NIED) operates nationwide strong-motion observation networks in Japan: K-NET (1045 stations) and KiK-net (698 stations). We collect 89,388 seismograms recorded at 457 stations of the networks from 1329 earthquakes which occur during May 1996– Nov. 2018. The magnitude of the earthquakes is 4.0–7.5. We limit epicentral distances when collecting the seis-mograms: ≤ 100 km and ≤ 500 km for the earthquakes
occurred at depths of 0–30 km and 30–200 km, respec-tively. The stations and the earthquakes used in this study are shown in Fig. 1. Nonlinearity effects on the ground motion would be apparent when it becomes 100 Gal or stronger (e.g., Beresnev and Wen 1996; Noguchi and Sasatani 2011). Thus, we only adopt seismograms that the maximum acceleration is less than 100 Gal. A time length for calculating spectral amplitude changes depending on the magnitude of earthquakes and 180 s from S-wave arrival is the maximum. In our tomo-graphic analysis, we estimate site effects simultaneously with spatial variation in Qs and effects with respect to sources. In our tomographic analysis, we estimate effects with respect to site and source simultaneously with spatial variation in Qs. The site effects express near surface amplifications of amplitude and can be characterized by AVS20 (Fujimoto and Midorikawa 2006; Boore et al. 2011): average S-wave velocity from ground surface to 20-m depth (Fig. 1a). In Nakamura (2009), the number of station groups is six in whole of Japanese island. There are significant and local varia-tions in near surface condivaria-tions reflecting the surface geology around the HMR (Kimura 1996); for exam-ple, the Yufutsu Plain in the eastern Iburi has very soft ground due to thick sediments (e.g. IBUH03 of KiK-net station). In this study, therefore, we increase to eight station groups that are equally divided by the AVS20 on the logarithmic scale (Fig. 1a).
We use 3D tomographic inversion method provided by Nakamura (2009) which bases Nakamura et al. (2006). We briefly introduce the method here.
Supposed that acceleration spectral amplitude at i-th
station and j-th earthquake, αij , is written (Nakamura 2009) as
where f is frequency, Saj is the source acceleration spec-trum, Ge is the geometrical spreading factor, gl indicates site amplification effects at l-th station group. ρSB and βSB are the density and velocity at the seismic basement (SB), respectively, and are replaced by those at the sur-face, 0-km depth, of the JMA2001 one-dimensional (1D) model (Ueno et al. 2002) in this study. The density and velocity at the depth of j-th earthquake are denoted as ρj and βj , respectively. Qk denotes quality factor of S-wave attenuation at k-th block and Tk is time spent of a ray in the block. The summation on the exponential term is made along the ray of S-wave. αij is calculated from NE component seismogram at 1–10 Hz with every 1 Hz.
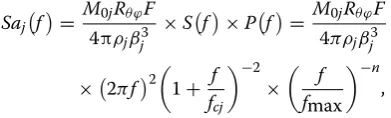
We perform iterative inversion using the ARTB algo-rithm (Herman, 1980) to determine Qs structure by minimizing residuals between observed and calculated spectrum of ground accelerations. We describe the source acceleration spectrum following the notation of Boore (1983):
where M0 is the seismic moment, Rθ ϕ is the radiation pattern, and F is the reduction factor taking account
for the energy partitioning into two horizontal com-ponents. S represents the source spectral model and
fc=4.9×10⁶β
j×3 �σ/M0j is the corner frequency where �σ denotes the stress drop.
We initially assume the similar conditions of Naka-mura (2009) to the variables: Rθ ϕ =0.65 , F =0.71 , �σ =100[bar] , fmax=12[Hz] , and n=3.5 . Seismic
moments of earthquakes are those determined by the F-net of the NIED. The site amplification effects are started from gl =2 for a station group (blue stars in 100f0.78 is adapted to the initial model of the inversion. We impose dumping factors representing variances of an observation/estimation error in the data, the source spectrum, the site amplification effects, and the attenu-ation models: σα =0.20 , σSa=1.0 , σg =0.34 , and σQ=10f0.78 . The values of dumping factors are after Nakamura (2009). The relaxation parameter of ARTB is =0.1 . The relaxation parameter value is after Kamiya et al. (1989) and was used by Nakamura and Uetake (2002), Nakamura et al. (2006), Nakamura (2009). In the study area of 138° E–142° E and 34° N–38° N, the blocks take the size of 0.1° × 0.1° × 10 km. The JMA 2001 1D model (Ueno et al. 2002) is employed as the 1D S-wave velocity structure for calculating ray paths and travel times. The number of blocks where rays hit is 26,278. The total number of model parameters, that is, Qs in each
block, the source strength and site amplification effect, is 28,614. Resultant images of QS structure are obtained after the global 300th iteration of ARTB in this study.
For check validity of our QS model, the checkerboard
resolution test is carried out. QS of 100 and 400 are alter-nately assigned to blocks in horizontal and depth direc-tions. The geometries of stations and earthquakes are the same in the inversion. Source spectrum and site amplifi-cation effects are fixed in this trial. QS=160 is given in
the calculation space as the starting model. We defined a restoration index, RI , to evaluate reproducibility in the
trial:
where QinpCB is assigned value (100 or 400) and QestCB esti-mated value. Namely, this index RI gives small value when the assuming anomalies are well reconstructed.
Results
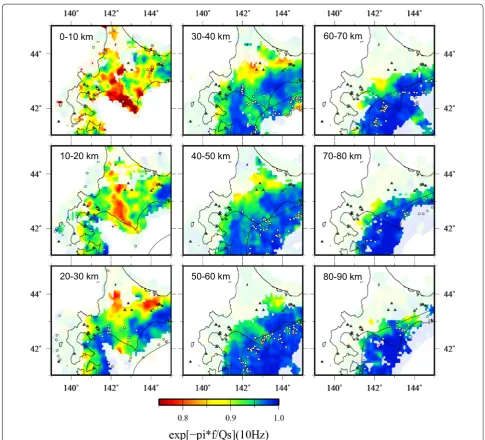
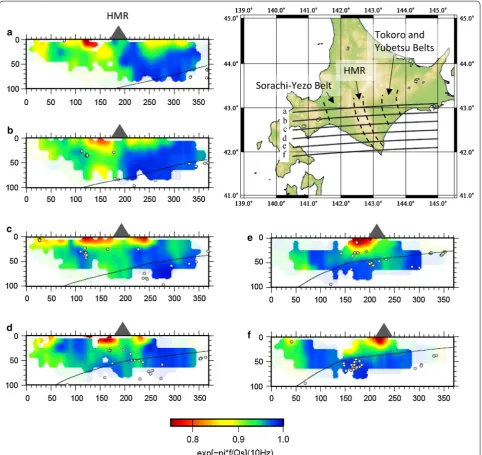
The estimated Qs structures at 10 Hz are demon-strated in Fig. 2. In the figure, we only display the struc-tures where the input anomalies are well recovered ( RI<0.001 ) in the resolution test (Additional file 1: Fig-ure S1). Thus, spatial variations of Qs are mainly revealed from the forearc region to around the volcanic front in and around Hokkaido. The results in the other frequency bands (1–9 Hz) are displayed in Additional file 2: Figure S2, which provides similar Qs distributions while char-acteristics of spatial variations of Qs are emphasized in high-frequency bands.
Figure 2 clearly shows that the estimated Qs struc-tures at depths of 0–30 km have strong lateral variations. For example, the remarkable low-Qs (high-attenuation)
and high-Qs (low-attenuation) zones spreading north to south are found at the central Hokkaido. This north– south distribution of Qs is continuously estimated at depth by about 50 km beneath the forearc region. Low-Qs areas also appear at depths of 20–50 km beneath the volcanoes. Although validities of estimated Qs would be declined, these low-Qs areas beneath the volcanoes seem to extend towards the backarc region with depths. It would represent the upwelling flow in the mantle wedge which has been retrieved as low-velocity (e.g., Naka-jima et al. 2001; Kita et al. 2014; Shiina et al. 2018) and high-attenuation (Nakamura and Uetake 2004; Takahashi 2012; Nakajima et al. 2013; Liu et al. 2014) anomalies in
P and S waves in the Hokkaido and the Tohoku district, Japan. At the forearc side from the volcanoes, the high-Qs zones are widely estimated at the depths of 30–40 km or deeper. This suggests that S-wave attenuation in the Pacific slab and mantle wedge beneath the forearc region tend to be weak.
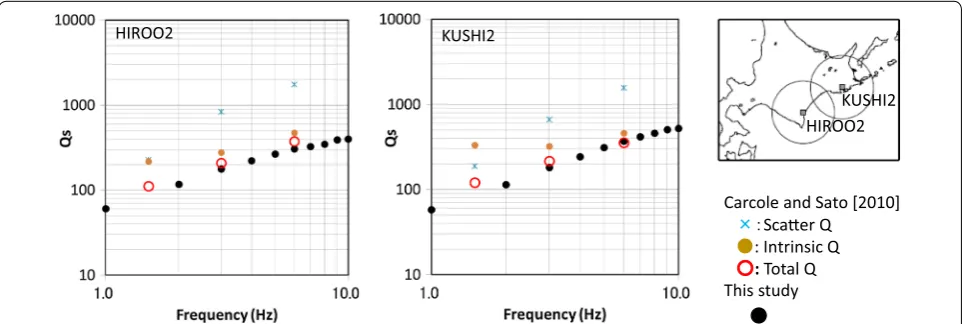
It is known that attenuation effects can be modeled by the scattering attenuation and the intrinsic absorp-tion (e.g., Hoshiba 1993; Takahashi et al. 2009; Sato et al. 2012). Carcolé and Sato (2010) mentioned characteristics in the two types of Qs using the multiple lapse time win-dow analysis. For comparing results at the HIROO2 and the KUSHI2 in Carcolé and Sato (2010) at a range from 0-10 km
10-20 km
20-30 km
30-40 km
40-50 km
50-60 km
60-70 km
70-80 km
80-90 km
1 Hz to 10 Hz, we average Qs values from blocks that are posited within an epicentral distance of 100 km from the target stations (the inset map of Fig. 3) and depths of 0–40 km. The averaged Qs in the frequency bands of interests are almost comparable to the sum of the scatter-ing and the intrinsic effects constrained by Carcolé and Sato (2010). Therefore, we reveal the total effects on Qs and its spatial variations in this study.
The earthquakes used in this study tend to locate on the high-Qs areas (Fig. 2). Because magnitudes of the earthquakes are 4.0 or larger, this indicates that the earth-quakes with moderate to large magnitude occur within the media of which the total attenuation is small. Around earthquakes at depths by about 50 km corresponding to the arc crust and the uppermost mantle; moreover, high-Qs and the low-high-Qs boundaries are frequency imaged.
Discussion
At the central Hokkaido, the obtained low- and high-Qs zones mark belt-like distributions in the north–south direction (Fig. 2). There are remarkable at depths of 0–20 km. Moreover, in the west side of the Hidaka moun-tain ranges (HMR), these distributions of Qs are found at depths by about 50 km (Figs. 2 and 4), that is, the low-Qs zones seem to extend to near the upper boundary of the Pacific slab. In the areas marking the low-Qs values, reductions of seismic wave velocity (e.g., Kita et al. 2012; Shiina et al. 2018) and P-wave attenuation (Kita et al. 2014) were retrieved.
These north–south spreading heterogeneities seem to consistent with the geological boundary at the ground surface, in particular at the depths of 0–10 km. By com-paring between Fig. 2 and the inset map of Fig. 4, the high-Qs zone is estimated along the HMR and the low-Qs belt imaged next to the west of the HRM well matches
to the Sorachi-Yezo belt. In the east side of the HMR, lat-eral variations in Qs seeming to match to the geological boundary within the Tokoro and the Yubetsu belts. These correlations between heterogeneous structure and the surface geology have been discussed (e.g., Iwasaki et al. 2004; Kita et al. 2010). Thereby, our results support these interpretations from the spatial variation of Qs; complex structures are developed around the central Hokkaido and it would relate to the collisions between the Kuril and northeastern Japan arcs.
The Qs values at depths of 0–20 km mark remark-ably low along the coastline of the west side of the HMR (Fig. 2). Across this arc–arc collision zone, Iwasaki et al. (2004) investigated the shallow crustal structure of the P-wave velocity (Vp) in detail. According to their con-structed Vp model, the low-Vp, < 4.5 km/s, layers are lying near the ground surface in the west side of the HMR. These layers were interpreted as the thick sedi-mentary layers, and associating features are identified in other geophysical measurements, such as S-wave veloc-ity (e.g., Nishida et al. 2008), P-wave attenuation (Kita et al. 2014), and electric resistivity (Yamaya et al. 2017). Kinoshita and Ohike (2002) reported that the sediments would affect to reductions of Qs from the studies around the Kanto district, Japan. Thereby, the remarkable low-Qs values would be derived from presences of the thick sedi-mentary layers. At the results of 10 Hz, low-Qs values concentrating to near the ground surface are additionally detected in the east side of the HMR (Fig. 4b–d). Iwasaki et al. (2004) showed the presences of low-Vp layers in the east side too. Thus, the low-Qs zone in the east side of the HMR may also represent the sedimentary layer; how-ever, it would be thinner than in the west side because decreases of Qs are not clear in the low-frequency bands (Additional file 1: Figure S1).
KUSHI2 HIROO2
Carcole and Sato [2010]
㽢䠖Scaer Q
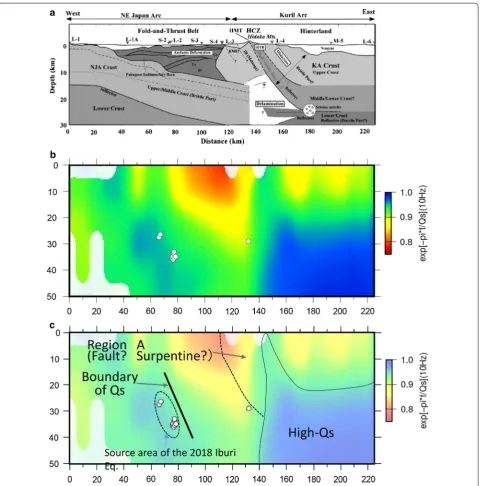
Figure 5b shows the Qs structure elongated around the arc–arc collision zone from Fig. 4b and compares to the crustal structure interpreted by Iwasaki et al. (2004), displayed in Fig. 5a. As discussed above, the low-Qs val-ues are imaged near the ground surface and there are almost consistent with sedimentary layers. However, it is seen that the low-Qs values in the west side of the HMR appear outside from the sedimentary layers (distances of about 110–140 km in Fig. 5b). On the other hand, relatively high-Qs values (distances of 140–160 km; the
Region A in Fig. 5c) estimated as sandwiched the low-Qs zones near the ground surface continuously distribute to the deep potions in the east side of the HMR. These Qs structures would represent the obduction of the mid/ lower crust of (e.g., Tsumura et al. 1996; Iwasaki et al. 2004) and/or the mantle wedge materials beneath the Kuril arc (e.g., Kita et al. 2010). Although effect of the thick sediment layers may affect Qs in the area, the Qs reductions concentrated near surface are extended in the areas where the sedimentary layers would not be present
in the southern part of the cross-sections. This expects that the low-Qs in the Region A indicate that S waves would be attenuated in the frontal areas of the collision zone. The low-Qs zone depth-extending in parallel to the high-Vp values (the Region A) is possibly consistent with the development of high-attenuation properties at the frontal areas of the collision zones. Along the HMR, metamorphic materials, such as the serpentine, are often exposed (e.g., Okamoto et al. 2015). Large amplitude
decays which would be due to the serpentine were dis-cussed from seismic observations (e.g., Nakamura et al. 2006; Nakajima et al. 2013). Whereas many faults will be formed in the collision zone and they emphasize S-wave attenuation. Therefore, we expect that the low-Qs values estimated at the distance of 110–140 km in Fig. 5b reflect either or both heterogeneities present in the frontal areas of the collision zone.
The main shock of the Ibrui Earthquake and its after-shocks locate in the western edge of the remarkable low-Qs zone beneath the area including the Sorachi-Yeno belt (Fig. 2). In other words, Qs values are abruptly changed in laterals around the source area of the Iburi Earthquake. The boundary between the high-Qs and the low-Qs zones is intersected near vertical, as well as the distribution of the earthquakes (Fig. 4b, c). We also find the tendency for the stress drop to increase with depth from the obtained source parameter of the aftershocks of the Iburi Earthquake. This trend is consistent with the results of Nakano and Kawase (2019).
In this study, estimated Qs values express the total effect of seismic attenuation, that is, the sum of scatter-ing and intrinsic effects. From the refraction/wide-angle reflection surveys (e.g., Iwasaki et al. 2004), the stratified-like structures were proposed in the source region, as seen in Fig. 5a. It is expected that compositions within a layer will be almost homogeneous, implying intrinsic effect difficult to vary in each layer. For the horizontal layers, thus, the laterally varied Qs values would repre-sent spatial changes of the scattering attenuation. In this case, the low-Qs zones will suggest localizations of small faults or cracks and the Iburi Earthquake and its after-shocks seem to occur in areas adjacent to the fractured zones. Alternatively, the lateral changes of Qs can also be simply implicated that near vertical structural bound-ary lies in the source area. Namely, it is speculated that the northeastern Japan arc may penetrate to the mantle wedge with a high angle and the boundary between the attenuation properties will reflect the material boundary, such as the Moho discontinuity. Because the earthquake sequences of the Iburi Earthquake also distribute in ver-tically, these earthquakes may be used these structural boundaries if there are formed in this area, likewise to the discussions in Kita et al. (2012) for the 1970 Hidaka and 1982 Urakawa-oki earthquakes.
The Qs structures estimated in this study provide that the Iburi Earthquake and its aftershocks activate in an area where Qs values are laterally changed. The earth-quakes relating to the Iburi earthquake locate on the high-Qs zones. These correlations between the hypo-center locations and the heterogeneity in Qs can be seen in the entire study region. The Qs structure is con-structed for 1D velocity model and compared to the hypocenters determined for the 1D model in this study. On the other hand, some studies (e.g., Nishida et al. 2008; Kita et al. 2012) pointed out the large lateral vari-ations in seismic wave velocity around the source area of the Iburi Earthquake. The Qs values estimated in this study may be perturbed if the S-wave velocity are var-ied in 3D. Therefore, investigations of Qs model, as well as determination of the hypocenters, around the source
area of Iburi Earthquake taking 3D structure of seismic wave velocity into account will provide further detailed features with respect to the Qs structure, and thus will improve insight into the links between the structural het-erogeneity and the generation mechanism of the Iburi Earthquake, including ongoing processes in the arc–arc collision zones at the central Hokkaido, Japan.
Conclusions
In this study, we constructed Qs structures in and around Hokkaido, Japan. At the central Hokkaido, lateral vari-ations of Qs were determined. The belt-like anomalies of Qs spreading north to south almost matched to the surface geology, and those Qs patterns were retained at depths by about 50 km. Therefore, we considered that these characteristic distributions of Qs reflected the complex structures resulted from the collision between the Kuril and the northeastern Japan arcs at the central Hokkaido.
Around the source area of the 2018 Hokkaido East-ern Iburi Earthquake, Qs values were abruptly changed, and it showed the near vertical boundary of the Qs val-ues. The main shock and its aftershocks are located on the high-Qs zones and seem to be arraigned along the boundary of the Qs. These consistencies of distributions of between the Qs and the earthquake locations propose the presence of strong heterogeneity in the source areas of the 2018 Hokkaido eastern Iburi Earthquake and the heterogeneity closely linked to the generation of the main shocks and following aftershocks.
Supplementary information
Supplementary information accompanies this paper at https ://doi. org/10.1186/s4062 3-019-1095-6.
Additional file 1: Figure S1. The results of the checkerboard resolution test at depths of 0–90 km. Gray lines denote the contour of the restoration index RI of 0.001.
Additional file 2: Figure S2. S-wave attenuation (Qs) structures at depths of 0–90 km in and around Hokkaido, Japan, at frequencies of 1–9 Hz. The symbols and lines are the same in Figure 2.
Abbreviations
HMR: the Hidaka mountain range; NIED: The National Research Institute for Earth Science and Disaster Resilience; AVS20: Average S-wave velocity from ground surface to 20-m depth; 3D: three-dimensional.
Acknowledgements
and Smith (1998). Polite comments from two anonymous reviewers helped to greatly improve this manuscript.
Authors’ contributions
RN performed the tomographic inversion. RN and TS discussed the obtained structure and drafted the manuscript. Both authors read and approved the final manuscript.
Funding
The Tokyo Metropolitan Resilience ProjectThe JSPS KAKENHI (Grant Number 18K13626)The JST CREST (Grant Number JPMJCR1763).
Availability of data
The K-NET and KiK-net data used in this study are available from the download pages of the National Research Institute for Earth Science and Disaster Resil-ience, subject to their policies.
Competing interests
The authors declare that they have not competing interests.
Received: 8 May 2019 Accepted: 23 October 2019
References
Beresnev IA, Wen KL (1996) Nonlinear soil response—a reality? Bull Seism Soc Am 86:1964–1978
Boore DM (1983) Stochastic simulation of high-frequency ground motions based on seismological models of the radiated spectra. Bull Seism Soc Am 73:1863–1894
Boore DM, Thompson EM, Cadet H (2011) Regional correlations of VS30 and velocities averaged over depths less than and greater than 30 meters. Bull Seism Soc Am 101:3046–3059. https ://doi.org/10.1785/01201 10071 Carcolé E, Sato H (2010) Spatial distribution of scattering loss and intrinsic
absorption of short-prediod S waves in the lithosphere of Japan on the basis of the multiple lapse time window analysis of Hi-net data. Geophys J Int 190:268–290. https ://doi.org/10.1111/g.1365-246X.2009.04394 .x Fujimoto K, Midorikawa S (2006) Relationship between average shear-wave
velocity and site amplification inferred from strong motion records at nearby station pairs. J Jpn Assoc Earthq Eng 6:11–22. https ://doi. org/10.5610/jaee.6.11(in Japanese with English abstract)
Herman GT (1980) Image reconstruction from projections: The fundamentals of computerized tomography. Academic Press, New York
Hoshiba M (1993) Separation of scattering attenuation and intrinsic absorp-tion in Japan using the multiple lapse time window analysis of full seismogram envelope. J Geophys Res 98:15809–15824. https ://doi. org/10.1029/93jb0 0347
Iwasaki T, Adachi K, Moriya T, Miyamachi H, Matsushima T, Miyashita K, Takeda T, Taira T, Yamada T, Ohtake K (2004) Upper and middle crustal deforma-tion of an arc–arc collision across Hokkaido, Japan, inferred from seismic refraction/wide-angle reflection experiments. Tectonophys 388:59–73. https ://doi.org/10.1016/j.tecto .2004.03.025
Kamiya S, Miyatake T, Hirahara K (1989) Three-dimensional P-wave velocity structure beneath the Japanese islands. Bull Earthq Res Inst 64:457–485 Kimura G (1996) Collision orogeny at arc–arc junctions in the Japanese islands
Isl. Arc 5:262–275. https ://doi.org/10.1111/j.1440-1738.1996.tb000 31.x Kinoshita S, Ohike M (2002) Attenuation characteristics of S-waves in a
cedimentary layer-basement system in the Kanto Region, Japan, for a frequency range of 0.5 to 16 Hz. Zisin 55:19–31 (in Japanese with English abstract)
Kita S, Okada T, Hasegawa A, Nakajima J, Matsuzawa T (2010) Anomalous deepening a seismic belt in the upper-plane of the double seismic zone in the Pacific slab beneath the Hokkaido corner: possible evidence for thermal shielding caused by subducted forearc crust materials. Earth Planet Sci Lett 290:415–426. https ://doi.org/10.1016/j.epsl.2009.12.038 Kita S, Hasegawa A, Nakajima J, Okada T, Matsuzawa T, Katsumata K (2012)
High-resolution seismic velocity structure beneath the Hokkaido corner, northern Japan: Arc–arc collision and origins of the 1970 M 6.7 Hidaka and 1982 M 7.1 Urakawa-oki earthquakes. J Geophys Res Solid Earth 117:B12301. https ://doi.org/10.1029/2012j b0093 56
Kita S, Nakajima J, Hasegawa A, Okada T, Katsumata K, Asano Y, Kimura T (2014) Detailed seismic attenuation structure beneath Hokkaido, northeastern Japan: arc–arc collision process, arc magmatism, and seismotectonics. J Geophys Res Solid Earth 119:6486–6511. https ://doi.org/10.1002/2014J B0110 99
Liu X, Zhao D, Li S (2014) Seismic attenuation tomography of the North-east Japan arc: insight into the 2011 Tohoku earthquake (Mw 9.0) and subduction dynamics. J Geophys Res 119:1094–1118. https ://doi. org/10.1002/2013J B0105 91
Nakajima J, Matsuzawa T, Hasegawa A, Zhao D (2001) Three-dimensional structure of Vp, Vs, and Vp/Vs beneath northeastern Japan: implications for arc magmatism and fluids. J Geophys Res 106:21843–21857. https :// doi.org/10.1029/2000J B0000 08
Nakajima J, Tsuji Y, Hasegawa A, Kita S, Okada T, Matsuzawa T (2009) Tomo-graphic imaging of hydrated crust and mantle in the subducting Pacific slab beneath Hokkaido, Japan: evidence for dehydration embrittlement as a cause of intraslab earthquakes. Gondwana Res 16:470–481. https :// doi.org/10.1016/j.gr.2008.12.010
Nakajima J, Hada S, Hayami E, Uchida N, Hasegawa A, Yoshioka S, Matsuzawa T, Umino N (2013) Seismic attenuation beneath northeastern Japan: constraints on mantle dynamics and arc magmatism. J Geophys Res 118:5838–5855. https ://doi.org/10.1002/2013J B0103 88
Nakamura R (2009) 3-D attenuation structure beneath the Japanese islands, source parameters and site amplification by simultaneous inversion using short period strong motion records and predicting strong ground motion. Doctoral Dissertation, The University of Tokyo, 1–210. http://hdl. handl e.net/2261/25772 . (in Japanese with English abstract) Nakamura R, Uetake T (2002) Three dimensional attenuation structure and
site amplification inversion by using a large quantity of seismic strong motion records in Japan. Zisin 54:475–488. https ://doi.org/10.4294/zisin 1948.54.4_475(in Japanese with English abstract)
Nakamura R, Uetake T (2004) Three dimensional attenuation structure beneath the Tohoku district by using seismic strong motion records. Zisin 56:447–455. https ://doi.org/10.4294/zisin 1948.56.4_447 (in Japanese with English abstract)
Nakamura R, Satake K, Toda S, Uetake T, Kamiya S (2006) 3-D attenuation structure beneath the Kanto District. JAPAN. Geophys Res Lett 33:L21604. https ://doi.org/10.1029/2006G L0273 52
Nakano K, Kawase H (2019) Source parameters and site amplifications estimated by generalized inversion technique: focusing on the 2018 Hokkaido Iburi-Tobu earthquake. Earth Planets Space 71:1–11. https ://doi. org/10.1186/s4062 3-019-1047-1
Nishida K, Kawakatsu H, Obara K (2008) Three-dimensional crustal S wave velocity structure in Japan using microseismic data recorded by Hi-net tiltmeters. J Geophys Res 113:B10302. https ://doi.org/10.1029/2007J B0053 95
Noguchi S, Sasatani T (2011) Nonlinear soil response and its effects on strong ground motions during the 2003 Miyagi-Oki intraslab earthquake. Zisin 63:165–187. https ://doi.org/10.4294/zisin .63.165(in Japanese with English abstract)
Okamoto SAT, Takashita H, Iwano T, Danhara T, Hirata H, Nishido S Sakata (2015) Fission track and U-Pb zircon ages of psammitic rocks from the Harushinai unit, Kamuikotan metamorphic rocks, central Hokkaido Japan: constraints on metamorphic histories. Isl Arc 24:379–403
Sato H, Fehler MC, Maeda T (2012) Seismic Wave Propagation and Scattering in the Heterogeneous Earth, 2nd edn. Springer, New York
Shiina T, Takahashi H, Okada T, Matsuzawa T (2018) Implications of seismic velocity structure at the junction of Kuril-Northeastern Japan arcs on active shallow seismicity and deep low-frequency earthquakes. J Geophys Res Solid Earth 123:8732–8747. https ://doi.org/10.1029/2018J B0154 67
Takahashi T (2012) Three-dimensional attenuation structure of intrinsic absorption and wide-angle scattering of S-waves in northeastern Japan. Geophys J Int 189:1667–1680. https ://doi.org/10.1111/j.1365-246X.2012.05438 .x
Takahashi T, Sato H, Nishimura T, Obara K (2009) Tomographic inversion of the peak delay times to reveal random velocity fluctuations in the litho-sphere: method and application to northeastern Japan. Geophys J Int 178:1437–1455. https ://doi.org/10.1111/j.1365-246X.2009.04227 .x Tsumura N, Hasegawa A, Horiuchi S (1996) Simultaneous estimation
spectra—application to the northeastern part of Honshu, Japan. Phys Earth Planet Inter 93:105–121. https ://doi.org/10.1016/0031-9201(95)03091 -3
Ueno H, Hatakeyama S, Aketagawa T, Funasaki J, Hamada N (2002) Improve-ment of hypocenter determination procedures in the Japan Meteorologi-cal Agency. Q J Seismol 65:123–134 (in Japanese with English abstract) Wessel P, Smith WHS (1998) New, improved version of generic mapping
tools released. EOS Trans Am Geophys Union 79:579. https ://doi. org/10.1029/98EO0 0426
Yamaya Y, Mogi T, Honda R, Hase H, Hashimoto T, Uyeshima M (2017) Three-dimensional resistivity structure in Ishikari lowland, Hokkaido, northeast-ern Japan—implications to strain concentration mechanism. Geochem Geophys Geosyst 18:735–754. https ://doi.org/10.1002/2016G C0066 771
Publisher’s Note