THE DYNAMIC RELATIONSHIPS BETWEEN THE BALTIC DRY
INDEX AND THE BRICS STOCK MARKETS: A WAVELET ANALYSIS
Pao-Lan Kuo1+ Chien-Liang Chiu2 Chan-Sheng Chen3 Mei-Chih Wang4
1,2Department of Banking and Finance, Tamkang University, New Taipei
City, Taiwan (R.O.C.).
3Department of Banking and Finance, Tamkang University, Former
President, Central Deposit Insurance Corp., Taiwan (R.O.C.).
4Providence University Finance, Shalu Dist., Taichung City, Taiwan
(R.O.C.).
(+ Corresponding author)
ABSTRACT
Article History
Received: 2 December 2019 Revised: 20 January 2020 Accepted: 24 February 2020 Published: 25 March 2020
Keywords
Granger causality wavelet Nonlinearity Baltic dry index BRICS
Emerging markets.
JEL Classification:
C39; F62; G15.
This paper studies the dynamic relationships between the Baltic Dry Index (BDI) and the BRICS stock markets by wavelet analysis for the period from January 1996 to March 2019. Compared to the causality based on linearity and the choosing of the period of lags, as well as given the significant evidence of nonlinearity, we used wavelet analysis to analyze the dynamic relationships between the two series in both time and frequency domains, which helped us to demonstrate the causality across different horizons. Due to wavelet analysis, we found that the BDI and the Brazilian stock market had a significantly positive relationship from 2002 to 2011 in the medium term and that the Brazilian stock market led the BDI from 2002 to 2004 and from 2009 to 2011. The wavelet analysis showed that the Russian and Indian stock markets dominated the BDI from 2005 to 2016 in the long term and from 2002 to 2011 in the medium term, respectively. The South African stock market and the BDI had a medium term, positive, and co-movement relationships. The empirical results of Brazil and South African indicated that commodity import- and export- related countries have similar interactions. Lastly, wavelet analysis revealed that the BDI lead the Chinese stock market from 1996 to 1998 in the medium term, while the Chinese stock market turned to dominate the BDI from 2001 to 2011, both in the medium and long term.
Contribution/ Originality:
This study used new estimation methodology of a wavelet-based approach to analyze the dynamic relationship between BDI and BRICS stock markets in time and frequency domains, and successfully distinguished the lead-lag relationship between the BDI and the five stock markets, that the conventional methodology could not distinguish.1. INTRODUCTION
The Baltic Dry Index (hereafter, BDI) is an indicator of transportation costs for various dry bulk cargoes shipped by sea and has been listed on the Baltic Exchange in London since May 1985. Some previous research has focused on the BDI, freight rates and the shipping industry (described below). Stopford (2005); Stopford. (2009)
detailed the Trade Development Cycle and Business Cycle as the two main factors that affect the shipping industry, with the Business Cycle as the most important as this points out the nexus between the BDI and business. Thorsen
Asian Economic and Financial Review
ISSN(e): 2222-6737 ISSN(p): 2305-2147
DOI: 10.18488/journal.aefr.2020.103.340.351 Vol. 10, No. 3, 340-351.
(2010) found an equilibrium relationship between OECD GDP and the freight rates in dry bulk shipping and confirmed that freight rates (and also the BDI) depend on the global economy (this finding is in line with those of
Kavussanos (1996).
Bakshi, Panayotov, and Skoulakis (2011) showed that the BDI growth rate not only demonstrates a positive and significant relationship with emerging market (including the BRICS1, i.e., Brazil, Russia, India, China, and South Africa) stock returns, but that it also predicts commodity index performance and global economic activity.
Erdogan, Tata, Karahasan, and Sengoz (2013) explored the changes in the BDI to help explain the changes in the Dow Jones Industrial Average (DJIA) and determined that the BDI leads the DJIA in the longer term.
Bhar and Hammoudeh (2011) examined the dynamic interrelationships among commodities and commodities-relevant financial variables and pointed out that the interrelationships among them are regime-dependent. Some research has examined the BDI or shipping industry within financial portfolios and shown that they provide the ship-owner with a suboptimal risk-return profile on the market (Cullinane, 1995; Mensi, Hammoudeh, Reboredo, & Nguyen, 2014). To date, research has shown that the importance of the BDI in global economic and global financial markets is obvious.
According to the IMF (International Monetary Fund, 2013) in 2015 the five BRICS countries represented approximately 41% of the world population and as of 2018, these five nations have a combined nominal GDP of 23.2% of the gross world product. Golinelli and Parigi (2014) stated that over the past few years the growth of advanced and emerging (especially the BRICs) economies has been severely divergent, meaning that the tracking of world economic growth can no longer ignore emerging countries. Mensi et al. (2014) and Graham, Peltomäki, and Piljak (2016) suggested that global stock and economic activity has an influence on the BRICS stock markets. In addition, Ahmad, Sehgal, and Bhanumurthy (2013) and Bekiros (2014) found interdependence between global crisis events and BRICS stock markets. This interdependence inspired international investors interested in the co-movements between the BRICS stock markets, global elements, and other financial assets (Apergis & Payne, 2013; Han, Wan, & Xu, 2019; Harvey, 1995).
Based on its economic and world trade status, according to the WTO (World Trade Organization2), China is the biggest exporting country in the world. In Brazil, the GDP has grown 12% through import- and export-related activity. Russia is one of the largest grain exporters in the world, and exporting is the main power behind India’s economic growth. As mentioned above, the BRICS countries not only depend on international trade but are more important than ever to the world economy, while the BDI has a predictive ability concerning global economic activity. These are the reasons we wanted to investigate the relationship between the BDI and the BRICS equity markets.
In this study, the main goal is to demonstrate the dynamic relationships among the respective BRICS stock markets and the BDI. The first and main contribution of this paper is the use of a wavelet coherency and phase difference both in the time and frequency domains because of the nonlinearity of the BDI and the BRICS stock markets. From a time domain view, the BDI and the BRICS stock markets had a significant positive relationship from 2005 to 2011—covering the period of solid economic performance after the global financial crisis in the emerging markets—whereas the connection disappears after 2011 when the relationship suffered from the European debt crisis, and the economies of the emerging markets diverged. Second, during the significant linkage period, wavelet analysis helped us to distinguish not only the lead-lag relationship but also the frequency and the structural change, while the linear Granger causality, which is subject to the choosing of lag periods and the
1 Since Dec. 2010, South Africa has entered into BRICs; thus, BRICs expanded from four countries (Brazil, Russia, India, and China) to five countries (Brazil, Russia,
India, China, and South Africa).
assumption of parameter stability in the full-sample period, cannot determine the lead-lag relationship between the BDI and the stock markets of Brazil and South Africa.
The remainder of this paper is structured as follows: Section 2 describes the wavelet methodology; Section 3 presents the data and the corresponding stock market indices, while Section 4 discusses our findings; and Section 5 concludes the paper.
2. METHODOLOGY
We analyzed the dynamic nexus between the BDI and the BRICS stock markets. Wavelets are localized in both time and frequency domains and allow for the analysis of time-frequency dependencies between two time series; this method is more effective for conducting the estimation of spectral characteristics of a time series as a function of time (Aguiar-Conraria, Azevedo, & Soares, 2008). Wavelet analysis has a significant advantage when the underlying series are non-stationary or locally stationary (Roueff & Von Sachs, 2011). Wavelet analysis allows a simultaneous assessment of co-movement and causality between the two returns in both the time and frequency domains (Li, Chang, Miller, Balcilar, & Gupta, 2015). Following Li et al. (2015) we adopted the wavelet squared coherency as follows:
, where (1)
where is the continuous wavelet transform, and is the smooth operator normalizing time. Zero
coherence indicates no co-movement between the BDI and the BRICS stock markets, while the highest coherency implies the strongest co-movement between them. In the empirical section, the squared wavelet coherency is also clearly marked by color bars on the right side of the wavelet coherency plots, with red color corresponding to a strong co-movement, whereas the blue color corresponds to a weak co-movement (shown in Figure 2 to Figure 6).
Following Bloomfield et al. (2004) we estimated the wavelet phase difference between and to measure
the lead-lag relationship between the two series. The wavelet phase difference was defined as the ratio of the
imaginary component to the actual component as follows:
, with (2)
Where and equal the imaginary and real parts of the smoothed cross-wavelet transform, respectively.
A phase difference of zero indicates that two underlying series move together, while the phase
difference means the series are in phase (positively co-moved) with leading . If
then the series are out of phase (negatively co-moved) with leading . If
, then the series are out of phase with leading . If , then
between and in both the time and frequency domains. Obviously, wavelet analysis, which has a significant
advantage when the underlying series are non-stationary or locally stationary (Roueff & Von Sachs, 2011) may reveal proper statistical power more than the conventional Granger causality test, which requests parameter stability in the full-sample period and a single causal-link holding for the whole sample period, as well as at each frequency (Tiwari, Mutascu, & Andries, 2013).
3. DATA AND THE CORRESPONDING MARKET INDICES
In this paper, we studied the contemporaneous and dominant dynamics between the BDI and the BRICS stock markets. We used BDI, IBVO (Ibovespa Brazil Sao Paulo Stock Exchange Index), RTSI (Russian Trading System Cash Index), SENSEX (India's benchmark index), SCHOMP (Shanghai Stock Exchange Composite Index), TOP40 (Africa Top40 Tradeable Index) to represent the Baltic Dry Index and the Brazilian, Russian, Indian, Chinese, and South African stock market indexes, respectively. Returns were calculated by way of the sequential difference of the natural logarithm of the closing prices of the variables:
The sample periods of the row data were monthly, covering 1996:1~2019:3 (279 months), and were collected from Bloomberg.
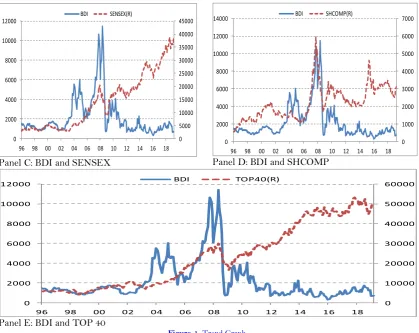
In Figure 1, Panel A to Panel E shows the row data of the pair variables, BDl, and IBVO, RTSI, SENSEX, SCHOMP, TOP40. As shown in Figure 1, the two series were in lockstep from the beginning of the sample period 1996. From 2007 to 2008, during the global financial crisis, the BDI, a leading economic indicator of average global freight rates, crashed from its record high level of 11,793 points (20 May 2008) down to its lowest historic level ever at 290 points (10 February 2016) (Syriopoulos & Bakos, 2019). When the global economy undergoes recession, dry bulk shipping companies go bankrupt; thus, the BRICS stock markets all crashed, and then stock prices explored their own divergent economic conditions.
Descriptive statistics and stochastic properties for the rate returns are reported in Table 1. The difference
between the standard deviation values showd that △ln (BDI) and △ln (RTSI) were more variable than others. Based
on the Jarque-Bera test, the hypothesis of normality of the unconditional distributional for all series were rejected; thus, it was natural to speculate that focusing on causality only in terms of the conditional mean would be improper
(Antonakakis, Chang, Cunado, & Gupta, 2018). Then, using the conventional augmented (Dickey & Fuller, 1979)
the results in Table 1 indicate that all return series were stationary.
0 20000 40000 60000 80000 100000 120000 0 2000 4000 6000 8000 10000 12000
96 98 00 02 04 06 08 10 12 14 16 18 BDI IBOV(R)
Panel A: BDI and IBOV
0 500 1000 1500 2000 2500 3000 0 2000 4000 6000 8000 10000 12000
96 98 00 02 04 06 08 10 12 14 16 18 BDI RTSI(R)
0 5000 10000 15000 20000 25000 30000 35000 40000 45000 0 2000 4000 6000 8000 10000 12000
96 98 00 02 04 06 08 10 12 14 16 18
BDI SENSEX(R)
Panel C: BDI and SENSEX
0 1000 2000 3000 4000 5000 6000 7000 0 2000 4000 6000 8000 10000 12000 14000
96 98 00 02 04 06 08 10 12 14 16 18
BDI SHCOMP(R)
Panel D: BDI and SHCOMP
0 10000 20000 30000 40000 50000 60000 0 2000 4000 6000 8000 10000 12000
96 98 00 02 04 06 08 10 12 14 16 18
BDI TOP40(R)
Panel E: BDI and TOP 40
Figure-1. Trend Graph.
Note: This figure deposits the trends of BDI, IBOV, RTSI, SENSEX, SHCOMP, and TOP40. Monthly data from January 1996 to March 2019, with a total of 279 observations used. All the data are obtained from Bloomberg.
Table-1. Descriptive statistics.
△ln (BDI) △ln (IBOV) △ln (RTSI)
△ln
(SENSEX)
△ln
(SHCOMP) △ln (TOP40)
Mean -0.280659 1.049977 0.970373 0.927881 0.629324 0.772526
Median 1.045200 1.317308 1.309920 1.034893 0.691816 0.956507
Maximum 67.10700 21.54516 44.45920 24.88511 27.8056 13.76323
Minimum -133.0000 -50.34140 -82.44950 -27.29919 -28.27834 -33.97558
Standard
Deviation 21.55480 8.378180 13.41702 6.827382 7.928857 5.593285
Skewness -1.210228 -1.185154 -1.115947 -0.361223 -0.199400 -0.948471
Kurtosis 9.747700 8.166079 9.183822 4.072896 4.722888 7.921885
Jarque-Bera 595.2681 374.2197 500.6433 19.37929 36.22554 322.2870
p-value 0.0000 0.0000 0.0000 0.0000 0.0000 0.0000
ADF(level) 0.0000*** 0.0000*** 0.0000*** 0.0000*** 0.0000*** 0.0000***
Note: p-value corresponds to the test of normality based on the Jarque-Bera test.
4. EMPIRICAL RESULTS
Following the conventional econometric approach, we conducted the linear Granger causality test based on a vector autoregressive model of order p (VAR(p)) to compare it to the wavelet analysis. The determination of the lag
orders was AIC. The results of the linear Granger causality tests are shown in Table 2.
To conclude, we investigated whether the Russian stock market rate of return Granger causes the BDI rate of return, whether the BDI rate of return dominates the Indian stock market rate of return, and whether the Chinese stock market rate of return and the BDI rate of return have bidirectional movement. Also, while the South African stock market and the BDI had no reciprocal causation, this result was the same as the relationship between the Brazilian stock market and the BDI.
Table-2. Linear granger causality test.
Null Hypothesis: Lags p-value
△ln (IBOV)≠>△ln (BDI) 1 0.5701
△ln (BDI) ≠>△ln (IBOV) 0.6462
△ln (RTSI) ≠>△ln (BDI) 4 0.0671**
△ln (BDI) ≠>△ln (RTSI) 0.6580
△ln (SENSEX) ≠>△ln(BDI) 4 0.1245
△ln (BDI) ≠>△ln (SENSEX) 0.0054***
△ln (SHCOMP) ≠>△ln(BDI) 7 0.0292**
△ln (BDI) ≠>△ln (SHCOMP) 0.0817*
△ln (TOP40) ≠>△ ln(BDI) 1 0.1387
△ln (BDI) ≠> △ln (TOP40) 0.6002
Note:
1.△ln (BDI), △ln (IBOV), △ln (RTSI), △ln (SENSEX), △ln (SHCOMP), △ln (TOP40) represent rate of the return of the Baltic Dry Index, and the rate of returns of stock markets of Brazil, Russia, India, China, and South Africa, respectively.
2. ―*‖,‖**‖,‖***‖ represent 10%, 5%, and 1% significance levels, respectively.
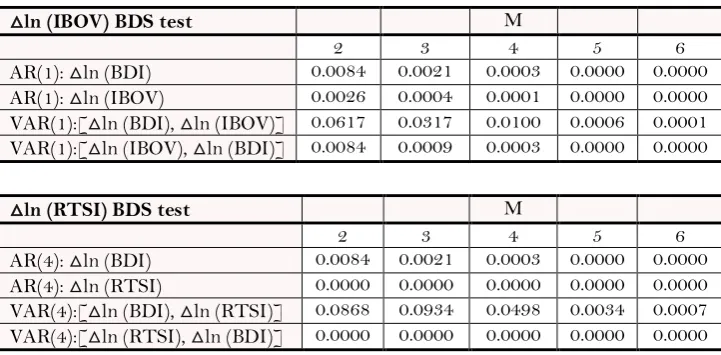
Next, we examined a nonlinearity test by applying the Broock, Scheinkman, Dechert, and LeBaron (1996)
BDS) test. As we see from Table 3, the null of iid residuals was strongly rejected for all cases, except for the residual in the AR(4) and VAR(4) model of the Indian stock market rate of return, the residuals of rate of returns of the Indian stock market and the BDI under dimension of 2(△ln (SENSEX) BDS test), the residual in the AR(7) and VAR(7) model of the Chinese stock market rate of return, and the residuals of rate of returns of the Indian stock market and the BDI under dimension of 2(△ln (SHCOMP) BDS test). By applying the Broock et al. (1996) BDS) test, because of the existence of nonlinearity, we found evidence to disclose misspecification of the VAR model; thus, using the conventional linear Granger causality test to examine the lead-lag interaction between two series may be not reliable. This opinion is the same as that of Antonakakis et al. (2018).
Table-3. Broock et al. (1996) BDS test.
△ln (IBOV) BDS test M
2 3 4 5 6
AR(1): △ln (BDI) 0.0084 0.0021 0.0003 0.0000 0.0000
AR(1): △ln (IBOV) 0.0026 0.0004 0.0001 0.0000 0.0000
VAR(1):[△ln (BDI), △ln (IBOV)] 0.0617 0.0317 0.0100 0.0006 0.0001
VAR(1):[△ln (IBOV), △ln (BDI)] 0.0084 0.0009 0.0003 0.0000 0.0000
△ln (RTSI) BDS test M
2 3 4 5 6
AR(4): △ln (BDI) 0.0084 0.0021 0.0003 0.0000 0.0000
AR(4): △ln (RTSI) 0.0000 0.0000 0.0000 0.0000 0.0000
VAR(4):[△ln (BDI), △ln (RTSI)] 0.0868 0.0934 0.0498 0.0034 0.0007
△ln (SENSEX) BDS test M
2 3 4 5 6
AR(4): △ln (BDI) 0.0084 0.0021 0.0003 0.0000 0.0000
AR(4): △ln (SENSEX) 0.7060 0.0365 0.0063 0.0012 0.0001
VAR(4):[△ln (BDI), △ln (SENSEX)] 0.0056 0.0035 0.0008 0.0000 0.0000
VAR(4):[△ln (SENSEX), △ln (BDI)] 0.8261 0.0684 0.0136 0.0016 0.0001
△ln (SHCOMP) BDS test M
2 3 4 5 6
AR(7): △ln (BDI) 0.0084 0.0021 0.0003 0.0000 0.0000
AR(7): △ln (SHCOMP) 0.1370 0.0059 0.0001 0.0000 0.0000
VAR(7):[△ln (BDI), △ln (SHCOMP) ] 0.1034 0.0296 0.00106 0.0004 0.0000
VAR(7):[△ln (SHCOMP), △ln (BDS)] 0.0250 0.0212 0.00 15 0.3232 0.2833
△ln (TOP40) BDS test M
2 3 4 5 6
AR(1): △ln (BDI) 0.0084 0.0021 0.0003 0.0000 0.0000
AR(1): △ln (TOP40) 0.0019 0.0000 0.0000 0.0000 0.0000
VAR(1):[△ln (BDI), △ln (TOP40) ] 0.0279 0.0102 0.0024 0.0001 0.0000
VAR(1):[△ln (TOP40), △ln (BDI)] 0.0024 0.0000 0.0000 0.0000 0.0000
Note: See note to Table 2; m stands for the number of (embedded) dimension which embed the time series into m-dimensional vectors, by taking each m successive points in the series. Value in cell represents the p-value of the BDS z-statistic with the null of i.i.d. residuals.
Lastly, we conducted time-varying wavelet analysis to deal with the disadvantage of linear Granger causality, i.e., the assumption of parameter stability over the full-sample period and needing to determine the lag orders used in a VAR model. The results from the wavelet analysis are shown in Figure 2 to Figure 6.
In comparison to the conventional causality analysis, wavelet coherency and phase difference provided better measure correlation between variables; and they indicated the structural changes from time and frequency domains. We demonstrated that the BDI and the Brazilian stock market had a significant positive relationship from 2002 to 2011 in the medium term, and that the Brazilian stock market led the BDI from 2002 to 2004 and from 2009 to 2011. From 2002 to 2004, the economy of Brazil was rising from the bottom, while during 2009 to 2011, it was in a period of recovery after the global financial crisis. In addition, a wavelet analysis showed that the Russian and Indian stock markets dominated the BDI in the long term from 2005 to 2016 and in the medium term from 2002 to 2011, covering the down- and up-side periods, respectively. The South African stock market and the BDI had a medium-term positive and a co-movement relationship.
The Brazilian and South African stock markets both had co-movement with the BDI from 2005 to 2009, covering the period of the global financial crisis. This result means that commodity import- and export-related countries have similar interactions. In contrast to the linearity of Granger causality, which is subject to the choosing of lag periods and the assumption of parameter stability in the full-sample period, we could not determine the lead-lag relationship between the BDI and the stock markets of Brazil and South Africa.
Finally, wavelet analysis showed that the BDI led the Chinese stock market from 1996 to 1998 in the medium term, with the Chinese stock market turning to dominate the BDI from 2001—the year of China's entry into the WTO (World Trade Organization)—to 2011—the period of China’s prosperity—both in the medium and long terms. Generally, the BDI and the BRICS stock markets had a significant positive linkage for the period of January 2000 to July 2008, largely related to the high-energy demand from the BRICS countries to support their fast economic growth (Mensi et al., 2014).
domains, thus helping us to demonstrate the causality across different horizons and even the structure change between the two series.
Figure-2. Squared wavelet coherency and phase difference between the Baltic Dry Index (BDI) and the Brazilian stock market (IBOV) from Jan. 1996 to Mar. 2019.
Note: BDI represents the Baltic Dry Index, while IBOV represents the Brazilian stock market. The x-axis refers to time periods. The y-axis is scales (measured in years). The color corresponds to the strength of the correlation.
Figure-3. Squared wavelet coherency and phase difference between the Baltic Dry Index (BDI) and the Russian stock market (RTSI) from Jan. 1996 to Mar. 2019.
Figure-4. Squared wavelet coherency and phase difference between the Baltic Dry Index (BDI) and the Indian stock market (SENSEX) from Jan. 1996 to Mar. 2019.
Note: BDI represents the Baltic Dry Index, while SENSEX represents the Indian stock market. The x-axis refers to time periods. The y-axis is scales (measured in years). The color corresponds to the strength of the correlation.
Figure-5. Squared wavelet coherency and phase difference between the Baltic Dry Index (BDI) and the Chinese stock market (SHCOMP) from Jan. 1996 to Mar. 2019.
Note: BDI represents the Baltic Dry Index, while SHCOMP represents the Chinese stock market. The x-axis refers to time periods. The y-axis is scales (measured in years). The color corresponds to the strength of the correlation.
Figure-6. Squared wavelet coherency and phase difference between the Baltic Dry Index (BDI) and the South African stock market (TOP40) from Jan. 1996 to Mar. 2019.
Note: BDI represents the Baltic Dry Index, while TOP40 represents the South African stock market. The x-axis refers to time periods. The y-axis is scales (measured in years). The color corresponds to the strength of the correlation.
5. CONCLUSIONS
Because of the deep linkage between the BDI, global factors, international stock markets, and even the BRICS stock markets, while taking the nonlinearity specification between the BDI and the BRICS stock markets into consideration, we examined the dynamic relationship between the BRICS stock markets and the BDI using wavelet analysis of monthly data covering the sample period from January 1996 to March 2019. A wavelet-based approach helped us to analyze the relationship between these two variables both in time and frequency domains. The latter means that the lead-lag interacts between variables across different horizons, including the short-, medium- and long- terms.
With the conventional methodology, linear Granger causality cannot distinguish the lead-lag relationship between either the BDI and the Brazilian stock market or the BDI and South African stock market. This result may be because the choosing of lag periods constrains the empirical result, requesting parameter stability in the full sample period and a single causal-link holding for the whole sample period, as well as for each frequency (Tiwari et al., 2013).
According to the BDS nonlinearity test, we investigated the nonlinearity between the variables; thus, the use of the linear model may be improper. This was the main reason we turned to the wavelet analysis. Based on the empirical results of the wavelet analysis mentioned above, we plotted some dimensional pictures for the relationship between the BDI and the BRICS stock markets. First, from a time-domain view, the BDI and the BRICS stock markets had a significant positive relationship from 2005 to 2011, covering the period of solid economic performance after the global financial crisis in emerging markets, which was similar to the Chinese stock market in the earlier sample period, 1996 to 1998. Because of Russia’s abundant natural resources, the relationship between the Russian stock market and the BDI lasted till 2016. The determination of the structural node is one of the wavelet analysis characteristics.
Chinese stock market. The BDI led the Chinese stock market in the beginning of the sample period, 1996 to 1998, while the Chinese stock market dominated the BDI from 2001 to 2011. The interaction between the BDI and the Brazilian stock market demonstrated a similar structural change.
In conclusion, while taking the nonlinear and unstable parameter characteristics into consideration, the use of conventional linear methodology to distinguish the co-movement or the lead-lag interaction between two series may be improper. However, by using wavelet analysis as the empirical methodology to examine the lead-lag relationships between variables, we may draw the correct empirical conclusions.
Funding: This study received no specific financial support.
Competing Interests: The authors declare that they have no competing interests.
Acknowledgement: All authors contributed equally to the conception and design of the study.
REFERENCES
Aguiar-Conraria, L., Azevedo, N., & Soares, M. J. (2008). Using wavelets to decompose the time–frequency effects of monetary
policy. Physica A: Statistical mechanics and its Applications, 387(12), 2863-2878. Available at:
https://doi.org/10.1016/j.physa.2008.01.063.
Ahmad, W., Sehgal, S., & Bhanumurthy, N. (2013). Eurozone crisis and BRIICKS stock markets: Contagion or market
interdependence? Economic Modelling, 33, 209-225. Available at: https://doi.org/10.1016/j.econmod.2013.04.009.
Antonakakis, N., Chang, T., Cunado, J., & Gupta, R. (2018). The relationship between commodity markets and commodity
mutual funds: A wavelet-based analysis. Finance Research Letters, 24, 1-9. Available at:
https://doi.org/10.1016/j.frl.2017.03.005.
Apergis, N., & Payne, J. E. (2013). New evidence on the information and predictive content of the Baltic Dry Index. International
Journal of Financial Studies, 1(3), 62-80. Available at: https://doi.org/10.3390/ijfs1030062.
Bakshi, G., Panayotov, G., & Skoulakis, G. (2011). The baltic dry Index as a predictor of global stock returns, Commodity returns, and
global economic activity. Paper presented at the AFA 2012 Chicago Meetings Paper.
Bekiros, S. D. (2014). Contagion, decoupling and the spillover effects of the US financial crisis: Evidence from the BRIC markets.
International Review of Financial Analysis, 33, 58-69. Available at: https://doi.org/10.1016/j.irfa.2013.07.007.
Bhar, R., & Hammoudeh, S. (2011). Commodities and financial variables: Analyzing relationships in a changing regime
environment. International Review of Economics & Finance, 20(4), 469–484. Available at:
https://doi.org/10.1016/j.iref.2010.07.011.
Bloomfield, D. S., McAteer, R. J., Lites, B. W., Judge, P. G., Mathioudakis, M., & Keenan, F. P. (2004). Wavelet phase coherence
analysis: Application to a quiet-sun magnetic element. The Astrophysical Journal, 617(1), 623-632. Available at:
https://doi.org/10.1086/425300.
Broock, W. A., Scheinkman, J. A., Dechert, W. D., & LeBaron, B. (1996). A test for independence based on the correlation
dimension. Econometric Reviews, 15(3), 197-235. Available at: https://doi.org/10.1080/07474939608800353.
Cullinane, K. (1995). A portfolio analysis of market investments in dry bulk shipping. Transportation Research Part B:
Methodological, 29(3), 181-200. Available at: https://doi.org/10.1016/0191-2615(94)00032-u.
Dickey, D. A., & Fuller, W. A. (1979). Distribution of the estimators for autoregressive time series with a unit root. Journal of the
American Statistical Association, 74(366a), 427-431. Available at: https://doi.org/10.1080/01621459.1979.10482531. Erdogan, O., Tata, K., Karahasan, B. C., & Sengoz, M. H. (2013). Dynamics of the co-movement between stock and maritime
markets. International Review of Economics & Finance, 25, 282-290. Available at:
https://doi.org/10.1016/j.iref.2012.07.007.
Golinelli, R., & Parigi, G. (2014). Tracking world trade and GDP in real time. International Journal of Forecasting, 30(4), 847-862.
Available at: https://doi.org/10.1016/j.ijforecast.2014.01.008.
Graham, M., Peltomäki, J., & Piljak, V. (2016). Global economic activity as an explicator of emerging market equity returns.
Han, L., Wan, L., & Xu, Y. (2019). Can the Baltic Dry Index predict foreign exchange rates? Finance Research Letters, 101157.
Harvey, C. R. (1995). Predictable risk and returns in emerging markets. The Review of Financial Studies, 8(3), 773-816. Available
at: https://doi.org/10.1093/rfs/8.3.773.
International Monetary Fund. (2013). World economic outlook. Washington, DC: International Monetary Fund.
Kavussanos, M. G. (1996). Price risk modelling of different size vessels in the tanker industry using autoregressive conditional
heterskedastic (ARCH) models. Logistics and Transportation Review, 32(2), 161-176.
Li, X.-L., Chang, T., Miller, S. M., Balcilar, M., & Gupta, R. (2015). The co-movement and causality between the US housing and
stock markets in the time and frequency domains. International Review of Economics & Finance, 38, 220-233. Available
at: https://doi.org/10.1016/j.iref.2015.02.028.
Mensi, W., Hammoudeh, S., Reboredo, J. C., & Nguyen, D. K. (2014). Do global factors impact BRICS stock markets? A quantile
regression approach. Emerging Markets Review, 19, 1-17. Available at: https://doi.org/10.1016/j.ememar.2014.04.002.
Roueff, F., & Von Sachs, R. (2011). Locally stationary long memory estimation. Stochastic Processes and their Applications, 121(4),
813-844. Available at: https://doi.org/10.1016/j.spa.2010.12.004.
Stopford, M. (2005). China in transition: Its impact on shipping in the last decade and the next. Marintec: Shanghai.
Stopford., M. (2009). Maritime economics (3rd ed. Vol. Routledge): London.
Syriopoulos, T., & Bakos, G. (2019). Investor herding behaviour in globally listed shipping stocks. Maritime Policy and
Management, 46, 545–564.
Thorsen, I. S. (2010). Dry bulk shipping and business cycles. Master's Thesis.
Tiwari, A. K., Mutascu, M., & Andries, A. M. (2013). Decomposing time-frequency relationship between producer price and
consumer price indices in Romania through wavelet analysis. Economic Modelling, 31, 151-159. Available at:
https://doi.org/10.1016/j.econmod.2012.11.057.