Design of effective algorithm for Removal of
Ocular Artifact from Multichannel EEG Signal
Using ICA and Wavelet Method
Snehal Ashok Gaikwad P.G.Student,
Department of Electronics, PVPIT Budhgaon, Sangli, Maharashtra, India.
K.P.Paradeshi Associate Professor,
Department of Electronics, PVPIT Budhgaon, Sangli, Maharashtra, India
Abstract— In this paper we have proposed a new method for removing artifacts from multichannel EEG data in which a combination of Independent Component Analysis and wavelet-based noise reduction is carried for detection and removal of Ocular Artifact. In the first stage, independent components of OA are computed using SOBI algorithm. In second stage a DWT function by symlet wavelet is designed for noise cancellation of decomposed noisy signal. Applying soft and hard thresholding, we arrive at a sufficiently artifact-free EEG signal. This approach works both for eye blinks and eye movements.
Index Terms— EEG, EOG, SOBI-ICA, WICA, Symlet Wavelet
I. INTRODUCTION
The Electroencephalogram (EEG) is a frequently used technique in clinics for measuring electrical activity within the brain. In EEG recordings, the sensors are placed on the scalp according to predefined rules or standardized by the international 10- 20 system (10-20 system in our case).The acquired signal is the result of a combination of intra and extra-cerebral electrophysiological sources this includes noise such as the electrical responses to eye blinks and head movement, and external electrical noise like the power line noise at either 50 or 60 Hz, cable movement, sweating, electrode movement etc. An EEG waveform has many variations in terms of shape, frequency, and amplitude.As the human eye moves or blinks, it generates an electric field that can be orders of magnitude larger than the desired brain wave activity. The recorded electrical activity associated with the movement of the eyes is known as the electrooculogram (EOG). The noise generated because of Eye blink and eye-ball movement is called Ocular artifact.EOG cannot be simply filtered out is because of the spectral overlap between the EOG and the EEG.OA makes the analysis of neuronal data very difficult.
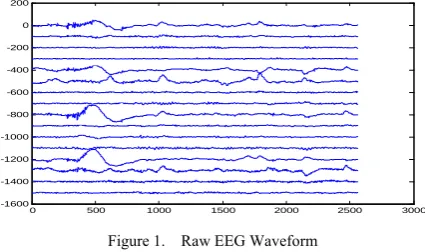
EEG signals are mixing of independent neuronal sources, artifacts and noise.EEG signal is a non-stationary signal. “Fig.1,” shows the 16 channel EEG signal which is affected by Ocular artifact. The frequency of EEG is divided into four sub-bands and is delta – under 4 Hz, theta – 4 to 8 Hz, alpha – 8 to 13 Hz, and beta – above 13 Hz. Generally amplitudes below 20 μV are considered low, 20 – 50 μV are medium, and above 50 μV are high. It is very important to obtain clean EEG before it is used.
The principal component analysis (PCA) method gives acceptable results for elimination of eye artifacts, but it cannot completely separate ocular artifacts from brain signals especially when they have comparable amplitudes [2]. Christopher J. James, et al shows temporally constrained ICA algorithm, which can extract signals that are statistically independent and are constrained by some reference signal so, Single Independent Component can be extracted based upon prior expectations of desired signal [3].
The method of ICA implemented by Li Da, et al is subspace ICA (SICA). To separate the EEG and EOG sources SICA is done using vector kurtosis [4]. A modified version of the FastICA algorithm for spatially constrained BSS the estimated selected columns of the mixing matrix are constrained with reference to constrained BSS the estimated selected columns of the mixing matrix are constrained with reference to predetermined source sensor projections [5]. Wavelet Transform can be used to study the time-frequency maps of EOG contaminated EEG. V.Krishnaveni, S.Jayaraman et al proposed wavelet transform to automatically identify and remove ocular artifacts from EEG [6]. Chunyu Zhao, Tianshuang Qiu has developed the Wavelet-Enhanced Canonical Correlation method in which canonical components are obtained through CCA decomposition of the raw EEG signals [7].
0 500 1000 1500 2000 2500 3000 -1600
-1400 -1200 -1000 -800 -600 -400 -200 0 200
Figure 1. Raw EEG Waveform
Israsena gives method of artifact removal using ICA and Lifting Wavelet Transform in that, ICA do source separation procedure by Infomax –ICA algorithm and LWT do Wavelet decomposition on all independent components derived from ICA to detect EOG and EMG artifacts. Finally inverse LWT and inverse ICA combine independent component into artifact free signal [9]. Dan-hua Zhu et al. used Sample Entropy (SampEn) method to efficiently identify the blink independent components (IC)[1].
In this paper we propose a method for ocular artifact (OA) removal in which we use Independent Component Analysis in addition with wavelet-based signal decomposition for noise reduction.
II. METHODOLOGY:ICA-WAVELET FOR ARTIFACT
REMOVAL
a. Independent Component Analysis:
ICA has been extensively used for the analysis and the decomposition of multichannel signals. If known signal is known then information of unknown signal is calculated by convolution of these two (known, unknown) signals.ICA is a statistical technique in which observed random data are linearly transformed into components that are considered to be maximally independent from each other. ICA can decompose observed signals into statistically independent components. The M observed EEG signals X (t) =[X1(t), X2(t)… Xm(t)]^T are generated as a sum of the N independent component S(t)=[S1(t), S2(t),… Sn (t)] ^T: X=As (1)
The matrix A=mixing matrix that consists of the mixing coefficients aij(i=1,2,……,N)(j=1,2,…….M) Generally, N (number of sources) and the A(mixing matrix) are unknown.. The ICA technique recovers the unknown source signals S(t) by introducing the unmixing matrix W: Z=Wx (2) W = inverse of the mixing matrix A. W obtained by considering the independence of the signal. Statistical independence and Stationary Signal are the properties of ICA Signal. Independent Component must have nongaussian distribution. To measure non-gaussianity Kurtosis, Negentropy, Mutual Information is calculated.
We used ICA to the 10-s raw EEG and obtained independent components by Second order blind indication method (SOBI). The two random variable are uncorrelated
if their covariance=0.Before applying ICA algorithm it is necessary to carry out preprocessing technique as Centering and Whitening. In SOBI the information is extracted from instantaneous mixture by simultaneously diagonalizing several time delayed covariance matrices.
b. Wavelet Transform(denoising):
Wavelet Transform can be used as a higher quality method for finding quasi harmonic components in any signal. The components extracted by ICA are given to DWT to denoise signal. In our work DWT is applied using Symlet wavelet over
Signal. Symlet wavelet is a family of wavelets. It is a modified version of Daubechies wavelet with increased symmetry.
The discrete wavelet transform (DWT) splits a finite length time domain signal in two parts: the detail and approximation information. Again the approximation domain is successively decomposed into detail and approximation domains, this procedure are followed up to n level. In our project 2 level of decomposition is carried out. The basic principle of decomposition of noisy signal by DWT is to concentrate on informative signal in few wavelet coefficients without modifying noise random distribution. After transformation small values of noise coefficients are obtained. So denoising can be achieved by soft and hard thresholding the wavelet coefficients using MATLAB wavelet tool box.
III. PROPOSED METHOD
Clean EEG comprises anything that does not contain artifacts. EEG recordings are collected using the
16-channel device at the sampling rate of 256 sps. Data is collected from five subjects (4 males and 1females of the age between 22-75 years) with the electrode locations (as per the International 10-20 electrode placement system) .Signals was collected while subject ware free to blink and move their eyes. “Fig.2,” shows step wise procedure for proposed algorithm. Checking PSD, Spikiness, kurtosis, Standard deviation like properties. If signal satisfies more than these properties applying flag, checked signal is taken as it is otherwise send back to noise cancellation and pure signal ‘s’ calculated and reconstruction of ICA is performed.
Fig2. ICA-Wavelet project steps Raw EEG data
from sensors
Export 10 sec data to Excel fffformat
Import data into Matlab
Fix position of window length
Check for valid Signal
Find frontal Channel
Apply SOBI-ICA algorithm for identification of noise
Wavelet decomposition & noise cancellation
By Symlet wavelet
Reconstruct ICA Reconstruct Wavelet
IV. RESULTS AND DISCUSSION
The EEG data of 5 patients were recorded at sampling rate of 256 Hz.
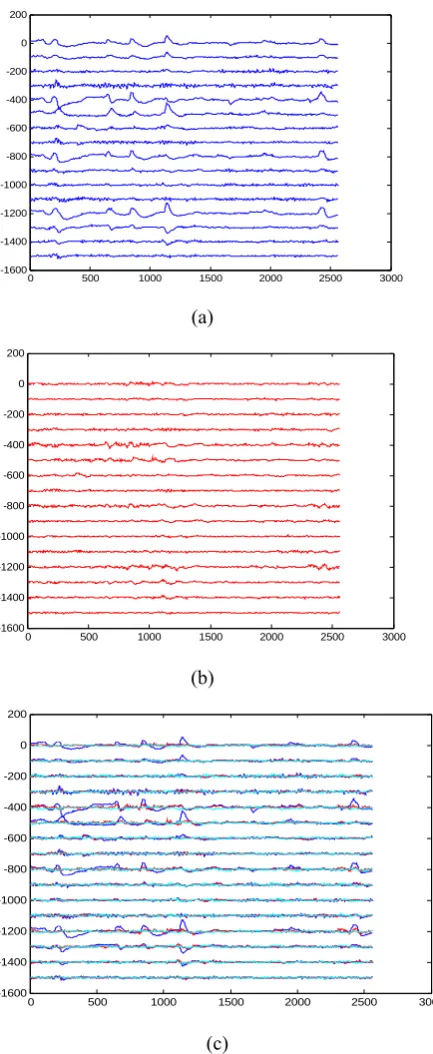
“Fig. 3,” (a), “Fig. 4,” (a) shows Noisy data of patient 1 & 2 respectively.“Fig. 3,” (b), “Fig. 4,” (b) shows Clean data of 2 patients. “Fig. 3,”(c),“Fig. 4,”(c) shows Contaminated EEG data, clean data as well as Reference Signal together. It shows that EOG artifacts are apparent in FP1 & FP2 channels more by eye movement & blink activities.
0 500 1000 1500 2000 2500 3000
-1600 -1400 -1200 -1000 -800 -600 -400 -200 0 200
(a)
0 500 1000 1500 2000 2500 3000
-1600 -1400 -1200 -1000 -800 -600 -400 -200 0 200
(b)
0 500 1000 1500 2000 2500 3000
-1600 -1400 -1200 -1000 -800 -600 -400 -200 0 200
(c)
Figure 3. (a), (b), (c) The Corrected EEG signal (Red color) obtained after removing noise and Noisy (Blue color) signal and Reference (Cyan color)
signal
0 500 1000 1500 2000 2500 3000
-1600 -1400 -1200 -1000 -800 -600 -400 -200 0 200
(a)
0 500 1000 1500 2000 2500 3000
-1600 -1400 -1200 -1000 -800 -600 -400 -200 0 200
(b)
0 500 1000 1500 2000 2500 3000
-1600 -1400 -1200 -1000 -800 -600 -400 -200 0 200
(c)
Figure 4. (a),(b),(c) The Corrected EEG signal(Red color) obtained after removing noise and Noisy (Blue color) signal and Reference (Cyan color)
signal.
The Statistical parameters used here to analyze artifactual activities are Standard Deviation, Standard Deviation Ratio, Variance, and RMSE. Clean and Noisy signals are compared with Reference Signal and calculated using MATLAB. The parameters mentioning in TABLE 1 are calculated using Equations as:
i. Standard Deviation:
(1)
1) Variance:
Variance=E[(X-µ)^2] (2) It gives adequate description of shape of distribution, if variance is less it is close to mean.
ii. Standard Deviation Ratio:
If Std (clean)/Std (Raw) <1 then it is predicted that clean signal is consistent than noisy.
iii. RMSE:
It gives difference between corrected and original signal.
(3) Rmse of corrected signal < Rmse of noisy signal which implies cleaned signal is more accurate.
In practice eye blink cause most common artifact & affect some channels of EEG recordings (most in FP1 & FP2).The proposed algorithm is suitable for detecting & denoising the ocular activities.
TABLE 1:PERFORMANCE PARAMETERS OF RAW &CLEAN DATA
Channels
Standard Deviation Variation Standard Deviation Ratio RMSE
Noisy Clean Noisy Clean Noisy Vs
Reference
Clean Vs Reference
Noisy Vs Reference
Clean Vs Reference
FP2-C4 11.89 3.74 141.47 13.99 3.62 1.1 9.97 3.4
F4-C4 6.72 2.75 45.19 7.60 2.29 0.9 4.02 1.77
C4-P4 4.57 2.88 20.91 8.27 1.03 0.6 2.3 1.99
P4-O2 6.92 3.73 47.99 13.95 1.5 0.8 2.78 1.78
FP2-F8 15.89 6.24 252.61 38.98 3.3 1.3 5.85 2.41
F8-T4 13.26 4.941 175.97 24.41 3.92 1.5 4.87 1.69
T4-T6 6.40 3.53 41.03 12.52 1.87 1 1.94 1.25
T6-O2 5.11 3.22 26.21 10.39 1.56 1 1.46 1.03
FP1-F3 13.68 5.33 187.27 28.42 3.38 1.3 3.9 1.48
F3-C3 4.89 3.15 23.95 9.95 1.24 0.8 1.23 0.98
C3-P3 3.85 2.59 14.835 6.71 1 0.7 0.97 0.85
P3-O1 5.49 3.23 30.23 10.46 1.35 0.8 1.27 0.95
FP1-F7 16.70 5.71 278.99 32.70 3.95 1.4 4.03 1.24
F7-T3 8.53 3.95 72.80 15.61 2.12 1 1.93 0.96
T3-T5 4.81 2.95 23.22 8.76 1.19 0.7 1.05 0.79
T5-O1 3.77 2.51 14.24 6.31 1.62 1.1 0.75 0.52
TABLE 2:PERFORMANCE PARAMETERS OF RAW &CLEAN DATA
Channels
Standard Deviation Variation Standard Deviation Ratio RMSE
Noisy Clean Noisy Clean Noisy Vs
Reference
Clean Vs Reference
Noisy Vs Reference
Clean Vs Reference FP2-C4 13.12 4.46 172.30 19.94 5.96 2.03 12.1 3.72
F4-C4 4.60 2.52 21.20 6.38 1.74 0.96 2.53 1.55 C4-P4 3.23 2.08 10.43 4.32 1.54 0.99 1.5 1.11 P4-O2 2.60 1.51 6.79 2.28 1.01 0.59 1.14 1.05
FP2-F8 14.02 4.32 196.6 18.71 5.55 1.71 5.68 1.58
F8-T4 16.06 7.77 258.02 60.44 4.42 2.14 5.9 2.72 T4-T6 3.10 2.02 9.62 4.08 1.2 0.78 0.98 0.82 T6-O2 4.39 2.91 19.27 8.47 1.46 0.97 1.22 0.9
FP1-F3 23.00 5.02 529.0 25.25 8.96 1.96 7.3 1.38
F3-C3 3.40 2.15 11.57 4.62 1.42 0.9 0.84 0.64 C3-P3 4.33 3.07 18.81 9.44 2.27 1.61 1.1 0.75 P3-O1 4.82 3.24 23.31 10.49 1.36 0.91 1.18 0.9 FP1-F7 23.02 5.02 530.08 25.24 8.43 1.84 6.08 1.15
III. CONCLUSION
Removal of ocular Artifacts is challenging task to obtain pure EEG signal. Here main objective is detect and remove the ocular artifacts from EEG signal.By the combination of two methods as ICA and Wavelet, the proposed method achieves good performance.
REFERENCES
[1] Ruhi Mahajan and Bashir I. Morshed, “Sample Entropy Enhanced Wavelet- ICA Denoising Technique for Eye Blink Artifact Removal from Scalp EEG Dataset”, 6th Annual International Conference on Neural Engineering, pp.6 – 8, Nov.2013.
[2] Snehal Gaikwad and K.P.Pardeshi, “Review on Removal of Ocular Artifact from Multichannel EEG Signal”, International Journal of Modern Engineering Research (IJMER) Vol. 6, Iss. 3 March 2016. [3] T. P. Jung, S. Makeig, C. Humphris, T. W. Lee, M. J. McKeown, V.
Iragui and T. J. Sejnowski, “Removing electroencephalographic artifacts by blind source separation,” Psychophysiology, Cambridge University Press, vol. 37, pp. 163-178, 2002.
[4] Christopher J. James and Oliver J. Gibson, “Temporally Constrained ICA: An Application to Artifact Rejection in Electromagnetic Brain Signal Analysis”, IEEE Transactions on biomedical Engineering, VOL. 50, NO. 9, Sept 2003.
[5] Li Da, Wu Jin, Zhang Jiacai, “An EOG Artifacts Correction Based on Subspace Independent Component Analysis”, 2010 International Conference on Computational Intelligence and Security.
[6] Christian W. Hesse,Christopher J. James, “The FastICA Algorithm With Spatial Constraints”, IEEE Signal processing letters, VOL. 12, NO. 11, Nov 2005.
[7] V.Krishnaveni, S.Jayaraman, S.Aravind, V.Hariharasudhan, K.Ramadoss “Automatic Identification and Removal of Ocular Artifacts from EEG using Wavelet Transform”, Measurement science review,Volume 6, Section 2, No. 4, 2006.
[8] Chunyu Zhao, Tianshuang Qiu,“ An Automatic Ocular Artifacts Removal Method Based On Wavelet-Enhanced Canonical Correlation Analysis”,33rd Annual International Conference, Aug 30-Sept 3, 2011.
[9] Nadia Mammone, Fabio La Foresta, Francesco Carlo Morabito, “Automatic Artifact Rejection from Multichannel Scalp EEG by Wavelet ICA”, IEEE Sensor journal, VOL. 12, NO.3, March 2012. [10] S. Jirayucharoensak P. Israsena, “Automatic Removal of EEG
Artifacts Using ICA and Lifting Wavelet Transform”, International Computer Science and Engineering Conference (ICSEC): ICSEC 2013.
[11] Foad Ghaderi, Hamid R. Mohseni, “A Fast Second Order Blind Identification Method for Separation of Perodic Sources”, 18th European signal processing conference: EUSIPCO, Aug 2010. [12] Adel Belouchrani, Karim Abed-Meraim, Jean-Fran¸cois Cardoso, “A
Blind Source Separation Technique using Second order Statistics ”, IEEE Transactions on Signal processing, VOL. 45, NO. 2, Feb 1997. [13] Thomas Kailath,“Blind Identification and equalization based on