on Annual Range Response to
Nitrogen and Phosphorus
R. E. LUEBS, A. E. LAAG, AND M. J. BROWN2 Research Soil Scientist, Agricultural Research Service, U. S.
Department of Agriculture; Principal Laboratory Techni- cian, University of California; and Soil Scientist, Agricultural Reseaich Se&ice, Riverside, California.
Highlight
Maximum forage yield increases from application of fertilizer to annual range in southern California were in the following order according to site class: swale > gentle slope > open slope. The increase in forage yield per pound of applied nitrogen was greatest for low rates of nitrogen at the slope sites and for a much higher rate at the swale site. Residual effect of fertilizer on forage yield, measured the second and third year after application, partially com- pensated for a first-year lack of response at lower producing sites or during low rainfall years. Yield increase the second year after application of 60 lb. of nitrogen and 26 lb. of phosphorus per acre was 50% of the increase from the same application that year. Range site class and fertilizer re- sidual effects are significant factors in fertilizer application programs on annual range in lower rainfall areas with high annual rainfall variability. Annual range soils that are deficient in available phosphorus by soil test require that the more limiting nitrogen deficiency be corrected before a forage yield response to phosphorus will be obtained.
Open annual range in California totals approxi- mately 10 million acres (Talbot and Sampson, 1948). Seeds germinate with the beginning of winter rainfall and vegetation matures near the close of the rainfall season in the spring. Although annual rainfall distribution largely determines the type of grassland, annual amount is the principal factor determining dry matter production.
California mineral soils are inherently low in nitrogen. Forage yield response to nitrogen fer- tilizer application on range soils has been reported by many investigators (Hoglund et al., 1952; Mc- Kell et al., 1959; Jones, 1960; Jones and Evans,
1960; Woolfolk et al., 1962; Jones, 1963; and Con- rad et al., 1966). Most of this research has been conducted in the coastal mountain areas of the central and northern parts of the state and in the foothills on the west side of the Sierra Nevada Mountains. Nitrogen application increases forage yield of annual range with winter rainfall in Aus- tralia (Rossiter, 1966) and Israel (Yitzchak and Seligman, 1969). According to Martin et al. (1958)
1 Contribution from the Soil and Water Conservation Re- search Division, ARS, USDA, and the California Agricul- tural Experiment Station. Received August 17, 1970; ac- cepted for publication November 6, 1970.
2 Present address is Soil Scientist, Snake River Conservation Research Center, Kimberly, Idaho.
Phosphorus deficiency on annual range in Cali- fornia is much less widespread than nitrogen defi- ciency. No response to phosphate fertilizers at inherent levels of available nitrogen were reported by Hoglund et al. (1952) and Jones (1963). Where nitrogen fertilizers were also applied forage yield increases from relatively high phosphorus applica- tions were reported by McKell et al. (1959) and Jones and Evans (1960). Additional information
on annual range response to phosphorus fertilizer was one of the objectives of this study.
Approximately 1.5 million acres of annual range are in the lower rainfall area of southern Califor- nia. The coefficient of variation of annual rainfall is much higher in this area (Hershfield, 1962). Coefficients from 40 to 45% in southern California compare with 20 to 35% in other annual range areas. There was a need for determining range site effects on the response to fertilizer and the residual effect of applied fertilizer under these lower and less predictable water availability conditions.
Study Area and Procedures
Experimental sites were established in an area typical of annual range in the Santa Ana Mountains of the Coast Range. They were located on the Santa Rosa Ranch near Murrieta, California at an elevation of 2,000 feet. Sites were selected for the site class study according to the criteria of Bentley and Talbot (1951). This study was conducted at Sites No. 1, 2, and 3 (Table 1) in 1960. Residual fertilizer effects were studied at Sites No. 1 and 4 in 1962, and nitro- gen and phosphorus effects were determined at all sites. Sites No. 1, 2, 3, and 4 were located within a radius of 1,000 feet while Site No. 5 was one-half mile from the others. Principal plant species at Sites No. 1, 2, 3, and 4 were wild oats (Avena fatua) and filaree (Erodium botrys). Other species were soft chess (Bromus mollis) and ripgut brome (Bromus rigidus). At Site No. 5 wild oats and filaree (Erodium moschatum) were dominant with lesser popula- tions of bicolor lupine (Lupinus bicolor), bur clover (Medi- cage hispada), wild barley (Hordeum leporinum), and soft chess also present.
EFFECT OF SITE 367
Table 1. Experimental site characteristics.
Soil
Site No. Site class Slope (%) Exposure Type Depth ( ft)
Total N1 Available P1 (%) (lb./acre)
1 Open, rolling slope 16 Southern Perris v.f. sandy loam 3-4 0.11 8
2 Gentle slope 9 Western Same as Site No. 1 >5 0.12 9
3 Swale 3 - Same as Site No. 1 >5 0.14 11
4 Open, rolling slope 15 Western Same as Site No. 1 3-5 0.12 9
5 Swale <2 - Twin Oaks clay loam >6 0.17 14
l O-6 inch soil depth.
phorus. Duncan’s multiple range test was used to evaluate the significance of treatment effects.
the possible exception of the latter combination at the swale site.
Site Class Effects
Forage yields were highest at the swale site and least at the open slope site (Table 2). Rainfall for the 1959-60 season was 16.5 inches, below the long time average of 20.0 inches. Forage production at the swale site was twice that at the open slope site both without fertilizer and at the highest yield level with fertilizer. Forage increases from a high yield- ing treatment, 60 lb. of nitrogen and 26 lb. of phosphorus, were 1,140, 1,740, and 1,580 lb. /acre for the open slope, gentle slope, and swale sites, respectively.
Where nitrogen alone was applied, the increase in yield per pound of nitrogen applied was greatest from the 30-lb. rate at the open slope and the gentle slope and from the 120-lb. rate at the swale. Phosphorus alone had no effect on yield at any site. However, combined with a nitrogen applica- tion there was a marked response to phosphorus especially at the gentle slope and swale sites. Sulfur applications, either alone or with nitrogen or nitro- gen plus phosphorus had no effect on yield with
Greater water deficiency at the open slope site is suggested as the major cause for the lower forage yield. Higher evapotranspiration on south facing slopes, greater potential for a runoff, and a shal- lower soil all support this explanation. More favor- able water availability and somewhat greater in- herent soil fertility probably were conducive to higher production at the swale site. These results indicate that relatively low rates of nitrogen ap- plication are more efficiently used on slope sites than high rates. In addition to requiring nitrogen applications, the most efficient response to phos- phorus apparently will be obtained at range sites where other factors affecting yield potentral such as water, are more favorable.
Residual Effect of Fertilizer
Table 2. Forage yield (lb./ acre) responses to applications (lb./acre) of nitrogen, phosphorus, and sulfur at 3 sites, 1960.
Since responses to fertilizer apparently were limited by water deficiency at the open slope site in 1960, observations for residual effects were made during the following two seasons. Rainfall for the 1960-61 season was 8.2 inches or less than half the long time average. Although vegetation on pre- viously fertilized plots was darker green in color, dry matter production was negligible and yield
Site class Fertilizer
applied Open slope Gentle slope Swale site
N-P-S site No. 1 site No. 2 No. 3
o-o-o 1,140 a1 1,540 a 2,320 a
30-O-O 1,660 ab 2,360 bc 2,480 a
60-0-O 1,920 ab 2,340 bc 2,580 a
120-O-O 1,940 ab 2,640 cd 3,440 bc
0-26-O 1,280 a 1,520 a 2,560 a
60-26-o 2,280 b 3,280 d 3,900 cd
O-0-60 1,180 a 1,820 ab 2,320 a
60-O-60 2,220 b 2,280 abc 2,880 ab
60-26-60 2,180 b 3,340 d 4,480 d
1 Within a column, means followed by the same letter do not differ significantly at the 5% level.
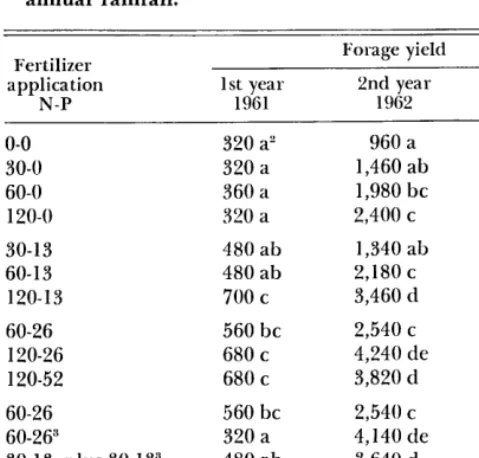
Table 3. Forage yield (lb./ acre) for the third year and the three-year period after fertilizer application (lb./acre).l
Fertilizer Forage yield
application Total
N-P 1962 1960 & 1962
o-o 1,280 ab2 2,420 a
30-O 1,860 bc 3,520 b
60-O 2,560 d 4,480 c
120-O 2,240 cd 4,180 bc
O-26 1,080 a 2,360 a
60-26 1,720 bc 4,000 bc
1 Open slope site, No. 1. Fertilizer applied prior to 1960 season. Little growth and no sampling the second year, 1961.
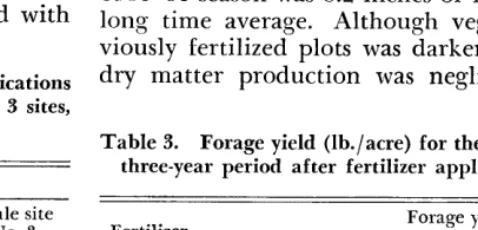
Table 4. Forage yield (lb./acre) response to fertilizer (lb./ acre), applied in December 1960, under highly variable annual rainfal1.l
Fertilizer application
N-P
1st year 1961
Forage yield 2nd year
1962 Total
o-o
30-O60-O 120-O 30-13 60-13 120-13 60-26 120-26 120-52 60-26 60-263
30-13, plus 30-13” 120-26
60-26, plus 60-O3 60-13, plus 60-133
320 a” 960 a
320 a 1,460 ab 360 a 1,980 bc 320 a 2,400 c 480 ab 1,340 ab 480 ab 2,180 c
700 c 3,460 d 560 bc 2,540 c 680 c 4,240 de 680 c 3,820 d 560 bc
320 a 480 ab
2,540 c 4,140 de 3,640 d 680 c
560 c 480 ab
4,240 de 5,360 f 4,800 ef
1,280 a 1,780 ab 2,340 bc 2,720 c
1,820 ab 2,660 c 4,160 d
3,100 c 4,920 ef 4,500 de 3,100 c 4,460 de 4,120 d 4,920 ef 5,920 g
5,280 fg
1 Site No. 4, rainfall 1960-61, 8.2 inches; 1961-62, 23.2 inches. 2 Within a column, means followed by the same letter do not dif-
fer significantly at the 5% level.
3 One initial and 3 additional applications were made in Decem- ber 19G1, prior to second year.
samples were not taken. Rainfall in 1961-62, the second season after fertilizer application, totalled 23.2 inches and forage production was relatively high (Table 3). Where 60 and 120 lb. of nitrogen had been applied two years earlier, greater yield increase was obtained than during the year of ap- plication (Table 2). Whereas 30 lb. was the most efficient rate of nitrogen during the season of application, residual effects increased the efficiency with the 60-lb. rate to a comparable level.
Residual effects were also great when rainfall was less than half the longtime average the year of fertilizer application and above average the second year (Table 4). Largest residual effects were measured for 60 and 120-lb. rates of nitrogen and for phosphorus in combination with 120 lb. of nitrogen. The two-year total increase in forage yield from one fertilizer application ranged from 500 lb./acre for 30 lb. of nitrogen to 3,640 lb./acre for 120 lb. of nitrogen and 26 lb. of phosphorus. One hundred percent of the former and 90% of the latter yield increase was a residual effect. Jones (1963) has reported a residual effect of nitrogen, but only at the 160-lb./acre rate. These results indicate’ that the residual effect of relatively low
Fertilizer Effect on Species Contribution to Forage Yield
rates of fertilizer on production during the second In a study of species contribution to forage yield and third year after application is an important the marked response of wild oats to increasing consideration in planning a fertility program on amounts of nitrogen was the most significant factor annual range, especially in southern California. contributing to increases in total dry matter from Splitting a total of 60 lb. of nitrogen and 26 lb. fertilizer (Table 5). The dry matter yield of wild of phosphorus equally between successive dry and wet years increased the yield a thousand pounds more than when the total amount was applied for the dry year and was nearly as effective as applying the total amount for the wet year (Table 4). Split- ting the application of 120 lb. of nitrogen and 26 lb. of phosphorus equally between successive dry and wet years was not markedly better than apply- ing the total amount for the dry year. However, ap- plying all of th e phosphorus for the dry year and splitting the nitrogen application was more effec- tive than applying all of the fertilizer for the dry year. Greater yields but less efficient use of nitro- gen was obtained with 120 lb. than with 60 lb. These results suggest that regular annual applica- tions of between 30 and 60 lb. of nitrogen plus approximately 15 lb. of phosphorus may be opti- mum for forage production on open slope sites under the low and more variable rainfall of south- ern California. The need for annual applications of nitrogen is probably greater than the need for annual applications of phosphorus.
Phosphorus Effect
According to Olsen et al. (1954) yield response to phosphorus would be expected at the low levels of available phosphorus in these soils. The appli- cation of phosphorus fertilizer alone to range with no leguminous species did not affect yield. Forage yield responses to phosphorus fertilizer applied with nitrogen was obtained over a three-year period at four sites (Tables 2 and 4). Increasing the nitro- gen rate to 120 lb./acre markedly increased the response to phosphorus (Table 4). These results contrast with those obtained by Hoglund et al. (1952), and Jones (1960 and 1963) which showed the nitrogen-phosphorus interaction on annual range to be generally insignificant. With an ap- plication of 150 lb. nitrogen and 87 lb. phosphorus per acre McKell et al. (1959) showed a large nitro- gen-phosphorus interaction in forage yield.
EFFECT OF SITE 369
Table 5. Forage yield (lb./acre) response of species to applications (lb./acre) of nitrogen and pbospborus.l
Forage yield Fertilizer
applied N-P
Other Wild Bicolor Bur grasses Filaree oats lupine clover & forbs Total O-O
O-26 60-26 120-26
2,440 540 420 240 740 4,380 a2 2,280 960 1,080 200 320 4,840 a 2,560 2,320 320 40 380 5,620 b 2,000 3,420 100 20 480 6,040 b l Swale Site No. 5, 1962.
2 Within this column, means followed by the same letter do not differ significantly at the 5%level.
oats was increased 1,360 and 2,460 pounds per acre by applications of 60 and 120 lb. of nitrogen, re- spectively. Increased grass yields as well as a rela- tively greater contribution of grasses to total forage yield had been reported by Jones (1963), Rossiter (1966), and Yitzchak and Seligman (1969).
Dry matter production of leguminous species, present at Site No. 5, was reduced by the nitrogen applications. Where phosphorus alone was applied, bicolor lupine comprised 22% of the total forage yield. The additional application of 60 and 120 lb. of nitrogen reduced the lupine component of the total forage to 6 and 2%, respectively. Inas- much as bicolor lupine is of low palatability to animals, its reduction by nitrogen application was considered desirable. Bur clover, which comprised only a small portion of the total dry matter, was also markedly reduced by nitrogen application. Jones (1963) and Yitzchak and Seligman (1969) reported reductions in the leguminous component of annual range vegetation by nitrogen application. In this study filaree yield was not affected by fer- tilizer application and its contribution to total yield became relatively less as yields increased.
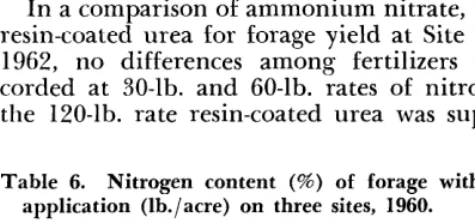
In a comparison of ammonium nitrate, urea and resin-coated urea for forage yield at Site No. 5 in 1962, no differences among fertilizers were re- corded at 30-lb. and 60-lb. rates of nitrogen. At the 120-lb. rate resin-coated urea was superior to
Table 6. Nitrogen content (%) of forage with fertilizer application (lb./acre) on three sites, 1960.
Fertilizer Nitrogen content
Table 7. Nitrogen content (%) of specie forage with nitro- gen and phosphorus application (lb./acre).l
Fertilizer applied N-P
Nitrogen content
Wild Legume Other Total
oats species” Filaree species forage
o-o
1.51 3.47 1.58 1.72 1.82O-26 1.28 3.17 1.92 1.58 2.01
60-26 1.18 3.05 1.68 1.41 1.51
120-26 1.16 2.67 1.90 1.48 1.45
l Swale Site No. 5, 1962. 2 Bicolor lupine and bur clover.
the other nitrogen carriers, suggesting that slow release forms of nitrogen may increase efficiency of nitrogen use with high application rates at swale sites.
Nitrogen Content of Forage
The effect of nitrogen fertilizer application on nitrogen content of forage differed with site class (Table 6). All rates of nitrogen increased nitrogen content at the open slope site. At the gentle slope and swale sites the 30-lb. rate did not increase nitrogen content and increases at higher rates of nitrogen application were smaller than at the open slope site. The total uptake of nitrogen (product of percent content in Table 6 and yield in Table 2), was similar for a given nitrogen rate at all sites. Apparently, where growing conditions were more favorable, greater increases in growth from nitrogen application diluted the nitrogen content of forage to lower values than were obtained at the open slope site.
A reduction in nitrogen content of forage with the application of fertilizer was measured at a swale site in 1962 (Table
7).
Increases in wild oats production from the combined applications of nitrogen and phosphorus (Table 5), largely ac- counted for the decreased nitrogen content of the total forage. The increase in wild oats growth not only decreased the nitrogen content of wild oats forage but also markedly increased the wild oats contribution to total dry matter both of which tended to reduce nitrogen content of the total forage. Phosphorus application alone increased nitrogen content of forage by stimulating growth of bicolor lupine (Table 5), with its inherently higher nitrogen content.applied N-P
Open slope Gentle slope Swale site
site No. 1 site No. 2 No. 3 Literature Cited
o-o 1.78 2.22 2.01 BENTLEY, J. R., AND M. W. TALBOT. 1951. Efficient use of annual plants on cattle ranges in the California foot-
30-O 2.33
60-O 2.98
120-O 3.31
2.04 1.91 hills. U. S. Dep. Agr. Circ. 870, l-52.
2.37 2.25 CONRAD, C. EUGENE, E. J. WOOLFOLK, AND DON A. DUNCAN. 2.49 2.58 1966. Fertilization and management implications on 60-26 3.14 2.20 2.01 California annual-plant range. J. Range -Manage. 19:
HERSHFIELD, DAVID M. 1962. A note on the variability of MCKELL, CYRUS M., JACK MAJOR, AND EUGENE R. PERRIER. annual precipitation. J. Applied Meteorology 1:575-578. 1959. Annual range fertilization in relation to soil mois- HOGLUND, 0. K., H. W. MILLER, AND A. L. HAFENRICHTER.
1952. Application of fertilizers to aid conservation on ture depletion. J. Range Manage. 12:189-193.
annual forage range. J. Range Manage. 5:55-61. OLSEN, STERLING R., C. V. COLE, FRANK S. WATANABE, AND L. A. DEAN. JONES, M. B. 1960. Responses of annual range to urea 1954. Estimation of available phosphorus
applied at various dates. J. Range Manage. 13:188-192. in soils by extraction with sodium bicarbonate. U. S. Dep. JONES, MILTON B. 1963. Yield, percent nitrogen, and Agr. Circ. 939. 19 p.
total nitrogen uptake of various California annual grass- ROSSITER, R. C. 1966. Ecology of the Mediterranean an- land species fertilized with increasing rates of nitrogen. nual-type pasture. Adv. in Agron. 18:10-66.
Agron. J. 55:254-257. TALBOT, M. W., AND ARTHUR W. SAMPSON. 1948. The
JONES, M. B., AND R. A. EVANS. 1960. Botanical composi- range in California. U. S. Dep. Agr. Yrbk. 575-581. tion changes in annual grassland as affected by fertiliza- WOOLFOLK, E. J., AND D. A. DUNCAN. 1962. Fertilizers tion and grazing. Agron. J. 52:459-461. increase range production. J. Range Manage. 15:42-45. MARTIN, W. E., L. J. BERRY, AND W. A. WILLIAMS. 1958. YITZCHAK, OFER, AND NO’AM SELIGMAN. 1969. Fertilization
Range fertilization in a dry year. Fourth Progress Report, of annual range in Northern Israel. J. Range Manage. University of California, Agr. Ext. Serv. 39 p. 22:337-341.
% + %
Phenology and Control
of Common Broomweed on
Texas Rangelands
C. J. SCIFRES, R. R. HAHN, AND J. H. BROCK2 Assistant Professor and Graduate Research Assistant, Department
of
Range Science, Texas A&M University,College Station; and Research Associate, Texas A&M University Agricultural Research and Extension Center,
Lubbock.
Highlight
Common broomweed (Gutierrezia dracunculoides (DC.) Blake) were effectively controlled with 24-D at 0.125, 0.25 or 0.5 lb./acre applied during stem elongation around May 15. The same rates of 24-D were less effective when applied in early April prior to complete emergence of the common broomweed seedlings or in mid- June after initiation of floral branches. Picloram combined with 24-D at 0.063, 0.125 or 0.25 lb./ acre of each herbicide controlled 94 to 100% of the common broomweed population regardless of application date. Dicamba was more effective when ap- plied in early spring than were equal rates of 2,4-D. Con- trol of common broomweed from applications of picloram or dicamba in early April was attributed to residual herbi- cide activity on seedlings germinated subsequent to treat- ment. However, no treatment prevented germination and establishment of common broomweed in the fall following application of herbicides in the spring.
Common broomweed (Gutierrezia dracuncu-
Zoides (DC.) Blake), an annual composite, occurs in grasslands from northern Kansas to the Gulf Coast and from western New Mexico to central
l Published with approval of the Director, Texas Agricul- tural Experiment Station as TA-8803. Received October 24, 1970; accepted for publication January 26, 1971. 2 The authors appreciate the cooperation of Mr. J. B. Dunn,
Robertson County, Texas, in making areas available on his ranch for a portion of this research.
Iowa (Anonymous, 1970). Common broomweed
reproduces from pubescent achenes, 1 to 1.5 mm long and 0.25 to 0.5 mm at their widest point. The upper half of the single-stemmed plant is much- branched and produces 5 to 10 small, yellow ray flowers per branch. Depending on site conditions common broomweed may grow from 5 to 10 dm tall. It is not toxic to livestock and is grazed by sheep and goats. However, cattle apparently do not utilize it to a great extent.
Common broomweed can become a serious prob- lem where overgrazing or drought reduces the grass cover on ranges. It invades most Texas range- lands with no observable preferences as to soil type. Efforts to control common broomweed with her- bicides on semiarid rangelands have met with varying degrees of success. Since data on common broomweed have not been available, most control methods have evolved from ranchers’ experience. Research on other herbaceous broadleaved weeds in grasslands such as musk thistle (Carduus nutans
L.) (Feldman et al., 1968) and scotch thistle (Ono- pordum acanthium L.) (Young and Evans, 1969) has shown that the stage of plant development influences susceptibility to herbicides. Little data are available on phenology of common broomweed and the interrelation of growth stage with its sus- ceptibility to herbicides. The objective of this study was to investigate the possible interaction of phenological development with susceptibility of common broomweed to several herbicides.
Materials and Methods