THE EFFECTS OF PRODUCTION TECHNIQUES
ON THE YIELD AND QUALITY OF SOME
LEAFY VEGETABLES
Submitted by Arvinder Kaur
B. Sc, B. Ed., M. Sc. (Botany), M. Phil (Botany)
A thesis submitted in total fulfilment
of the requirements for the degree of
Master of Science
Centre for Bioprocessing and Food Technology Victoria University of Technology
Werribee, Victoria, 3030 Australia
WER THESIS
635.3587 KAU
30001005475324
Kaur, Arvinder
The effects of production
techniques on the yield and
quality of some leafy
'•-i v *
"" \
c
r/ii=^lf=»TO
Ul
I certify that the thesis entitled THE EFFECTS OF PRODUCTION TECHNIQUES
ON THE YIELD AND QUALITY OF SOME LEAFY VEGETABLES and
submitted for the degree of MASTER OF SCIENCE is the result of my own research, and this thesis or any part of this thesis has not been submitted for a higher degree to any other university or institution.
IV
ACKNOWLEDGMENTS
It is my proud privilege to have worked under my revered supervisors Dr. Wendy Morgan, Research Manager, EGVIB project. Department of Agriculture, Knoxfield and Dr. Colin Hocking, Senior Lecturer in Biology, Victoria University of Technology. Their superb guidance, expert advice and benevolent attention all along with their unique knowledge has been most helpful and gave me much inspiration and encouragement without which this endeavour could not have accomplished the form it has now.
I am grateful to Prof Margaret Britz, Head of the Department of Bioprocessing and Food Technology and Department of Agriculture, Victoria, for providing me laboratory facilities.
My sincere thanks are due to Mr. Chris Egan, Chairman, VEGCO and EGVIB for their support with a postgraduate scholarship.
I wish to thank Rob Dimsey, Extension Officer, Department of Agriculture, Baimsdale, for his valued input into this research.
I express sincere thanks to the growers of Baimsdale for their cooperation and help and allowing me to undertake this research in their fields and reporting the results in the thesis.
My sincere thanks are due to Mr. John Reynolds, Biometrician, Department of Agriculture, Werribee, Victoria, for his help in statistical analysis of the results.
My special words of thanks are due to my families in India.
My sincere thanks are due to my friends.
SUMMARY
An opportunity exists for Australia to satisfy the expanding Asian fresh produce markets, because of our climate, space and technology to expand and enhance production of fruit and vegetables. Growers always strive to obtain maximum yields of high quality produce from their fields. Many factors such as climate, suitable cultivars, cultivation practices, soil, availability of water and nufrients can influence yields of high quality produce. An important and effective method to reduce costs is to improve productivity while maintaining quality.
East Gippsland, the focus of this study, has a significant opportunity and potential for the production of fresh whole and fresh - cut packaged, branded vegetables for the domestic and export markets.
The aim of this research was to investigate the effects of current irrigation practices on overall yield and the occurrence of hollow stem in broccoli and to compare the outcomes from different irrigation systems.
Trials were conducted in the fnst year (1993 / 94) over three different seasons: spring, summer and autumn to identify the effects of seasonality and irrigation (amount of water volume applied), as well as nutrient uptake on broccoli hollow stem using the same cultivar (Marathon). In the second year (1995), trials were extended to three different irrigation systems i.e. drip irrigation, fixed overhead sprinklers (new to the region) and fravelling irrigator (currently used by most of the growers). The yield, quality and hollow stem rating used three systems of irrigation were compared.
VI
Drip irrigation showed many benefits over the travelling irrigators. An important advantage of drip irrigation is water saving and ultimately reduction in cost.
Table of Contents
Vll
Title
Dedication
Statement of Authorship
Acknowledgments
Summary
Table of contents
List of Tables
List of Plates
List of Figures
1
ii iii
iv
V vii
X
xii xii
Chapter 1
Introduction 1
Chapter 2
Literature Review 4
2.1 Cultural Practices affecting Production 4
2.1.1 Irrigation 4 2.1.2 Tillage 6
2.2 Broccoli: Quality and Quantity of Production 9
2.2.1 Botany and quality characteristics 9
2.2.2 Nutritional value 10 2.2.3 Hollow stem in broccoH 10
2.3 Lettuce: Quality and Quantity of Production 14
2.3.1 Botany and quality characteristics 14
2.3.2 Nutritional value 15 2.3.3 Tipbum/head rot in lettuce 15
2.3.4 Environmental effects on physical characteristics 17
2.4 General Hypotheses for Field Trials of Broccoli and Lettuce 18
Chapter 3
Material and Methods
3.1 Field Trials year 1 (1993/94)
3.1.1 Broccoli 3.1.2 Lettuce
V l l l
3.2 Field Trials year 2 (1995) 24
3.2.1 Broccoli site 11 24 Drip irrigation 25 Overhead sprinklers 25 3.2.2 Broccoli site 12 25
3.3 Soil Analysis 26
3.3.1 Soil profile 26 3.3.2 Field soil moisture content 27
3.3.3 Soil moisture tension 27
3.4 Irrigation 28
3.5 Yield and Quality Measurements 29
3.5.1 Broccoli 29 Maturity at harvest 29
Hollow stem 30 Market value 30 Breakdown 31 3.5.2 Lettuce 31 Firmnes 31
Maturity 31 Head rot 31 Market value 31 Breakdown 31
3.6 Plant Analysis 31
3.6.1 Plant growth 32 3.6.2 Photosynthesis 32 3.6.3 Nufrient analysis 32
Potassium and Calcium (ashing) 32
Potassium 33 Calcium 34 Boron 35 Nitrogen 37
3.7 Statistical analysis 39
Chapter 4
Results
4.1.1 Broccoli
40
4.1 Field Trials: year 1 (1993/94) 40
40
IX
Trial 2 (summer) 61 Trial 3 (autumn) 81
4.1.2 Lettuce 94 Trial 1 (autumn) 94
4.2 Field Trials: Year 2 (1995) 97
Drip irrigation - 1 97 Drip irrigation - 2 100 Overhead sprinkler-1 103 Overhead sprinkler-2 107 Travelling irrigator 115
Chapter 5
Discussion 121
5.1 Broccoli: Year 1 (1993/94) and Year 2 (1995) 121 5.1.1 Field capacity, Water availability. Soil types and Irrigation 121
5.1.2 Irrigation, Boron uptake and Hollow stem in Broccoli 123
5.1.3 Comparison of three irrigation systems (1995) 129
5.2 Lettuce: Year 1 (1994) 131
5.3 Conclusion 132
Chapter 6
Photosynthesis 134
Chapter 7
Appendix 137
Chapter 8
List of Tables
Table 1: Growth stages of broccoli 9 Table 2: Nufrient composition of broccoli 10 Table 3: Nufrient composition of lettuce 15 Table 4: Broccoli year 1 (1993/94) frials 1, 2 and 3 20
Table 5: 'NPKS' nitrophoska fertiHser used at sites 1, 3, 4, 6, 7 and 9 22 Table 6: 'NPKS' pivot blue fertiliser composition used at sites 2, 5 and 8 23
Table 7: Working standard solutions for K 34 Table 8: Working standard solutions for Ca 35
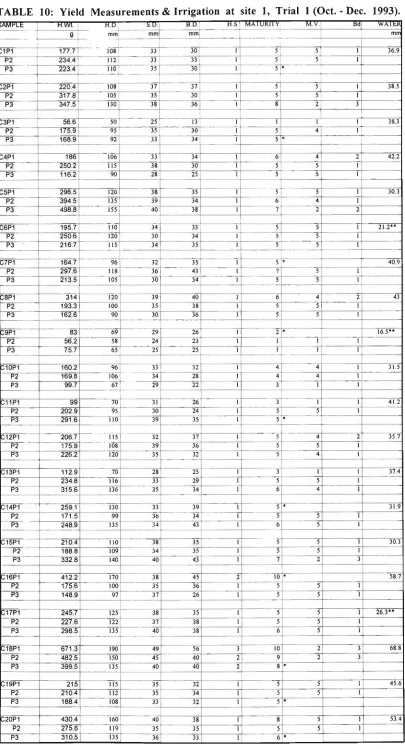
Table 9: Boron standards 36 Table 10: Yield measurements & irrigation at site 1, frial 1 (Oct. - Dec. 1993) 43
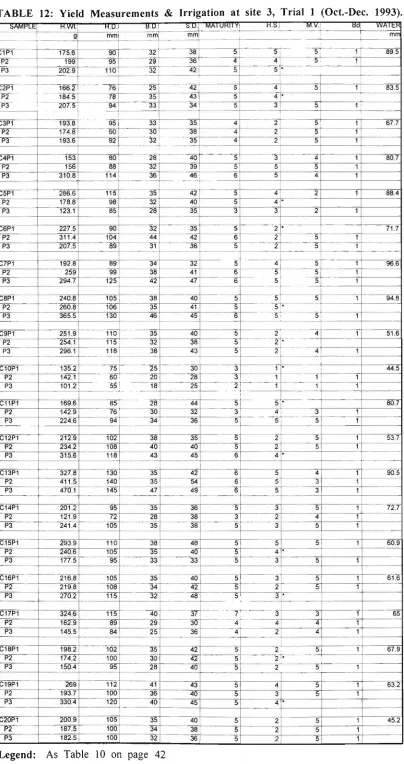
Table 11: Yield measurements & irrigation at site 2, trial 1 (Oct.- Dec. 1993) 49 Table 12: Yield measurements & irrigation at site 3, frial 1 (Oct.- Dec. 1993) 55 Table 13: Correlation matrix between Yield and Quality parameters across the
three sites (frial 1) 59 Table 14: Yield analysis for frial 1 59 Table 15: Correlation mafrix between water and nufrients across the three ites
(frial 1) 60 Table 16: Effect of a number of variables on hollow stem ratings for trial 1 60
Table 17: Yield measurements & irrigation at site 4, trial 2 (Dec.'93 -Feb.'94) 63 Table 18: Yield measurements & irrigation at site 5, trial 2 (Dec.'93 - Feb.'94) 68 Table 19: Yield measurements & irrigation at site 6, trial 2 (Dec.'93 - Feb.'94) 74 Table 20: Correlation matrix between the yield and quality parameters across
the three sites (trial 2) 77 Table 21: Yield analysis for frial 2 78 Table 22: Correlation mafrix between different nufrients, water applied, fresh weight
and hollow stem across the three sites 79 Table 23: Effects of a number of variables on hollow stem ratings for frial 2 79
Table 24: Model probabilities of hollow stem rating at three sites with fixed water
and boron 80 Table 25: Yield measurements & irrigation at site 7, frial 3 (Mar. - May 1994) 83
XI
Table 28: Correlation mafrix between yield and quality measurements across
the three sites (trial 3) 93 Table 29: Yield and quality analysis for trial 3 93
Table 30: Yield measurements & irrigation at site 10 (Mar. - may 1994) 95 Table 31: Correlation matrix between fresh weight, head diameter and water 96 Table 32: Yield measurements at site 11 (drip irrigation-1) Jan.-Mar.'95 98 Table 33: Yield measurements at site 11 (drip irrigation-2) Jan.-Mar.'95 101 Table 34: Yield measurements & irrigation at site 11 (overhead sprinklers-1)
Jan.-Mar. ' 9 5 104 Table 35; Yield measurements & irrigation at site 11 (overhead sprinklers-2)
Jan.-Mar.'95 108 Table 36: Correlation mafrix between yield and quality measurements at site 11
(drip irrigation -1 and 2) 112 Table 37: Correlation mafrix between yield and quality measurements at site 11
(overhead fixed sprinklers-1 and 2) 112 Table 38: Correlation matrix between nitrogen and boron for the two systems 114
Table 39: Yield measurements & irrigation at site 12 (Jan.-Mar.'95) 116 Table 40: Correlation matrix between yield and quality measurements for site 12 120
Table 41: Correlation matrix between nitrogen and boron for site 12 120 Table 42: Model probabilities of hollow stem ratings with one measurement of water
Xll
List of Plates
Plate 1 Plate 2 Plate 3 Plate 4 Plate 5 Plate 6
21a
24a
25a
27a
28a
134a
List of Figures
Figure 1: Total rainfall for frial 1 sites (October-December) 20 Figure 2: Total rainfall for trial 2 sites (December-February) 21
Figure 3: Total rainfall for frial 3 sites (March-May) 21 Figure 4: Total rainfall for 1995 frial sites (January-March) 26
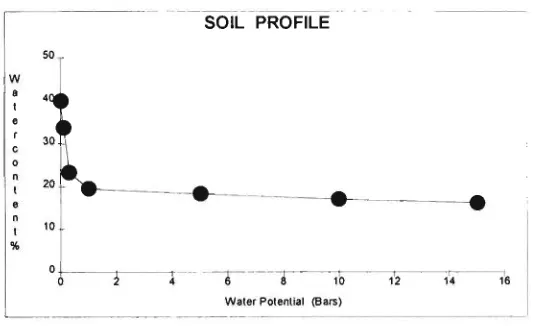
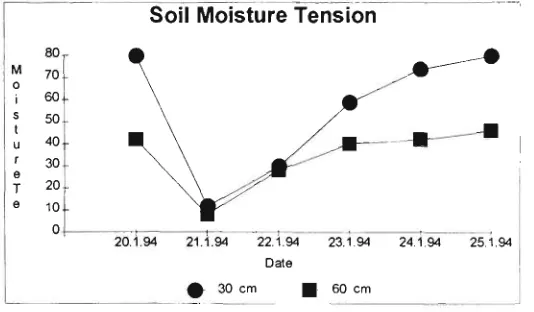
Figure 5: Moisture characteristic curve at different water potentials for site 1 40 Figure 6: Field soil moisture content during an irrigation cycle at site 1 41 Figure 7: Irrometer readings for soil moisture tension for an irrigation cycle
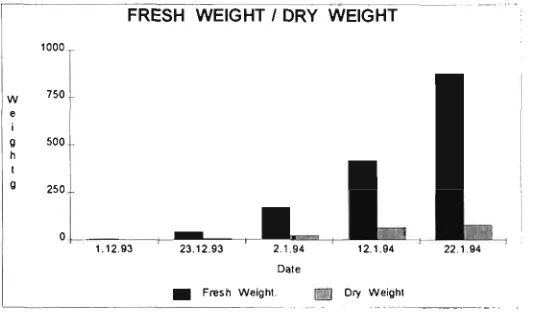
at site 1 41 Figure 8: The average fresh and dry weights of broccoli plants for site 44
Figure 9: Hollow stem rating as affected by irrigation water 45 Figure 10: Concenfration of B as affected by irrigation water 45 Figure 11: Hollow stem as affected by B concentration 46 Figure 12 Hollow stem rating as affected by N concentration 46 Figure 13: Head weight as affected by irrigation water 47 Figure 14: Moisture characteristic curve at different water potentials for site 2 47
Figure 15: Field soil moisture content during an irrigation cycle at site 2 48 Figure 16: Irrometer readings for soil moisture tension for an irrigation cycle
at site 2 48 Figure 17: The average fresh and dry weights of broccoli plants for site 2 50
Figure 18 Hollow stem rating as affected by irrigation water 51 Figure 19: B concenfration as affected by irrigation water 51 Figure 20: Hollow stem as affected by B concenfration 52 Figure 21: Hollow stem rating as affected by N concenfration 52 Figure 22: Moisture characteristic curve at different water potentials for site 3 53
xni
Figure 24: Irrometer readings for soil moisture tension for an irrigation cycle
at site 3 54 Figure 25: The average fresh and dry weights of broccoli plants for site 3 56
Figure 26: Hollow stem rating as affected by irrigation water 57 Figure 27: B concenfration as affected by irrigation water 57 Figure 28: Hollow stem as affected by B concentration 57 Figure 29: Hollow stem rating as affected by N concentration 58
Figure 30: Head weight as affected by irrigation water 58 Figure 31: Moisture characteristic curve at different water potentials for site 4 61
Figure 32: Field soil moisture content during an irrigation cycle at site 4 61 Figure 33: Irrometer readings for soil moisture tension for an irrigation cycle
at site 4 62 Figure 34: The average fresh and dry weights of broccoli plants for site 4 64
Figure 35: Head weight as affected by irrigation water 65 Figure 36: Hollow stem rating as affected by irrigation water 65 Figure 37: B concenfration as affected by irrigation water 65 Figure 38: Hollow stem as affected by B concenfration 66 Figure 39: Moisture characteristic curve at different water potentials for site 5 66
Figure 40: Field soil moisture content during an irrigation cycle at site 5 67 Figure 41: Irrometer readings for soil moisture tension for an irrigation cycle
at site 5 67 Figure 42: The average fresh and dry weights of broccoli plants for site 5 69
Figure 43: Broccoli head weight as affected by irrigation water 70 Figure 44: Hollow stem rating as affected by irrigation water 70 Figure 45: B concentration as affected by irrigation water 70 Figure 46: Hollow stem as affected by B concenfration 71 Figure 47: Moisture characteristic curve at different water potentials for site 6 71
Figure 48: Field soil moisture content during an irrigation cycle at site 6 72 Figure 49: Irrometer readings for soil moisture tension for an irrigation cycle
at site 6 72 Figure 50: The average fresh and dry weights of broccoli plants for site 6 75
XIV
Figure 56: Field soil moisture content during an irrigation cycle at site 81 Figure 57: Irrometer readings for soil moisture tension for an irrigation cycle
at site 7 82 Figure 58: The average fresh and dry weights of broccoli plants for site 7 84
Figure 59: Moisture retention curve at different water potentials for site 8 85 Figure 60: Field soil moisture content during an irrigation cycle at site 8 85 Figure 61: Irrometer readings for soil moisture tension for an irrigation cycle
at site 8 86 Figure 62: Soil water content for probe B at site 8 over a 5 week period with two
irrigations. Water content is sum at sensors at 10 + 20+30 + 50 + 70 cm
depths 86 Figure 63: Soil water content for probe A at site 8 over a 5 week period with two
irrigations. Water content is sum at sensors at 10 + 20+30 + 50 + 70 cm
depths 87 Figure 64: The average fresh and dry weights of broccoli plants for site 8 89
Figure 65: Moisture retention curve at different water potentials for site 9 89 Figure 66: Field soil moisture content during an irrigation cycle at site 9 90 Figure 67: Irrometer readings for soil moisture tension for an irrigation cycle
at site 9 90 Figure 68: The average fresh and dry weights of broccoli plants for site 9 92
Figure 69: Moisture characteristic curve at different water potentials for site 10 94 Figure 70: The average fresh and dry weights of lettuce plants for site 10 96 Figure 71: Moisture retention curve at different water potentials for site 11
(drip irrigation - 1) 97 Figure 72: The average fresh and dry weights of broccoli plants for site 11
(drip irrigation - 1) 99 Figure 73: Hollow stem as affected by B concenfration 99
Figure 74: Hollow stem rating as affected by N concenfration 100 Figure 75: Moisture retention curve at different water potentials for site 11
(drip irrigation-2) 100 Figure 76: The average fresh and dry weights of broccoli plants for site 11
(drip irrigation - 2) 101 Figure 77
Figure 78 Figure 79
Hollow stem as affected by B concenfration 102 Hollow stem rating as affected by N concenfration 102 Moisture retention curve at different water potentials for site 11
XV
Figure 80: The average fresh and dry weights of broccoli plants for site 11
(overhead sprinklers - 1) 105 Figure 81: Head weight as affected by irrigation water 105
Figure 82: Hollow stem rating as affected by irrigation water 106 Figure 83: Hollow stem as affected by B concenfration 106 Figure 84: B concenfration as affected by irrigation water 106 Figure 85: Hollow stem rating as affected by N concenfration 107 Figure 86: Moisture retention curve at different water potentials for site 11
(overhead sprinklers-2) 107 Figure 87: The average fresh and dry weights of broccoli plants for site 11
(overhead sprinklers - 2) 109 Figure 88: Head weight as affected by irrigation water 110
Figure 89: Hollow stem rating as affected by irrigation water 110 Figure 90: Hollow stem as affected by B concenfration 111 Figure 91: B concenfration as affected by irrigation water H I Figure 92: Hollow stem rating as affected by N concentration 112 Figure 93: Variation in yield parameters with drip and overhead sprinkler
irrigation 113 Figure 94: Moisture retention curve at different water potentials for site 1 115
Figure 95: The average fresh and dry weights of broccoli plants for site 1 117
Figure 96: Hollow stem rating as affected by irrigation water 118
Figure 97: B uptake as affected by irrigation water 118 Figure 98: Hollow stem as affected by B concenfration 119 Figure 99: Hollow stem rating as affected by N concentration 119 Figure 100: Broccoli head weight as affected by irrigation water 119 Figure 101: Comparison of weekly fresh weight growth at sites 1, 2 and 3 127
1. INTRODUCTION
Vegetable production is one of the major branches of horticulture. Ausfralia has the climate, space, labour, capital and technology to expand and enhance production of many types of vegetables and fruit. Ausfralia's location in the southern hemisphere, which leads to an unusual seasonality for most horticultural products, provides an opportunity to supply fresh produce to world markets in the northern hemisphere during their off season. Furthermore, Ausfralia is close to an expanding Asian market with booming economies.
The total value of Australia's fruit and vegetable exports is small compared with that of many of its competitors and potential competitors, many of which are southern hemisphere countries. Reasons advanced to explain the perceived poor performance of Ausfralian horticultural produce on exports markets include product perishability, low levels of commitment to export within industry and inadequate and unreliable transport services.
Victoria is the second largest producer of vegetables in Australia, behind Queensland (ABS, 1991). In 1991, the gross value of production of Victorian vegetables made up 26% of Ausfralia's $ 1,413 m gross value of production of vegetables with Victoria's vegetable exports worth only $10.7 m or 15% of the total value of Ausfralian vegetable exports (ABS, 1991). Vegetables are grown throughout the state with nearly half the production within 100 km of Melbourne. The other major vegetable producing districts are East Gippsland, Central Gippsland, Sunraysia, Goulbum Valley and along the Murray river areas with smaller volumes grown in Cenfral Highlands and Cenfral Gippsland areas (ABS, 1991).
East Gippsland, which is the focus of this study, has three major production areas cenfred on the Mitchell River at Lindenow, Snowy River at Orbost, around Maffra on the Avon River and the McAlister Irrigation Scheme. The mild climate resulting from its coastal location with relatively cool summers and mild winters makes the area suitable for growing a wide range of crops over extended periods (Belder,
1985).
sold to Edgell - Birds Eye in 1988. Vegetable production grew rapidly from 728 ha in 1984 to 3, 929 ha in 1990/91, (ABS statistics, 1990/91).
The closure of the Gardenland plant in Baimsdale in 1992 provided both a threat and an opportunity to growers and related indusfries in the region. A study commissioned by the East Gippsland Vegetable Industry Board (EGVIB) from Boston Consulting Group (1992) identified a number of factors responsible for inhibiting the vegetable industry in East Gippsland from becoming world competitive including: size of individual farms, irrigation, transport and handling procedures, post harvest crop care, yield and poor understanding of market chain. This study also showed that a significant opportunity existed in the region for the production of fresh whole and cut packaged - brand vegetables for domestic consumption and export.
The Boston Consulting Group study (1992) identified the need for a research and development program which was established by the EGVIB. The main objective of the EGVIB board was to provide a market - focused and commercially driven research and development program that ensured a competitive edge and the long-term survival of the vegetable industry in East Gippsland. A fresh vegetable company VEGCO Ltd, directly associated with this board has focused on marketing whole and precut produce such as broccoli, lettuce etc. for domestic and export markets.
One of the most effective methods for reducing unit costs of fresh produce is to improve production per hectare (i.e. productivity) whilst maintaining quality. One potential area for achieving this is via irrigation type and schedule. Currently fravelling irrigators or movable pipes are used by most growers in the East Gippsland region. Although growers shifted from flood irrigation to overhead watering, there is still a potential wastage of about 50 - 70% of water applied (Bogle and Hartz, 1986, Locascio et al, 1985). Furthermore, current irrigation scheduling is mostly guesswork which appears to alternate between flooding and droughting. The aim of this study was to investigate the effect of current irrigation practises on the yield and quality of leafy vegetables - Broccoli and Lettuce.
In 1992, some of the agricultural issues of economic importance that affected the East Gippsland region are:
3. There is concern over water use and water could become scarce in the future.
It has been found that these physiological disorders such as hollow stem in broccoli and head rot in lettuce are induced by nutrition deficiency (see literature review). Discussions with a number agronomists (Jeff Billing - Henderson seeds, Mike Meyer - SPS seeds and Dan Timboli - Yates) suggested that these disorders along with nutrition deficiency are probably exacerbated by local practices of current irrigation. This thesis has investigated the effect of irrigation on nutrient uptake and hollow stem in broccoli and head rot in lettuce. The study focused on three broad eispects:
1. The effect of volume of water on yield and quality of broccoli.
2. The effect of different irrigation systems on yield and quality of broccoli. 3. A preliminary investigation of the effect of irrigation and nufrient uptake on
2. LITERATURE REVIEW
2.1 CULTURAL PRACTICES AFFECTING PRODUCTION:
2.1.1 Irrigation
The yield and quality of any horticultural product are sfrongly affected by crop management techniques. Best quality produce is produced by maintaining continuous and regular growth in the field. Any check in growth is likely to affect the quality and quantity of the yield (Lomman and Maier, 1988). Irrigation is one technique which can affect the quality and quantity of the product to a significant extent, especially in leafy vegetables. Progressive development and high yields are possible only when water distribution is as even as possible over the entire crop. The effect of soil - moisture deficit on plant growth and crop production has been the subject of much research. In leafy vegetables, where fresh weight and quality of the harvested plant parts are the important attributes, high moisture sfress often decreases the crop yield.
Even in ancient agriculturally based civilisations irrigation played a major role (Bucks and Nakoyoma, 1986). The dominant methods of irrigation from these early times have been surface or gravity and sprinkler irrigation. Trickle / drip irrigation is a relatively new approach and was developed from sub - irrigation where irrigation water is applied by raising the water table (Bucks and Nakoyoma, 1986). Drip irrigation offers many advantages; e.g. reduced contamination of soil by fertilisers, reduced disease outbreak, less water usage and less waterlogging of soil (Hochmuth, 1992). Water is applied only to the root zone of the plant through confrolled discharge emitters and at discrete locations along the plant rows resuhing in limited irrigated areas (Clark, 1992). In the mid-1960's through mid-1970's it was considered an emerging technology with potential for application limited only to high - priced, speciality crops. Today, it is used on a wide variety of crops, even those that were initially considered unprofitable for management under drip irrigation.
Drip irrigation has many benefits, some of which are becoming more important in today's environmentally conscious world. One major benefit is the ability to conserve water and reduce fertiliser loss, in comparison with other irrigation and fertilisation systems. Water savings with drip irrigation can amount to as much as 80% compared with other irrigation methods (Bogle and Hartz, 1986; Locascio et
growers in urban areas and in areas with limited water supply such as East Gippsland.
Bogle and Hartz (1986) compared drip and furrow irrigation of muskmelon
{Cucumis melo L. Cultivar 'Perlita") and found that there was a frend toward early
maturity and high total and marketable yields with drip irrigation. They also found that drip irrigation as practised in this study had a number of important cultural advantages such as, low weed competition and no resfriction of the delivery of field operation due to wet flirrows and water through the harvest season.
Vegetable growers in East Gippsland tend to use travelling irrigators or movable pipes which makes irrigation slow and difficult to get around a large acreage (or a number of paddocks) quickly, or as required, resulting in increased likelihood of moisture sfress, particularly at crop establishment, where seedlings often are left 24 hours before "watering". Furthermore, irrigation is often scheduled by growers in East Gippsland on the basis of convenience rather than need. Previous work has shown that soil moisture sfress can effect broccoli and lettuce yield to a great extent (Singh and Alderfer, 1966; Sale, 1966). Broccoli was found to be most sensitive to moisture stress during head formation and enlargement, although moisture sfress during any period of growth reduces final yield and quality. Singh and Alderfer (1966) also found that total yield, individual head weight and quality of lettuce were decreased when a soil moisture stress greater than 100 KPa at 12.5 cm in the row developed during any period of growth.
Inefficient water use can also reduce aeration, slow growth, and restrict root development. Better irrigation practice is a key to better dollars for East Gippsland farmers. Drip irrigation and fixed overhead sprinklers are alternative methods that could potentially improve water use efficiency while minimising the cultivation problems associated with current irrigation practices in East Gippsland.
Drip irrigation is an important irrigation method in the crop production areas of the world, particularly in arid areas or areas that have a high competition for available water resources and is becoming common practice for many vegetable crops in Florida (Hochmuth, 1992). Micro - irrigation (fertigation), is another application of drip irrigation, where solution is dispensed to the crop via small plastic tubes or drip type emitters. Dangler and Locascio (1990a and 1990b) found that tomato fruit quality improves when nitrogen and potassium are applied by drip irrigation compared with applying all fertiliser preplant.
Increased efficiency with micro - irrigation not only saves production costs, but also reduces the potential for ground water pollution due to fertiliser leaching with large amounts of rain or periods of excess irrigation (Hochmuth, 1992). Water does not come in contact with plant foliage with drip irrigation, which reduces susceptibility to foliar disease outbreak and leads to an associated reduction in fungicide use.
While drip irrigation has many potential benefits, it also presents some challenges. The system must be carefiiUy designed and installed so that fertilisers and chemicals can be applied in a safe, legal and efficient manner (Clark, 1992; Clark et al, 1988, 1990 b). Significant technical skills and management are required to operate these systems for peak efficiency.
Most vegetable crops are adaptable to drip irrigation, especially those produced on bedded systems using polythene mulch. Drip irrigation, when used in conjunction with plastic mulch creates a closed system containing an environment suitable for maximum vegetable crop growth / yield, and if used effectively, minimal labour and chemical leaching (Lamont, 1992).
In summary, efficient irrigation is very important for the cost effective vegetable production. If irrigation is scheduled correctly using an efficient irrigation system, the yield, quality and quantity of produce can be improved.
2.1.2 Tillage
erosion, improves tilth and porosity of soil and reduces excessive soil surface temperatures during the early stages of plant grov*^ (Falayi and Lai, 1978; Lai, 1979). Similarly, reduced tillage of irrigated silt soils from temperate regions increases infilfration, available water and macro-porosity (Cockroft and Martin, 1981; Tisdall et al, 1984).
Ridge tillage is the term used for any cropping system in which plants are grown on ridges in rows, with one or more rows per ridge (Tisdall and Hodgson, 1990). Ridges may be temporary or permanent and receive varying degrees of tillage. Ridges are alternatively referred to as raised beds or lands.
Ridge tillage has been used successfully in Australia for vegetables production. Many farmers are maintaining permanent ridges to improve soil structure, save time and reduce costs (Tisdall and Hodgson, 1990). Better yields from crops grown on ridges compared with flat tillage were attributed mainly to better soil aeration and better drainage (Tisdall and Hodgson, 1990). West and Black (1969) showed that the mean oxygen flux in the top 0.2 m in non-irrigated ridges in Knoxfield, Victoria was up to 24 times that in the flat or unraised plots, leading to higher yields.
A good seed - bed provides close contact between seed and soil, and yet provides soft stable aggregates of soil that do not limit the growth of emerging seedlings and roots (CoUis-George and Lloyd, 1979). The Tatura system of permanent beds, where soil is manipulated a minimum number of times, allows permanent beds of soil to be used year after year (Adem et al, 1982). One advantage of the Tatura system over the commercial system of preparing seed-beds is that in the Tatura system the seeds are sown into wet soil; the seedlings emerge without further irrigation, thereby reducing the risk of heavy rain forming a crust before seedling emergence (Adem et al, 1984).
custom prescribed tillage concept to develop a management system, for a combination of soil, crop(s), and climate which can lead to increased and sustained productivity.
Multiple cropping, in which two or more crops are grown on the same field in one year, is common in warm parts of the world at all levels of agricultural technology (Andrews and Kassam, 1976). Vegetable growers in Victoria use this method to produce 3-4 crops per year. Total productivity per year is increeised with less risk of all crops failing. Because the land may be covered with a crop for most of the year, multiple cropping can improve soil structure, increase the amount of organic carbon in soil, and reduce erosion. Relay cropping is one form of multiple cropping, in which a second crop is sown after the first crop has reached its reproductive stage but has not been harvested (Andrews and Kassam, 1976). Machinery has been designed specifically for relay cropping in south-eastern Ausfralia which has enabled maize to be successfiilly sown into wheat crops. When sown 2, 4 and 5 weeks before wheat was harvested maize yielded more than when sown one day after harvest (confrol) and when grown fraditionally as sole crops in northern Victoria (Tisdall and Adem, 1990).
2.2 BROCCOLI: Quality and Quantity of Production
Broccoli is a well - known and popular vegetable used in both Chinese and western cooking, either as a fresh or frozen product. It is nutritionally rich and a good source of many vitamins and minerals. Broccoli is potentially available as a year round crop. Australian broccoli is of a high quality, well regarded and in good demand during production season (May - October). The export market requires broccoli with a medium to large sized compact head of approximately 10 cm diameter and a stem length of 75 - 90 mm. The head should be uniformly green with no sign of yellowing. It is priority one vegetable for export to South East Asia.
2.2.1 Botany and Quality Characteristics
Broccoli is a member of the Cruciferae, in the family Brassicaceae. Its botanical name is Brassica oleracea var. italica, and is a cultivar of the same species as cauliflower. Broccoli is similar to cauliflower in its upright structure, leaf habit and head formation.
Broccoli is the term used to describe the annual green sprouting form of B.
oleracea var. italica in America, Japan, the Netherlands, Ausfralia and New
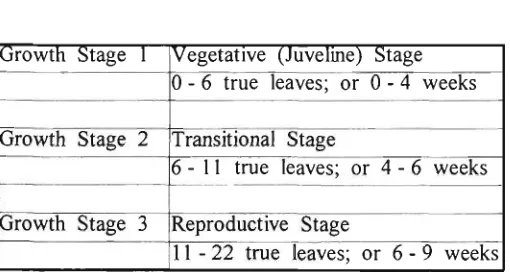
Zealand. In Britain and Italy the term calabrese is used to describe the annual sprouting form of broccoli. Three growth stages suggested for broccoli (Gauss and Taylor, 1969a) are given in Table 1.
TABLE 1: Growth Stages of Broccoli
Growth Stage 1
Growth Stage 2
Growth Stage 3
Vegetative (Juveline) Stage
0 - 6 true leaves; or 0 - 4 weeks
Transitional Stage
6-11 true leaves; or 4 - 6 weeks
Reproductive Stage
11 - 22 true leaves; or 6 - 9 weeks
10
2.2.2 Nutritional Value
Broccoli is nufritionally rich: a good source of vitamin A (155 g provides 6 8 %
daily requirement); excellent source of vitamin C (155 g provides more than twice the daily allowance); valuable amounts of iron and other minerals and is low in
calories and high in fibre.
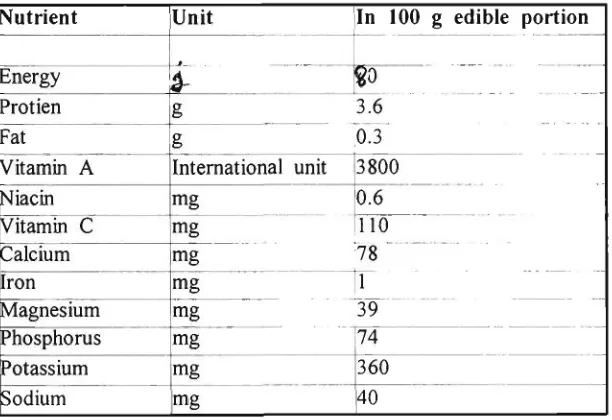
The composition of a 100 g edible portion of broccoli is given in Table 2.
TABLE 2: Nutrient Composition of Broccoli
Nutrient
Energy Protien
Fat
Vitamin A Niacin Vitamin C Calcium Iron Magnesium Phosphorus Potassium Sodium
Unit
^
g g
International unit
mg mg mg mg mg mg mg mg
In 100 g edible
?0
3.6 0T3 3800
0.6
110 78 1 39
74
portion
360 40
(Adapted from the book, World Vegetables, 1983: as cited in source: Howard et al,
1962)
2.2.3 Hollow Stem in Broccoli
Hollow stem is a physiological disorder that ranges from vertical cracking to the development of open chambers in the pith tissue of broccoli stems. It occurs
following initiation of the central inflorescence and is considered undesirable because it may reduce broccoli shelf life (Zink, 1968). The early signs of this
disorder are the development of small elliptical cracks in the inner stem tissue. As plants approach maturity these cracks may enlarge and coalesce, causing the stem to
become hollow. Besides defracting from the appearance of the head and hence overall quality of the produce, the presence of stem cavity at harvest may facilitate
pathogenic activity. In addition hollow stem may exhibit discolouration which is undesirable for export markets, especially in South - East Asia where the consumers
prefer the non - hollow, long stemmed broccoli.
Hollow stem in some cases is induced by boron (B) deficiency, which also
11
discolouration (Shattuck and Shelp, 1987). B deficiency may be a consequence of the poor aeration of the soil and low pH that occurs when soils are flooded or waterlogged.
Boron (B) was first shown to be an essential micronutrient for plant growth more than six decades ago (Warington, 1923). Since that time, an extensive body of literature concerning the effects of B on the growth and yield of plants has been published. Since B is highly mobile in the soil and easily leached, the majority of information concerns the correction of B deficiencies affecting high-yielding crops in the more humid parts of the world (Gupta 1979). In nature, B toxicity is not as widespread as B deficiency. The range between B concenfration that causes B deficiency and B toxicity symptoms is relatively narrow (Gupta et al, 1985; Keren and Bingham, 1985).
B is universally distributed in soils (Eaton and Wilcox, 1939). It is derived from certain boron-bearing rocks; sedimentary rocks contain more B than igneous rocks (Whitestone et al, 1942). However, B in rock is not very available to plants and most of the plant-available B comes from the decomposition of soil organic matter and from B adsorbed and precipitated onto the surfaces of soil particles (Russel, 1973; Bingham, 1973; Bowen, 1977). Less than 5% of the total soil B is available for crop uptake (Gupta, 1968). This explains the widespread occurence of B deficiency in many parts of the world.
Generally, soils that have developed in humid regions have low amounts of plant-available B because of leaching. Further, the plant-plant-available B that is present in such soils is located in the top 15 cm in the organic matter fraction (Miljkovic et
al, 1966; Wekhoven, 1964; Whitestone et al, 1942; Kanwar and Singh, 1961).
12
the degree of B fixation is influenced by moisture, wetting and drying, temperature and soil texture (Eaton and Wil;cox, 1939; Parks and White, 1952; Bigger and Fireman, 1960; Bingham et al, 1971; Gupta, 1968; Singh, 1964).
Although the metabolic role of B is uncertain (Pilbeam and Kirkby, 1983), the evidence generally shows that that B is important in cell division and is apparently a necessary component of cell walls (Jackson and Chapman, 1975; Cohen and Lepper, 1977; Slack and Whittington, 1964), Symptoms of plant stress caused by B deficiency and toxicity have been well documented (Gupta et al, 1985). Broccoli plants grown in B deficient conditions exhibit low growth rates and a high incidence of pith damage or hollow stem (Shattuck et al, 1986, Hipp, 1974).
Hollow stem in broccoli has also been associated with increased row spacing in the field and increasing nitrogen (N) fertiHsation (Zink, 1968; Cutcliffe, 1972). Cutcliffe and Gupta (1980) have reported that applied N increases the B concenfration in cauliflower {B. oleracea var. botrytis L), which is also affected by hollow stem. A balance must exist between B and N in Brassica crops and the addition of B alone, confrary to earlier studies, does not reduce the hollow stem incidence in broccoli (Gupta and Cutcliffe, 1972). It has been found that increasing N rate resulted in greater vegetative growth rate (Hipp, 1974). Tremblay (1989) found that nitrate - containing fertilisers increased broccoli yield by 4% but induced 13% more hollow stem. No N sources could be identified that would produce high broccoli yield without inducing high incidence of hollow stem. A seasonal effect also appears to influence the development of hollow stem in broccoli which has been observed to be higher during early summer when plant growth is usually more rapid than later in summer (Tremblay, 1989).
Different species and cultivars of vegetables respond differently to B deficiency because of differences in B requirement. In tomato genotypes known to respond differently to B supply (Brown and Ambler, 1973), physiological studies showed that B was absorbed into roots, but not franslocated upwards at a rate sufficient to support normal plant growth (Wall and Andrus, 1962). Similar differences in broccoli cultivar susceptibility to hollow stem have been reported by Cutcliffe (1975) and Shattuck et al (1986).
13
rectangularity (Westcott and Callan, 1990). In one study, maximum yield of individual heads for fresh market was obtained at a spacing of 45 x 30 cm. using single plant fransplant (Griffith and Carling, 1991). This smdy also found that row spacing also affects yield. Decreasing row spacing from 90 to 45 cm doubled the plant density and Increased average yields by 32%. Raising two plants in a fransplant plug also doubled the plant density, with an average increase in yield of
15%.
In studies of the effect of plant density on broccoli production, Salter et al (1984) observed that optimal yields of broccoli were obtained when the plants are grown in square (1:1) rather than rectangular (6:1) spatial arrangements at the same plant density. Chung (1985) found that changing from the traditional low plant density 2.8 plants m'^ to about 8 plants m'^ increased yield significantly without causing cultural or marketing problems.
Other environmental factors, such as climate and soil fertility may also play a role in hollow stem induction. Shattuck et al (1986) and Tremblay (1989) observed that the occurrence of hollow stem varies significantly between growing seasons and concluded that environmental conditions may play an important role in hollow stem formation.
14
No studies have been reported that looked at amount of water applied to broccoli crop and the correlation of this environmental factor with hollow stem occurrence.
2.3 LETTUCE: Quality and Quantity of Production
Lettuce is a pleasure food and the most important salad vegetable. It has a low nufrient density and little flavour, except that sometimes it is bitter. It is one of few horticultural food crops used exclusively as a fresh raw product. It is often minimally processed i.e. cut and / or shredded for salad mixes or harvested when immature and used in salad mixes which often contain other leafy vegetables, mainly Brassicas. Its chief merits are variety of textures and colours, a large surface volume ratio that serves admirably as a carrier of dressings of infinite variety, and a source of bulk for diet - conscious consumers. In Victoria, lettuce is available all year round and is mainly produced in the market gardens close to Melbourne with an increasing proportion of winter lettuce supplied from the Sunraysia disfrict of Victoria and from Hay, in Southern N.S.W.
2.3.1 Botany and Quality Characteristics
Lettuce {Lactuca sativa L) is native to the Mediterranean and Near East and has been in cultivation at least 2,500 years. It is closely related to common wild or prickly lettuce {L. serriola L), which is somewhat different morphologically, but is reproductively completely compatible with the cultivated forms (Ryder and Whitaker
1976).
There are five distinct types of lettuce:
Crisphead or iceberg lettuce is the main lettuce type grown and is distinguished
by firmness of head and crisp texture.
Butterhead lettuce has a soft head and the inner leaves feel oily or buttery.
Cos lettuce is distinguished by elongated head, stiff leaves and upright habit of
growth.
Leaf lettuce has loose non-head forming leaves.
Stem lettuce has leaves with an enlarged stem and no head.
The important factors in quality for consumers are: 1. appearance, including size, colour and shape 2. condition and absence of defects
15
5. nutritional value
Factors 2 and 5 will be reviewed further. Factors 1, 3 and 4 are often identified in product specifications although flavour is hard to measure.
2.3.2 Nutritional Value
Lettuce supplies relatively little nutrient value per unit weight. However, because per capita consumption is high, it is an important confributor of some dietary vitamins such as vitamins A, C, and niacin. It is also a useful soiu-ce of some mineral elements such as phosphorus, calcium, iron and magnesium.
The concenfrations of some nutrients and fiber in crisphead lettuce are given below in Table 3.
TABLE 3: Nutrient Composition of Lettuce
Nutrient Energy Protien Fat
Vitamin A Niacin Vitamin C Calcium Iron Magnesium Phosphorus
Unit
cal g g
International unit mg
mg mg mg mg mg
In 100 g edible portion
11
0.8 0.1
300
-0.3 5
13 1.5 7 25
(Adapted from the book. World Vegetables, 1983; as cited in source: Howard et al. 1962)
2.3.3 Tipburn / Head rot in Lettuce
16
Tipbum can occur even when there is an adequate supply of Ca to the roots. This is because Ca moves mainly by transpirational mass flow in xylem (Bell and Bidddulph, 1963; Clarkson, 1984). Most leaves of head forming lettuce cultivars are wholly or partly enclosed and are particularly susceptible to the disorder, as the iimer leaves are restricted in their ability to transpire and thus can contain abnormally low levels of Ca. Tipbum is usually initiated after the head is well formed and close to market maturity (Ryder, 1979).
Extremely low tissue concenfrations of Ca (0.2 to 0.3 mg g •' dry weight) are associated with areas expressing tipbum injury compared with 0.4 - 0.5 mg g "^ dry weight in healthy lettuce leaf (Barta and Tibbitts, 1991). Ca concenfrations of less than 0.4 m g g - ' dry weight in intervenal leaf areas appear to be critical for injury development and uninjured areas of tipbumed leaf have been found to contain calcium concenfrations of 0.4 - 0.5 mg g •• dry weight Some reports have suggested that tipbum development is a manifestation of a localised Ca deficiency resulting from the chelation of Ca by organic acids and other metabolites, lowering the soluble Ca fraction within the leaf (Misaghi and Grogan, 1978; Thibodeau and Minotti, 1969).
It has also been found that leaves of field - grown plants are less susceptible to this injury as compared with those grown in controlled environmental conditions. Leaves of field - grown plants may have been free from injury because leaf enlargement and demand for Ca did not exceed the quantity of Ca that was being taken up by the roots and provided to the leaf tissues. Many other growing conditions such as soil temperatures, air movement, vapour pressure deficit and nutrient levels could also lead to the differences in Ca accumulation and tipbum development in field and confrolled environments (Collier and Tibbitts, 1982). The occurrence of tipbum has been correlated with rapid growth rates (Collier and Huntington, 1983; Cox et
al, 1976). Magnesium (Mg) is negatively correlated with tipbum as the higher
concentration of Mg found in tipbumed leaves compared with the uninjured leaves (Collier and Tibbitts, 1982).
17
prevent tipbum by increasing Ca accumulation in the inner leaves, because it increased vapour pressure deficit in the air around the inner leaves, which encouraged transpiration from the leaves and consequently promoted Ca uptake from the root to inner leaves.
Many researchers have made attempts to solve the problem of tipbum in lettuce and identify the mechanism of tipbum development. Some methods include: selection of cultivars which are resistant to tipbum (Takagi et al, 1990); application of foliar sprays of Ca salts (Thibodeau and Minotti, 1969); and improvement of ion balance m nutrient solution (Ashkar and Ries, 1971; Son and Takakura, 1989). But Collier and Tibbitts (1982) indicated that a combination of causal factors are implicated in tipbum development and the above methods have not always been practical in preventing tipbum.
Tipbum occurs most frequently when lettuce grows rapidly and therefore, deceleration of growth rate during the later growing stages can be effective in reducing tipbum development. This is not a final and practical solution and it is necessary to find techniques to prevent this disorder without sacrificing a rapid growth rate.
2.3.4 Environmental Effects on Physical Characteristics
Another set of limitations to the production of lettuce suitable for export are head weight and quality. Singh and Alderfer (1966) found that head weight and quality of lettuce are decreased when a soil moisture potential greater than 100 kPa at 12.5 cm depth occurs during any period of growth. This study also found that with a higher moisture stress (700 - 900 kPa), the number of tipbumed and burst heads increased. In addition Cox (1984) found that if irrigation was withheld until eight days after fransplanting then lettuce yield was reduced up to 30%) due to reduced survival during establishment. Thus irrigation timing and scheduling are very important to get a high yield and better quality of lettuce.
18
radiation in a specific period just before hearting and by low temperature in a longer period up to and around hearting (Wurr and Fellows, 1991).
After reviewing the literature, it is clear that many of the commercially desirable features of lettuce are related to production techniques and growing environment, of which irrigation is a key element.
2.4 GENERAL HYPOTHESES FOR FIELD TRIALS OF
BROCCOLI AND LETTUCE
After reviewing the literature and observing existing cultivation practices and problems in East Gippsland, the following hypotheses were generated:
* Too much water leads to waterlogging and hence reduced Ca and B uptake in plants.
* Deficit water dries out the soil during the eight day irrigation cycle which also reduces mineral uptake and limits growth.
19
3. MATERIALS AND METHODS
3.1 FIELD TRIALS: Year 1 (1993/1994)
Field trials were carried out on grower's properties at Lindenow, in East Gippsland, Victoria, over the period October - May 1993/94 for broccoli and lettuce. Rainfall data for the duration of each trial was obtained for the nearby Baimsdale airport (25 km from frial plots) from the Victoria state Bureau of Meteorology.
3.1.1 BROCCOLI
Nine sites (Table 4) on three different grower's properties were chosen to study the effects of current irrigation practices on the occurrence of hollow stem in broccoli. Three growing seasons studied at each site were spring (frial 1), summer (trial 2) and autumn (frial 3). Transplants of B. oleracea cultivar Marathon were grown in a nursery for all sites.
Marathon is the cultivar, most favoured by the growers but as it is more susceptible to hollow stem in summer, they grow Greenbelt over summer months. To study and compare the effect of different seasons on hollow stem occurrence, the same cultivar Marathon has been used throughout the 1993/94 frials.
20
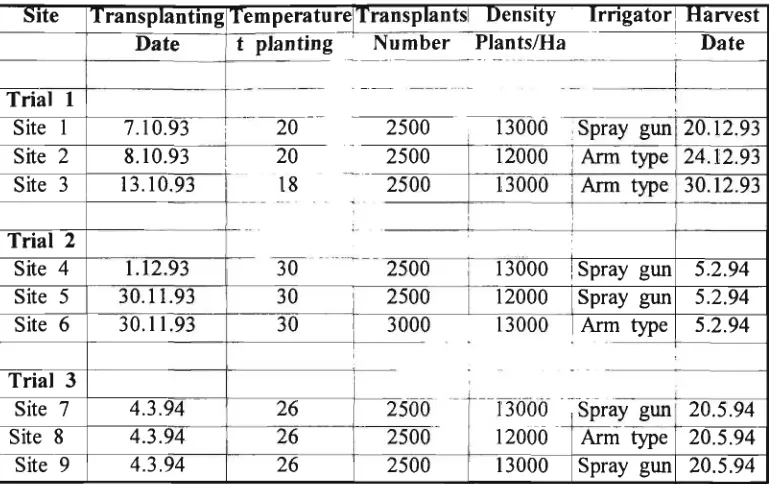
TABLE 4: Broccoli Year 1 (1993/94) Trials 1, 2 and 3.
^ke Trial 1 Site 1 Site 2 Site 3 Trial 2 Site 4 Site 5 Site 6 Trial 3 Site 7 Site 8 Site 9 Transplanting Date 7.10.93 8.10.93 13.10.93 1.12.93 30.11.93 30.11.93 4.3.94 4.3.94 4.3.94 Temperature t planting 20 20 18 30 30 30 26 26 26 Transplants Number 2500 2500 2500 2500 2500 3000 2500 2500 2500
Density Irrigator Harvest
Plants/Ha Date
i 13000 Spray gun 12000 Arm type 13000 Arm type
!
13000 1 Spray gun 12000 13000 " DOOO 12000 13000 Spray gun Arm type 20.12.93 24.12.93 30.12.93 5.2.94 5.2.94 5.2.94 Spray gun Arm type Spray gun 20.5.94 20.5.94 20.5.94
A random sample of 15 plants was taken on the day of transplanting at each site and their fresh and dry weights were recorded. No further sampling occurred for the following four weeks, but continued every week after that until harvest.
Rainfall for frial one, i.e. at sites 1. 2 and 3, is presented in figure 1. The differences in measured rainfall are the result of different fransplanting and harvesting dates.
RAINFALL (7.10.93 - 20.12.93)
R a n f a 1 I m m 180 160 140 120 100 80 60 40 20 0 Site 1
Figure 1: Total rainfall for frial 1 sites (October-December).
21a
Plate 1
Photo 1: Spray gun irrigator and irrometer station (red top) in broccoli paddock
Photo 2: Irrigation being applied by Arm (boom) irrigator in lettuce fransplants;
21
RAINFALL (30.11.93 - 5.2.94)
160-R a n f a 1 1 m m
140 i 1 2 0 . 100 +
801
60 i 40 2
0-Figure 2: Total rainfall for trial 2 sites (December-February).
RAINFALL (4.3.94 - 20.5.94)
120
Site 7
Figure 3: Total rainfall for trial 3 sites (March-May).
The irrigators used were overhead travelling irrigators:
Spray gun irrigator, the biggest and most powerfijl in the range of Southem Cross
fravelling irrigators. Model 200 can deliver up to 4x10' L of water per week, and it is capable of covering up to 1.3x10^ m^ in one unattended mn of 600 mefres. It uses 73 KL to 160 KL of water per hour (which can be confrolled) for a run length of 600 mefres. The area covered by the gun is approximately 22 mefres on either side of the irrigator (Photo 1-Plate 1).
Arm (Boom) irrigator, is a low pressure lateral model, Upton 120, from Upton
22
Two bags (50 Kg) of "NPKS' NITROPHOSKA fertiliser per hectare was banded with fransplants at sites 1, 3, 4, 6, 7 and 9. Composition of the fertiliser is given in Table 5.
TABLE 5: 'NPKS' Nitrophoska Fertiliser used at sites 1, 3, 4, 6, 7, and 9.
Component Analysis
Nitrogen (N) as ammonium
w / w % 7
Nitrogen (N) as nitrate 5 Nitrogen (N) total
Phosphoms (P) as water soluble
12 3.9
Phosphoms (P) as citrate soluble J.3 Phosphoms (P) total
Potassium (K) chloride form Potassium (K) sulfate form Potassium (K) total
Magnesium (Mg) as magnesium sulfate Calcium (Ca) as dicalcium phosphate Sulfur (S) as sulfates
Iron (Fe) as iron oxide Copper (Cu) as copper oxide Zinc (Zn) as zinc oxide Boron (B)
Molybdenum (Mo)
5.2 7.1 7
14.1 1.2 5 4 0.16 0.0004 0.01 0.02 0..0005
23
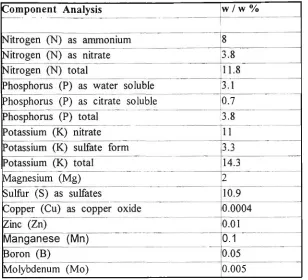
TABLE 6: 'NPKS' Pivot Blue Fertiliser Composition used at sites 2, 5 and 8
Component Analysis
Nitrogen (N) as ammonium Nitrogen (N) as nitrate Nitrogen (N) total
Phosphoms (P) as water soluble Phosphoms (P) as citrate soluble Phosphoms (P) total
Potassium (K) nitrate Potassium (K) sulfate form Potassium (K) total
Magnesium (Mg) Sulflir (S) as sulfates
Copper (Cu) as copper oxide Zinc (Zn)
Manganese (Mn) Boron (B)
Molybdenum (Mo)
w / w %
8 3.8
11.8 3.1 0.7 3.8 11 3.3 14.3 2
10.9 0.0004 0.01 0.1 0.05 0.005
No side dressing was applied at any site. Tissue analysis was performed only on the samples taken from the sprmg (trial 1) and summer (trial 2) seasons.
At site 8 an 'EnviroSCAN, soil water monitoring system, was installed by Aquafield Irrigation Systems. EnviroSCAN is a soil moisture monitor which measures the dielectric constant of soil, and consequently its water content. EnviroSCAN uses sensor arrays within PVC access tubes to display time and soil water for decision making in irrigation scheduling. Two probes (A and B) were installed in the experimental area having sensors at the depths of 10, 20, 30, 50 and 70 cm. The sensors are energised by means of a solar panel and a storage battery. The data are sampled at a frequency (every five days in this study) which can be set to vary from every 7 days to as little as every 2 minutes between readings, depending on the configuration of the probe. The data are then stored in EnviroSCAN's custom - built logging system. The logged data are downloaded to a computer and software display which enables fast display of continuous data recorded at multiple depth levels to generate soil water dynamics, which can be used as decision parameters in irrigation scheduling.
3.1.2 LETTUCE
24a
Plate 2
Photo 3: Lettuce paddock showing three rows of lettuce in each bed and
irrometer station (red top).
24
wide raised beds in three offset rows (Photo 3 - Plate 2) on 26.3.94. Four beds, 55 metres long were used for experimental measurements and sampling. A random sample of 10 plants was taken fortnightly until harvest and fresh and dry weights were recorded. Irrigation was done by Spray gun irrigator. The crop was harvested on 4.6.94. Rainfall recorded over the trial period (26.3.94 - 4.6.94) was estknated to 76 mm.
3.2 FIELD TRIALS: Year 2 (1995)
Field trials were carried out only for broccoli at sites 11 and 12 in Lindenow, East Gippsland, Victoria over the period January - April 1995. Two irrigation methods: overhead fixed sprinklers and drip irrigation were applied at site 11 and at site 12 a fravelling spray gun type irrigator was used. The irrigation methods were assessed by broccoli yield, quality and incidence of hollow stem occurrence.
3.2.1 BROCCOLI: SITE 11
Transplants of Brassica oleracea cultivar Greenbelt raised by growers were planted on 23. 1. 95. The day was mild with maximum temperature of 25^ C and a rainfall of about 19 mm was recorded two days before. The experimental plot was divided into four blocks having two different systems i.e. drip and overhead fixed sprinklers in two replicates as presented below:
1) Drip Irrigation - 1 25 metres by 7 metres
2) Drip Irrigation-2 25 mefres by 13 mefres
3) Overhead fixed Sprinklers 27 mefres by 7 mefres
4) Overhead fixed Sprinklers 45 mefres by 13 mefres
The density was 10,000 plants per hectare and two bags of 'NPKS' NITROPHOSKA fertiliser (composition given in Table 5) were incorporated at the time of fransplanting. No side dressing was used.
25a
Plate 3
Photo 5: Broccoli paddock (site 11) showing Fixed Overhead Sprinklers in function in
background and turned off (drip irrigation area) in foreground.
Photo 6: Broccoli paddock (siteII) showing dripper lines for drip irrigation and
25
a) Drip Irrigation
Typhoon light (13 mL) dripper lines (Photo 6 - Plate 3) were used in both plots. These thin - walled dripper lines are unique smgle chamber polyethylene tubes with injection - moulded emitters welded to the irmer wall of the tube. The drippers were 0.40 m apart and each dripper had six racks for better filfration. The typhoon dripper's total filtering area (0.55 mm by 0.72 mm) is eight times larger than the passage area. The flow rate was 1.75 L hr^ at 10 (m) pressure. The whole system was connected to a tensiometer, fixed at a depth of 30 cm, in the experimental plot, which operated automatically when the tensiometer reading reached 200 kPa and continued until tensiometer again reads 0..
b) Overhead fixed Sprinklers
The CROPWELL (tm) AG 15 double jet (3.5 by 2.5) sprinklers (Photo 5 - Plate 3) were installed in both plots. The distance between the risers in a row was 9 metres and each sprinkler was 0.75 metre above the ground. The distance between the two rows of sprinklers was 13 metres and the precipitation rate was 11 mm h r ' at 350 kPa pressure.
These were half-circle sprinklers and spray area was directed in order to minimise impact on drip irrigated freatments.
3.2.2 BROCCOLI: SITE 12
26
Rainfall for the 1995 trial at sites 11 and 12 is given in figure 4.
RAINFALL (23.1.95 - 2.4.95)
Site 12 Site No.
Figure 4: Total rainfall frial 1995 sites (January-March).
3.3 Soil Analysis
Soil properties play an important role in irrigation scheduling, plant grow^th and crop - water requirements. Therefore, soil samples in year 1 and 2 trials were taken to assess the properties listed below:
3.3.1 Soil Profile
Soil samples in friplicate were taken at a depth of 10 cm from each experimental block. The core used for sampling had a diameter of 10 cm and height of 10 cm. The pressure plate equipment at State Chemistry Laboratory, Werribee was used to determine the soil moisture content. The soil moisture characteristic curves of soil samples were determined at 10, 33, 100, 500, 1000 and 1500 kPa and soil profiles were drawn. From these curves soil type and amount of water available to plants in the field soil could be identified. (Loveday, 1974). According to Mclynfre (1974b) intact soil samples should be used from the range 0-300 kPa (Mclntyre 1974b), whilst ground soil material is best for the values higher than 300 kPa. But at the State Chemistry Laboratory the ground material is used even for low potential (0-300 kPa) because it is convenient, cheaper and time savmg.
Preparation of Sample: Samples were prepared by grinding air-dry aggregates (45^
27a
Plate 4
COMPLETE UNrr
PatenI Number 4068S25
COflING TOOL
Hu<l Knob
DUIQmiT*
PROBE
CARRYING CASE
H
•^rcxra Cerarwc S«nijr':
Figure a: manual).
Portable tensiometer showing its parts (adapted from instruction
27
measurement. This was achieved by flooding the pressure plate (with spooned sample in retaining rings) with water to a depth of about 1 mm, thus wetting the samples by capillary uplift. Once the upper surfaces of the samples were visibly wet then the depth of water was increased slowly until it ahnost reached the top of the samples. These were then left for approximately 16 hours to ensure complete wetting before the excess water was removed from the plate using a syringe. The plates containing samples were placed in closed chamber and measurements were made by applying desired level of pressure gradually.
The moisture retention curves relates the amount of water retained in soil to the energy state (potential) of that water (Childs, 1940).
Moisture Characteristics in Plant Studies: A complete draining moisture
characteristic covers the range of soil moisture from saturation at atmospheric pressure (zero suction) to oven dry condition. However, it is rarely necessary to obtain such a complete curve and in most plant - water - soil studies, the measurements are taken up to 1500 kPa. The draining characteristic, determined by measuring the moisture retained at a number of suctions in the range from 0-1500 kPa should cover most edaphic requirements. The most important part is probably in the range from 0 - 100 kPa for most soils (Gardner, 1971) and 0 - 3 0 0 kPa for heavy clay soils.
3.3.2 Field Soil Moisture content
Four soil samples were each taken at the depths of 30 cm and 60 cm before irrigation and every alternate day during one complete irrigation cycle in year 1 (1993/94) broccoli frials at sites 1 - 9 . Fresh and oven dried (105''C) weights were recorded. The average water content (% weight / oven dry weight) was determined and results were used to produce graphs.
3.3.3 Soil Moisture Tension
Tensiometer: Four readings were taken at 30 cm and 60 cm with portable
tensiometers (Figure a - Plate 4), before irrigation and every alternate day until the next irrigation in year 1 (1993/94) broccoli frials. Results (similar readings out of four measurements - matching with irrometers) were used to produce a drying profile of soil through irrigation cycle.
28a
Plate 5
Photo 7:
Cans placed in between the rows of broccoli paddock (site 1) to
collect irrigation water
Photo 8:
Cans mounted on sticks in broccoli paddock (site 11) to collect
28
in this experiment had a gauge in centibars. Common design consists of four basic parts (Figure a - Plate 4) including: dial gauge, null knob, probe and porous ceramic sensing tip. The gauge on the probe is calibrated in hundredths of a bar (or centibars) of vacuum and is graduated from 0 - 100. In wet soil, the vacuum gauge displays 0 - 5 centibars. As the soil dries out, the gauge reading increases, to a maximum of about 90 centibars. When the soil is rewet after irrigation or rain, the gauge reading falls.
Irrometer: Two fixed stations of irrometers (Figure b - Plate 4) were installed in each paddock at depths of 30 cm and 60 cm at each station. These were monitored several times a week and readings were recorded before irrigation, on irrigation and during the complete irrigation cycle.
The irrometer is a tensiometer brand and type which operates on the same principle as the standard tensiometer. It consists of a sealed water filled tube equipped with a special vacuum gauge and with a porous tip that is installed in the ground at desfred root zone depths. Irrometers require frequent maintenance and are often unreliable. In this series of trials, the irrometers were used as backup to the portable tensiometers.
3.4 Irrigation
Between forty and fifty 500 ml cans were placed randomly in the experimental plot and were marked with an identifying number. After the irrigation was complete, the amount of water collected in each can was measured and recorded to assess the uniformity and range of water quantity delivered during the irrigation. Two raingauges were placed in the plot randomly near two different cans. The water collected in the cans was converted into mm using the raingauge readings. The amount of water delivered for every irrigation was measured after four weeks until harvest. Twenty of these cans were randomly selected and marked in each plot and three plants around each of these cans were tagged. These plants were used for photosynthesis measurements, then harvested and assessed for yield and other quality measurements (broccoli and lettuce) at maturity.
29
3.5 Yield and Quality measurements
3.5.1 BROCCOLI
The sixty heads from the tagged plants (section 3.4) were harvested in each trial in the morning. The heads were weighed for their fresh market weights after the heads trimmed the extra leaves and the stem to a length of about 10 cm. The stem diameter (S.D.) was measured at 4.5 cm from the last branching. Head diameter (H.D.) was recorded and bud diameter (B.D.) was measured from the buds in second row.
The subjective assessment of quality of heads was made by considering several attributes which included colour, texture, size and any defects or rot etc. These characteristics are not independent of one another and are closely associated with the overall appearance and perception of produce. Maturity at harvest and hollow stem occurrence were assessed having following ratings:
Maturity at Harvest
1. 2. 3. 4. 5. 6. 7. 8. 9. 10.
Completely immature Small flower head Not fiiUy mature
Uneven and small buds Optimum
Buds unequal Loose buds Yellowing Overmature Flowering
Hollow Stem (H. S.)
1. None (0%)
2. Initiation (0% - 25%)
30
Heads were then kept in cool room at around 2*^ C for fifteen days, followed by three days at room temperature in the laboratory, and assessed for the market value (M. V.) and any breakdown (Bd) using the following ratings:
Market Value (M. V.)
1. Non - marketable
2. Unequal and loose buds 3. Buds getting yellow
4. Initiation of browning of buds 5. Optimum
Breakdown (Bd)
1. No breakdown
2. Very few buds getting brown 3. Initiation of bacterial rot 4. Rot getting worse
31
3.5.2 LETTUCE
The forty heads from the tagged plants (sec. 3.4) were harvested on 4. 6. 94 in the morning, these heads were weighed for their fresh market weights after trimming the outer loose leaves. The head diameter (H. D.) was recorded. Firmness, maturity and head rot (H. ROT) were assessed using the following ratings:
Firmness
1. Soft and loose leaves 2. Moderate
3. Firm
Maturity
1. Immature 2. Optimum 3. Overmature
Head Rot (H. ROT)
1. Bad rot with slimy head 2. Rot progressing
3. Rot initiated 4. A few burnt tips 5. Optimum
Heads were kept in the cool room at around 2^ C for fifteen days, followed by three days at room temperamre and were assessed for the market value (M. V.) and breakdown (Bd) using the following ratings.
Market Value (M. V.)
1. Non - marketable 2. Few rotten leaves
3. Browning of the mid rib of leaves 4. Leaves turning yellow
5. Optimum
Breakdown (Bd)
1. No rot