LabVIEW based Automatic Data acquisition
system for Electrical Impedance Tomography
Vidya Sarode1, Hema Patil2, Alice N. Cheeran3
1
Research Scholar, Xavier Institute of Engineering, Mumbai, India.
2&3
Electrical Department, VJTI, Mumbai, India.
Abstract— Electrical Impedance Tomography (EIT) is developing and promising imaging modality for early detection of breast cancer. An EIT system uses an array of surface electrode to apply current to an imaging object & measures the resulting voltages on the periphery. The measurement results are then input to a reconstruction algorithm to produce an image of impedance distribution of the object. In this study a LabVIEW based automatic data acquisition system is designed. In this Data Acquisition system input current injection and voltage measurement are carried out using switching. An Electrode Switching Network (ESN) consist of four 16:1 analog multiplexers that are used for swiching. The electrode switching network is controlled by Virtual Instrument (VI) developed in LabVIEW. The NI myDAQ DAQ card is used to interface PC with other hardware.
Keywords— Analog multiplexer, Electrical Impedance Tomography, Electrode switching network, LabVIEW, Phantom, State machine, Surface electrode, Virtual Instrument
I. INTRODUCTION
EIT is developingas a biomedical imaging technique. The objective of the EIT is to obtain the spatial distribution of the conductivity and/or permittivity inside the human body and interpret it as an image. The technique is applied for early detection of breast cancer since the conductivity of many malignant tumors greatly differs from that of healthy breast tissues [1]. EIT has the advantages of being a radiation-free imaging technique, inexpensive, and portable [2], [3].
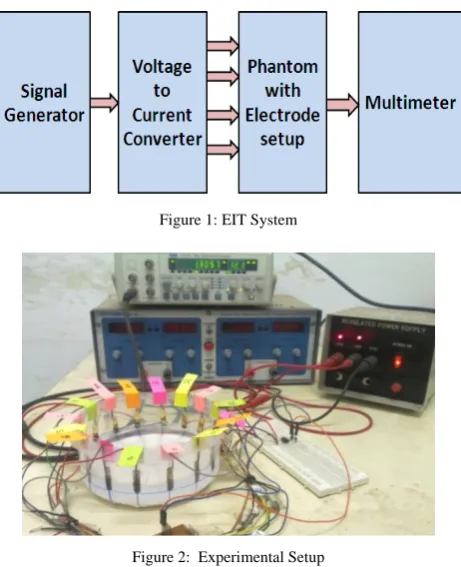
Figure1 shows the basic EIT system which consists of two parts data acquisition hardware and image acquisition software. Block diagram consist of following parts:[4]
1) A signal generator and voltage to current converter, which applies alternate constant current to pair of electrodes at constant frequency.
2) Array of sixteen electrodes arranged on inner surface of phantom with normal saline as a phantom solution.
3) Multimeter is required for voltage measurement between consecutive pair of electrodes.
4) An image reconstruction algorithm for reconstruction of image based on voltage datasets.
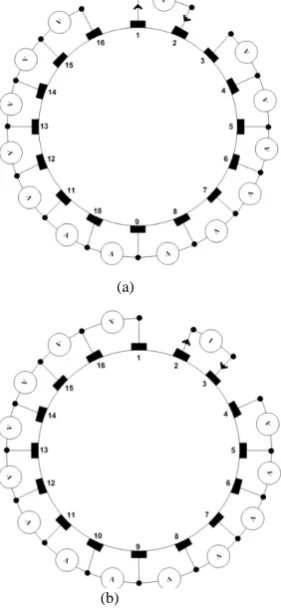
Phantom is developed with circular plastic container of14 cm diameter and 7cm height. An array of 16 electrodes is equally spaced on the inner surface of plastic container.Electrodes are of size 2.5 0.5 cm and length
dipped in solution is 1.5 cm. They are made up of silver and coated with gold to avoid corrosion effect. Wires used are of equal in length to connect phantom to circuitry. Solution used in phantom is normal saline with 0.9% of sodium chloride. The volume of normal saline used is 360 ml to ensure all electrodes immersed in solution. Electrical conductivity of normal saline is 300ms/m. Phantom with array of electrodes is shown in figure 2.
Figure 1: EIT System
Figure 2: Experimental Setup
In conventional static and differential imaging methods, current is applied at a single frequency. Impedance of biological tissues is not purely resistive but they also exhibit a reactance component, due to the cell membranes. Therefore, single-frequency EIT cannot produce static images of tissue properties [5]. Hence it is necessary to study the frequency response of an EIT system for which we need to inject constant current at variable frequency and measure voltage database at each frequency.
this system is high speed that allows real time imaging [6]-[8].
The remainder of this work is organized as follows. In Section 2, we reviewed adjacent current injection protocol used for electrode selection. Section 3 presents the basic system design and the theory of operation of system for the measurement technique described in Section 2. Measured results are shown in Section 4. This work is brought to an end by concluding remarks in Section 5.
II. MEASUREMENT TECHNIQUE
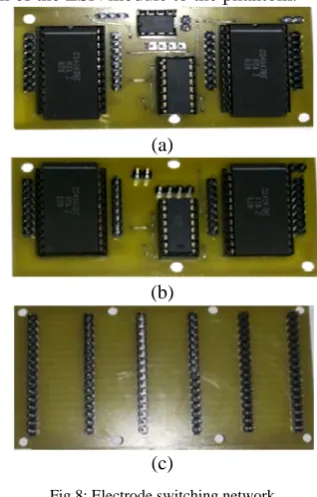
The constant current injection protocol is used for the selection of pair of electrodes used for current injection and voltage measurement. Figure 3 shows a measurement technique for adjacent current injection protocol. In this protocol initially constant current source is applied between pair of adjacent electrode and then resulting boundary potential is measured between other pairs of adjacent electrode which are non-current electrode [4], [9].
(a)
(b)
Fig 3: Adjacent current projection method
(a) Projection 1 (b) Projection 2
For projection 1 current source is applied between electrode 1 and 2 and boundary potentials are measured between electrode pair 3-4, 4-5 till 15-16. In this way total 13 readings are taken in each projection. Then current source is switched between next adjacent pair of electrodes i.e. electrode 2 & 3. In this way total 16 x 13 = 208 voltage readings are taken which forms voltage database for a single measurement.
The time required for obtaining this voltage dataset manually is large. Figure 4 shows a flow chart for measurement.
Fig 4: Measurement flow chart
III. SYSTEM DESIGN
A. System Overview
In EIT system Surface electrodes are placed around the object to be imaged. A sinusoidal current source of constant magnitude and frequency in the range 1 KHz to 100 KHz is injected through a pair of electrodes called Current electrode. These surface electrodes are selected in a particular order depending on kind of current injection protocol used. Selection of surface electrode for injection of constant current and voltage database measurement is achieved through Electrode Switching Network (ESN).
This module is developed with four analog multiplexer /De-multiplexer ICs CD4067. IC CD4067 can be used as an analog multiplexer or de-multiplexer depending on the requirement. The whole system is designed to operate under the control of the NI myDAQ DAQ card and Virtual Instrument developed in LabVIEW 8.6. Figure 5 shows an automatic data acquisition system for modern 16 electrode EIT system. Using this DAQ system variable frequency sinusoidal constant current is injected to object and resultant boundary potentials are collected for different impurities using adjacent current injection protocol.
The details of constant magnitude and variable frequency current source are given in next section.
B. Constant Current Source
Constant current injector consists of signal generator, a voltage to current converter using IC AD 711 (1mA at 5 KHz). Figure 6 shows a voltage to current converter in which load resistor R is floating (not connected to ground).
i i v ⁄R
From the above equation, it can be seen that the output current is independent of the value of load resistance. Thus the input voltage is converted into the current. The source is capable of supplying this load current.
Fig 6: Voltage to current converter with Floating load
C. Electrode Switching Network
Electrodes Switching Network requires four analog multiplexer/de-multiplexer ICs. IC CD 4067B is used for this purpose. Out of these four 16:1 multiplexers two multiplexers are used for switching current source for different current projections and the resultant surface potentials at other electrode pairs are measured using remaining two 16:1 analog multiplexers.
These four 16:1 analog multiplexers are controlled using 16 parallel digital bits which act as control inputs. As each 16:1 analog multiplexer requires four control bits, 8 simultaneous bits are required to operate current electrode multiplexers (MUX I1& MUX I2) and remaining 8 control
bits are required to operate voltage electrode multiplexers (MUX V1& MUX V2). Out of these 16 control bits 8 bits
are generated using NI USB base myDAQ card and virtual instrument developed in LabVIEW 8.6. Remaining 8 control bits are generated using Binary adder circuit as shown in figure 7. The 8-bit parallel digital data (D11D10D9D8D3D2D1D0) is generated in LabVIEW and
binary adder circuit converts it into 16-bit parallel digital data (D15D14D13D12D11D10D9D8D7D6D5D4D3D2D1D0)
D0 - D3
D4 - D7
D8 - D11
D12 - D15 NI
My DAQ Card
D0 - D3
D8 - D11 Binary
Adder 1
Binary Adder 2
Fig 7: Binary Adder Circuit
Figure 8 shows the designed PCBs for the electrode switching network (ESN). It consist of three parts, part (a) is current source switching, part (b) is voltage measurement switching circuit and part (c) is connector plane used for connection of the ESN module to the phantom.
(a)
(b)
(c)
Fig 8: Electrode switching network
(a) Current Source Switching circuit, (b) Voltage Measurement Switching circuit (c) Connector plane
D. LabVIEW DAQ System GUI
LabVIEW based Virtual Instrument is used for the generation of 8 parallel digital bits required for operation of Electrode Switching Network and measurement of the RMS value of developed surface potential through the differential analog input port. Virtual instrument is implemented in the form of the State machine with State diagram as shown in figure 9. The virtual instrument developed in LabVIEW 8.6 efficiently generates 8-bit parallel digital data which are then converted to 16-bit parallel digital data required for operating Electrode Switching Network.
Initialization I_Counter=16 Set initial current electrode position
Wait_state 1
V_Counter=13
Initial Voltage Electrode position
Wait_state 2
Acquire 1 sample Of voltage developed Next position
Of voltage electrode Decrement
V_Counter Next position
Of current electrode
Decrement I_Counter STOP
I_Counter=0
V_Counter=0
V_Counter=Non Zero
The 8-bit parallel digital data (D11D10D9D8D3D2D1D0) is
generated in LabVIEW. LabVIEW program sequentially generates sixteen sets of 4-bit parallel digital data varying from 0000 to 1111these 4-bit parallel digital data is directly fed to MUX-I1. Then for each set of D3D2D1D0 binary adder
circuit generates another set of 4-bit parallel digital data (D7D6D5D4) by adding 0001 to D3D2D1D0. Then D7D6D5D4
are fed to MUX-I2. In this way current electrode switching
is obtained for adjacent current injection protocol. Similarly LabVIEW program generates another 16 sets of 4-bit parallel digital data D11D10D9D8 which is directly fed to
MUX-V1 and for each set of D11D10D9D8 binary adder
circuit generates another set of 4-bit parallel digital data D15D14D13D12 by adding 0001 to D11D10D9D8, then these
D15D14D13D12 bits are fed to MUX-V2.
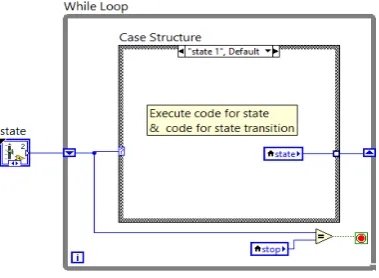
State machine in LabVIEW is implemented using While loop, Case structure and Shift register. The flow of the state diagram is implemented by the loop, while the individual states are replaced by cases in the case structure. A shift register on the while loop keeps track of the current state, which is fed into the case structure input. Figure 10 shows state machine architecture in LabVIEW 8.6 [10], [11].
Fig 10: State machine architecture in LabVIEW
IV. RESULTS
A Non conducting impurity of size 2.4x2x1.5 cm is selected and is placed near electrode 1 in the phantom as shown in figure 11
Fig 11: Container with non-conducting wooden impurity near
The voltage data base is obtained using our LabVIEW based DAQ system. Then this voltage database is fed to
Total variation Algorithm for image reconstruction. The reconstruction results give the exact location of impurity present in the phantom as shown in figure 12.
Fig 12: voltage density plot
V. CONCLUSION
In this study, LabVIEW based automatic data acquisition system for electrical Impedance tomography is designed, in which adjacent current injection protocol is used for measurement. USB based data acquisition system greatly reduces data acquisition time of the EIT system. Also the frequency of the input signal can be varied from 1 KHz to 50 KHz and sampling frequency of DAQ card can also be programmatically changed to upper limit of 200 KHz through the GUI. Then measured database of boundary potential is transferred to EDIORS for image reconstruction.
REFERENCES
[1] Gang Ye, Kim H. Lim, Rhett George, Gary Ybarra, William T. Joines & Qing H. Liu, “ A 3D EIT System for Breast Cancer Imaging”,3rd IEEE Symposium on Biomedical Imaging, pp. 1092-1095, 2006.
[2] Cheng-Ning huang, Fang-Ming Yu, and Hung-Yuan Chang, “ The Scanning Data Collection Strategy for Enhancing the Quality of Electric Impedance Tomography”, IEEE trans. Measure., Vol. 57, No. 6, pp. 1193-1198, 2008.
[3] P. Manage, V. Sarode , Dr A. Cheeran, “Electrical Impedance Tomography And Its Applications” i-COST Electronics & Communication Conference proceedings 13-15 January 2011 S.S.V.P.S‘s B.S. Deore College of Engineering & Polytechnic, Dhule, pp 2.22. 1.
[4] Vidya Sarode, Priya M. Chimurkar, Alice N. Cheeran, “Electric Impedance Tomography (EIT) based medical imaging using Finite Element Method (FEM)” International Journal of Engineering Sciences & Emerging Technologies Feb 2012 Vol. 1, Issue 2, pp 83-89 (IJESET).
[5] Arpinar V.E., Eyuboglu B.M., “Microcontroller controlled multifrequency electrical impedance tomography” proceedings of the 23rd annual International Conference of the IEEE EMBS, vol 3, pp. 2289-2291, 2001.
[6] Tushar kanti Bera, “Switching of the Surface Electrode Array in a 16-Electrode EIT system using 8-bit parallel digital data”, 2011 World Congress on Information and Communication Technologies, pp. 1288-1293, 2011.
[7] Tushar K. Bera, J Nagaraju, “Surface electrode switching of a 16-electrode wireless EIT system using RF-based digital data transmission scheme with 8 channel encoder/decoder ICs”Measurement(2011) oi:10.1016/j.measurement.2011.10.012. [8] T.K. Bera, J. Nagaraju, “Studying the resistivity imaging of chicken
tissue phantoms with different current patterns in Electrical
Graph for noncon wooden float near 1 in saline at 5 kHz1 2
3
4
5
6
7
8 9 10 11 12 13
14 15
16
Impedance Tomography (EIT)”, Measurement (2012), doi:10.1016/j.measurement.2012.01.002.
[9] Vidya Sarode, Sneha Patkar, Alice cheeran, “Comparison of Factors Affecting the Detection of Small Impurities in Breast Cancer Using EIT”,International Journal of Engineering Science and Technology June 2013, Vol. 5, Issue 6, pp. 1267-1271. [10] Tushar K. Bera, J Nagaraju, “Electrical Impedance Tomography
(EIT) System for Radiation-Free Medical Imaging Based on LabVIEW”, pp. 1-4.