Optimization of machining parameters for electrical
discharge machining using RSM
Saurabh Sen1, Harsh Pandey2, Shubham Gupta3
1&3
M-Tech Research Scholar 2
Assistant Prof. Dept.of MechianicalEngg Dr. C. V. Raman University Bilaspur
Abstract
The prediction of optimal machining conditions for required surface finish and dimensional accuracy related to electrode wear rate plays a very important role in process planning of electrical discharge machining (EDM). The present work deals with the features of electrical discharge machining of AISI 303 stainless steel. A second-order mathematical model, in terms of machining parameters, was developed for surface roughness and electrode wear rate (EWR) using response surface methodology (RSM). The experimental plan was based on the face centered, central composite design (CCD). The experimental results indicate that the proposed models could adequately describe the performance indicators within the limits of the factors that are being investigated. Finally the responses have been optimized for a given machining condition by analysis of variance (ANOVA) analysis.
Key words: EDM, Electorde wear ratio, Surface roughness, Response surface methodology, ANOVA.
1.
Introduction
Electrical Discharge Machining, commonly known as EDM is a non-conventional machining method used to remove material by a number of repetitive electrical discharges of small duration and high current density between the workpiece and the tool. EDM is an important and cost-effective method of machining extremely tough and brittle electrically conductive materials. In EDM, since there is no direct contact between the workpiece and the electrode, hence there are no mechanical forces existing between them. Any type of conductive
material can be machined using EDM irrespective of the hardness or toughness of the material.
EDM has become an important and cost-effective method of machining extremely toughand brittle electrically conductive materials. It is widely used in the process of making moulds and dies and sections of complex geometry and intricate shapes. The workpiece material selected in this experiment is AISI 303 Stainless steel taking into account its wide usage in industrial applications. In today’s world 303 stainless steel contributes to almost half of the world’s production and consumption for industrial purposes.
B.S. Reddy et al. [1] carried out a study on the effect EDM parameters over MRR, TWR, SR and hardness. Mixed factorial design of experiments and multiple regression analysis techniques had been employed to achieve the desired results. The parameters in the decreasing order of importance for; MRR: servo, duty cycle, current and voltage; TWR: current, servo and duty cycle; SR: current; HRB: servo only. M.M. Rahman et al. [2] investigated the effect of the peak current and pulse duration on the performance characteristics of the EDM. I. Puertas et al. [3] carried out results which showed that the intensity and pulse time factor were the most important in case of SR while the duty cycle factor was not significant at all. The intensity factor was again influential in case of TWR. The important factors in case of MRR were the intensity followed by duty cycle and the pulse time. S.H. Tomadi et al. [4] investigated the machining of tungsten carbide with copper tungsten as electrode. The full factorial design of experiments was used for analyzing the parameters [10-11]. In case of SR, the important factors were voltage and pulse off time while current and pulse on time were not significant.
2.
Experimentation
Conduct of experiment
The experiments were conducted using the Electric
Discharge Machine, model ELECTRONICA
-ELECTRAPLUS PS 50ZNC (die sinking type) the polarity of the electrode was set as positive while that of workpiece was negative. The dielectric fluid used was EDM oil (specific gravity-0.763).
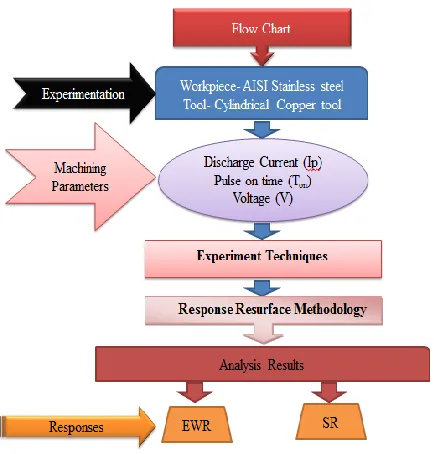
Selection of the workpiece and tool material
AISI 303 Stainless Steel is one of the most widely used materials in all industrial applications and accounts for approximately half of the world’s stainless steel production and consumption. Because of its aesthetic view in architecture, superior physical and mechanical properties, resistance against corrosion and chemicals, weldability, it has become the most preferred material over others. Many conventional and non-conventional methods for machining AISI 303 stainless steel are available.
The tool material used in Electro Discharge Machining can be of a variety of metals like copper, brass, aluminum alloys, silver alloys etc. The material used in this experiment is copper. The tool electrode is in the shape of a cylinder having a diameter of 10mm. Machining parameters and their levels are presented in Table 1.
Table 1 Machining parameters and their levels
Machining parameter
Symbol Unit Levels
Low Medium High
Discharge current (Ip) A 2 4 8
Pulse on time (Ton) µs 50 250 450
Voltage (V) V 40 45 50
3.
Results and Discussions
For each experimental run, machining was carried out for 60 min and, MRR and TWR were calculated by measuring the weight loss of workpiece (Equation 1) and tool (Equation 2), respectively.
MRR =𝑊𝑗𝑏−𝑊𝑗𝑎
𝑡×𝜌 (1)
TWR = 𝑇𝑗𝑏−𝑇𝑗𝑎
𝑡×𝜌 (2)
EWR = MRR
TWR (3)
Where Wb&Wa arethe weights of workpiece and tool before and after machining, respectively, and Tb and Ta are the weights of tool before and after machining, respectively, whereas the machining time is t. The density of AISI 303 Stainless steel material is ⍴ = 7.85 g/cm3, and density of copper electrode is ⍴= 8.92 g/cm3. EWR and SR with the machining parameters are tabulated in Table 2.
Surface Roughness is the measure of the texture of the surface. It is measured in µm. If the value is high then the surface is rough and if low then the surface is smooth. It is denoted by Ra. The values are measured using Portable style type profilometer, Talysurf (Model: Taylor Hobson, Surtronic 3+) The arithmetic mean of three readings is taken as the final value.
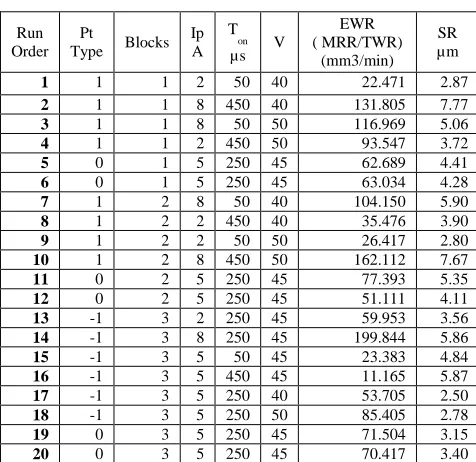
Table 2 Observation Table
Run Order
Pt
Type Blocks Ip A
T
on
µs V
EWR ( MRR/TWR)
(mm3/min) SR µm
1 1 1 2 50 40 22.471 2.87
2 1 1 8 450 40 131.805 7.77
3 1 1 8 50 50 116.969 5.06
4 1 1 2 450 50 93.547 3.72
5 0 1 5 250 45 62.689 4.41
6 0 1 5 250 45 63.034 4.28
7 1 2 8 50 40 104.150 5.90
8 1 2 2 450 40 35.476 3.90
9 1 2 2 50 50 26.417 2.80
10 1 2 8 450 50 162.112 7.67
11 0 2 5 250 45 77.393 5.35
12 0 2 5 250 45 51.111 4.11
13 -1 3 2 250 45 59.953 3.56
14 -1 3 8 250 45 199.844 5.86
15 -1 3 5 50 45 23.383 4.84
16 -1 3 5 450 45 11.165 5.87
17 -1 3 5 250 40 53.705 2.50
18 -1 3 5 250 50 85.405 2.78
19 0 3 5 250 45 71.504 3.15
Fig.1 Tool and Workpiece
Fig.2 Flow chart of Experiment
4.
Analysis and Discussion of EWR
In Fig.3 the main effect plots for EWR (electrode wear ratio). In this EWR increases as the discharge current is (Ip) increases throughout the entire range. In case of pulse on time, the EWR first slightly increases up to 250 µs and then also increasing in a similar fashion till 450 µs [5]. The EWR decrease linearly along with the increase in Voltage within the range but the magnitude of increase is not very large.
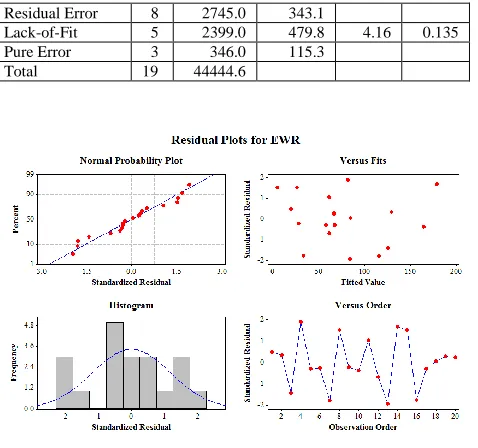
The residual plot of EWR is shown in Fig. 4. This layout is necessary to check whether the model meets the expectation of the analysis. The interpretation of the residual plots is as follows:
i. Normal probability plot indicates that the data are distributed normally. It can be seen that the standardized residue lies between -2 and 2.
ii. Versus Fits graph indicate the variance is
constant and a nonlinear relationship exists as well as no outliers exist in the data.
iii. Histogram of the data forms a desired skew
shape.
iv. Versus order graph shows that there are
systematic effects in the data.
Fig.3 Main effects plots for EWR
Table 3Aanalysis of variance on EWR
Source DF Seq SS Adj MS F P
Blocks 2 331.3 56.2 0.16 0.852
Regression 9 41368.3 4596.5 13.40 0.001
Linear 3 26607.1 8869.0 25.85 0.000
Ip (A) 1 22754.5 22754.5 66.31 0.000
Ton (µs) 1 1980.1 1980.1 5.77 0.043
Volt. (V) 1 1872.6 1872.6 5.46 0.048
Square 3 14068.8 4689.6 13.67 0.002
Ip (A)*Ip (A) 1 7557.3 11329.1 33.02 0.000 Ton (µs)*Ton
(µs) 1 6454.1 6096.6 17.77 0.003
Volt. (V)*Volt.
(V) 1 57.4 57.4 0.17 0.693
Interaction 3 692.4 230.8 0.67 0.593
Ip (A)*Ton (µs) 1 6.7 6.7 0.02 0.892
Ip (A)*Volt. (V) 1 44.6 44.6 0.13 0.728 Ton (µs)*Volt.
Residual Error 8 2745.0 343.1
Lack-of-Fit 5 2399.0 479.8 4.16 0.135
Pure Error 3 346.0 115.3
Total 19 44444.6
Fig.4 Residual plot for EWR
5.
Analysis and Discussion of SR
The various machining parameter has given the significant effect on the SR, graphical representation of SR as shown in Fig. 5. This figure indicate that pulse current (Ip) is most effected as compare to pulse duration and other factor, because a higher pulse current may cause more frequently creaking of dielectric fluid, there is more frequent melt expansion resulting is a poor surface finish Guu et al. (2003) [6-8].
The residual plot of SR is shown in Fig. 6. This layout is necessary to check whether the model meets the expectation of the analysis. The interpretation of the residual plots is shown in Fig 5. And ANOVA table is shown in Table 4.
Table 4 Analysis of variances on SR
Source DF Seq
SS
Adj MS
F P
Blocks 2 3.4857 0.7511 2.48 0.145
Regression 9 39.2670 4.3630 14.40 0.000
Linear 3 29.3948 9.7983 32.34 0.000
Ip (A) 1 23.7468 23.7468 78.38 0.000
Ton (µs) 1 5.5652 5.5652 18.37 0.003
Volt. (V) 1 0.0828 0.0828 0.27 0.615
Square 3 8.9630 2.9877 9.86 0.005
Ip (A)*Ip (A) 1 1.5729 1.1849 3.91 0.083 Ton (µs)*Ton
(µs)
1 2.0870 4.6022 15.19 0.005
Volt. (V)*Volt. (V)
1 5.3031 5.3031 17.50 0.003
Interaction 3 0.9092 0.3031 1.00 0.441 Ip (A)*Ton (µs) 1 0.8001 0.8001 2.64 0.143 Ip (A)*Volt. (V) 1 0.0595 0.0595 0.20 0.669 Ton (µs)*Volt.
(V)
1 0.0496 0.0496 0.16 0.696
Residual Error 8 2.4237 0.3030
Lack-of-Fit 5 1.6152 0.3230 1.20 0.470 Pure Error 3 0.8085 0.2695
Total 19 45.1764
Fig.5 Main effect plots for SR
Fig.6 Residual plot for SR
6.
Conclusions
theelectrode wear rate, Surface Roughness and to study the effects of the variable parameters on these characteristics. The tool material was taken as copper and the workpiece was chosen as AISI 303 stainless steel. Using the response surface methodology was
created and the experiments were performed
accordingly. The following conclusions were drawn:
1. For EWR the most significant factor was found to be peak current followed by pulse on time and the least significant was Voltage. The EWR increased nonlinearly with the increase in current.
2. For SR the most significant factor was again current followed by pulse on time and lastly the voltage. SR increased significantly with the increase in current in a nonlinear fashion. For increase in pulse on time SR increased up to 250 µs and then there was no significant increase.
References
[1]. Rao P.S., Kumar J.S, Reddy K., Reddy B., Parametric Study of Electric Discharge Machining of AISI 304 Stainless Steel, International Journal of Engineering Science and Technology, Vol. 2(8), 2010, 3535-3550.
[2]. Rahman M.M., Khan M.A.R., Kadirgama K., Noor M.M. and Bakar R.A., Experimental Investigation into Electrical Discharge Machining of Stainless Steel 304,Journal of Applied Sciences, (2005), 11: 549-554.
[3]. Puertas I., Luis C.J., Alvarez L., Analysis of the influence of EDM parameters on surface quality, MRR and EW of WC-Co, Journal of Materials Processing Technology, 153-154 (2004), 1026-1032.
[4]. Tomadi S.H., Hassan M.A., Hamedon Z., Analysis of the influence of EDM parameters on surface quality, material removal rate and electrode wear of tungsten carbide, Proceedings of the International MultiConference of Engineers and Computer Scientists, Vol II (2009).
[5]. Iqbal AKM A., Khan A.A., Optimization of process parameters on EDM milling of stainless steel AISI 304, Advance Materials Research, Vols. 264-265 (2011), pp 979-984.
[6]. Guu, Y. H., Hocheng, H., Chou, C. Y., and Deng, C. S. Effect of electrical discharge machinings on surface characteristics and machining damage of AISI D2 tool steel. Materials Science and Engineering, Vol. 35, (2003), pp 37–43.
[7]. S. Dewangan, C. K. Biswas and S. Gangopadhyay“ Multi-Response Optimization of Surface Integrity
Characteristics of EDM Process using Grey-Fuzzy Logic-based Hybrid Approach” Engineering science and technology an international journal. Vol. 18, (2015), ISSN 2215-0986, pp.361-368.
[8]. S. Dewangan, C. K. Biswas and S. Gangopadhyay “Influence of different tool materials on EDM surface integrity of AISI P20 tool steel”, International Journal of Materials and Manufacturing Process, Vol. 29, 2014, ISSN 1526-6125, pp. 1387–1394.
[9]. S. Dewangan and C.K. Biswas “Optimisation of Machining Parameters using Gray Relation Analysis for EDM with Impulse Flushing”, International Journal of Mechatronics and Manufacturing System., Vol.6 (2), 2013, ISSN 1753-1047, pp. 144-157.
[10]. S. K. Nayak, J. K. Patro, S. Dewangan, S. Gangopadhyay “Multi-objective Optimization of Machining Parameters During Dry Turning of AISI 304 Austenitic Stainless Steel Using Grey Relational Analysis” Procedia Materials Science, Vol. 6, 2014, ISSN 2211-8128, pp. 701-708.