CONSISTENT PERFORMANCE: A YARDSTICK FOR PERPETUAL SUSTENANCE
Dr. Adinath B. Kuchanur Professor
Department of Management (MBA) JSPM’s Rajarshi Shahu College of Engineering,
Tathawade, Pune-411033, Maharashtra Abstract
Financial intermediaries play a key role in the economic development as huge funds are needed to support economic activities. In India, the Public Sector Banks (PSBs) among all financial intermediaries are the integral part of the Indian financial system and they may be characterized as the resilient financial intermediaries as they stood to the testimony of the financial meltdown in the recent past. In general, the banks mobilize, lend and invest the funds. These activities are to be carried on viably and consistently since there exists a cut throat competition in the market. The main objective of the banks is to earn income by striking a healthy balance between incomes and expenses. This article analyzes the operating dimensions i.e. incomes, expenses and profits of the ten selected PSBs for the period from 2011-2015. The objective of the study is to analyze the consistency in performance of the selected banks with regard to their key operating dimensions and to award an overall rank based on the average t-Test score of all ranks secured for each operating dimension. The consistency in performance is assessed with the help of two-tailed t-Test 5-1 (n-1), 0.05 (5%) = 2.776. The analysis reveals that Allahabad Bank (out of 10 PSBs) has emerged as the most consistent overall performer in respect of all operating dimensions during the study period. The main limitation of this study is that the stakeholders may or may not consider the consistency in performance of the selected PSBs while dealing with them since these banks do not represent the whole Indian banking industry as well as financial system.
KEYWORDS: Operating Dimensions, Interest Income, Other Incomes, Interest Expense, Manpower Cost, Selling and Administrative Expenses, Miscellaneous Expenses, Net Profit, Earnings Per Share, Equity Dividend (%), Book Value Per Share.
I. Introduction
II. Review of literature
Many studies have been conducted on the performance of banks in respect of income, earnings per share dividend payout ratio, NPAs expenditure, assets, etc. As part of this study, some relevant studies are reviewed as well. Kohli and Chawla (2006) studied the profitability trends in banks on the basis of interest income, interest expenditure, non-interest income, non-interest expenditure, operating expenditure, deposits and advances and total assets. Uppal and Kaur (2007) emphasized that the cost should be properly managed in improving the profitability of banks. Gunjan (2009) revealed that there was no clear-cut evidence to the improvement in efficiency levels of the public sector banks over the years. Mehta and Diwan (2010) examined growth, profitability, efficiency and credit quality of public and private sector banks. Ashish shrivastava (2010) found that on an average, new PvtSBs have performed better than their older counterparts. PSBs have on many counts shown better performance than SBI Group. PNB out of four PSBs and ICICI out of four PvtSBs have demonstrated more consistency in performance with regard to their sources and applications of funds (Adinath B. K, 2011).
III. Research gaps
What matters most for the banks’ long-term success is not only the size of incomes, expenses and profit but the consistency in their banking operations as the case may be. A bank with high average income with inconsistency in generation of income overtime is not the desired one. Similarly, a bank with lower incidence of cost would not be a good indicator if its performance is not consistent overtime. In this context, the present study is conducted as gap filler as it not only analyzes the trends in operating dimensions of banks but also examines their consistency in performance with regard to the selected operating dimensions.
IV. Scope of the study
Indian banks are well known worldwide for their unprecedented growth as tough norms and regulations have saved them from the greed of rogue banking practices. They have been operating perpetually over the decades and have edge over the banks of advanced countries in respect of maintaining standards like Basel-I and II norms, adopting rigid lending policies and rendering hi-tech services at affordable costs. In India, banking sector is characterized as Public Sector Banks, Private Sector Banks, Co-operative Banks, etc. However, they differ in many respects of banking activities such as deposits, borrowings, loans and advances and investments. These activities lead to revenue generation, incurring on various expenses and further earning profit from their operations. Hence, the present study is an effort to analyze the ten selected banks out of 25 PSBs and to make a comparison among them in respect of each operating dimension. The present study guides the stakeholders to surmise well whether they should take into account the enduring consistent performance in bank’s operations while choosing a bank for the purpose of their banking business.
V. Objectives of the study
The following objectives have been set for this study:
i) To analyze the consistent performance in key operating dimensions of the selected PSBs and ii) To rank these banks based on the average t-Test scores.
VI. Limitation of the study
VII. Methodology used in the study
An attempt is made to analyze the key operating dimensions namely income, expense and profit items in this study and to make a comparison among the ten selected PSBs the details of which are as follows.
Table1-Name of PSBs and their Operating Dimensions
S. No Name of Bank Operating dimensions
1 Andra Bank (ADB) Income Items Expense Items 1. Interest income 1. Interest expenses 2. Other incomes 2. Employees’ cost 3. Selling and Admin expenses
4. Miscellaneous expenses Profit Items
1. Net profit
2. Earnings per share 3. Equity dividend (%) 4. Book value per share 2 Allahabad Bank (ALB)
3 Bank of Baroda (BOB) 4 Bank of India (BOI)
5 Bank of Maharashtra (BOM) 6 Canara Bank(CAN)
7 Central Bank of India (CBI) 8 Corporation Bank (CORP) 9 Dena Bank(DNB)
10 Indian Bank (INB)
It is important to note that these ten selected banks represent 40% of 25 PSBs in India. The secondary data collected from websites of respective Banks and Money Control for the last five-year period i.e. from 2011 to 2015 is used. The same is presented in the form of tables and analyzed with the help of statistical tools namely Average, Standard Deviation (SD), Coefficient of Variation (CV) and t-Test. The t-Test 5-1, 0.05 (5%) = ± 2.776 is used for testing the consistency in performance of banks with regard to each key operating dimension and for ranking each PSBs. It is important to note that the values of average and t-Test are shown in brackets against each bank wherever it is necessary. The consistency in performance deviates from one bank to others due to their structure, life span, operations, etc. These factors lead to a variation in performance of banks from time to time. The analysis enables us to understand as to which bank has demonstrated the greater consistency in its performance in respect of all operating dimensions identified for this study as the consistency in performance is a stronger indicator of a bank’s resilience to withstand the business cycles.
VIII. Hypotheses
In view of the objectives of the study, the hypotheses are designed for the present study.
HO = “Banks have demonstrated a consistent performance in respect of each operating dimension” and
HA = “Banks have not demonstrated a consistent performance in respect of each operating dimension”.
IX. Analysis and Interpretation
The analysis and interpretation is carried out in four phases. The first phase covers the analysis of all the selected operating dimensions i.e. income items, expense items and profit items while the second phase presents the hypotheses tested in the summary form and the third phase the overall rankings are awarded to each bank for their overall consistent performance in all operating dimensions.
A. Analysis of operating dimensions
1. Analysis of income items
i. Interest Income: Banks lend funds in the form of loans and advances and investments in various investment schemes as per the prevailing norms. They receive periodic interest from borrowers of funds and investment clienteles as per schedule. It is obvious that the higher the loans, advances or investments, the higher is the interest income and vice versa. The data pertaining to interest income of the selected PSBs from 2011 to 2015 is given in Table 2.
Table 2 Interest income (Rs in Crore) S.
No Year ADB ALB BOB BOI BOM CAN CBI CORP DNB INB
1 2011 8291 11015 21886 21752 5563 22940 15221 9135 5034 9361 2 2012 11339 15523 29674 28481 7214 30851 19150 13018 6794 12231 3 2013 12910 17436 35197 31909 9613 34078 21861 15334 8899 13893 4 2014 14297 18747 38940 37910 11957 39548 24428 17959 9978 15249 5 2015 16369 19716 42964 43430 12665 43750 26409 19556 10763 15853
Total 63206 82436 168660 163481 47013 171166 107067 75002 41469 66587
Average 12641 16487 33732 32696 9403 34233 21413 15000 8294 13317
S D 3055 3439 8235 8375 3031 8028 4408 4122 2355 2614
C V 24.17 20.86 24.41 25.61 32.24 23.45 20.58 27.48 28.39 19.63
t-Test (2.32) (0.94) 1.70 1.55 (3.40) 1.81 0.38 (1.15) (4.85) (2.45)
Ranking VII II V IV IX VI I III X VIII
Table 2 presents that CAN has earned the highest average interest income whereas DNB has generated the lowest average interest income.
HO = “Banks have demonstrated a consistent performance in earning interest income”
Table 2 presents that there is a consistent performance in interest income earned by CBI, ALB, CORP, BOI, BOB, CAN, ADB and INB as their t-Test values < ± 2.776 and rejected in the case of remaining banks.
ii. Other incomes: Banks also render various other services and thereby generate other incomes. A bank having variety of attractive services, network of operations, a strong customer base, etc is believed to earn higher other incomes. The other incomes of the selected PSBs are presented in Table 3.
Table 3 Other incomes (Rs in Crore)
S. No Year ADB ALB BOB BOI BOM CAN CBI CORP DNB INB
1 2011 897 1370 2809 2642 531 2811 1265 1256 534 1182 2 2012 860 1299 3422 3321 641 2928 1395 1493 582 1232 3 2013 1047 1477 3631 3766 912 3153 1667 1608 655 1288 4 2014 1333 2166 4463 4292 894 3933 1923 1648 917 1372 5 2015 1500 1996 4402 4233 1006 4550 1894 1482 721 1363
Total 5637 8308 18727 18254 3984 17375 8144 7487 3410 6437
Average 1127 1662 3745 3651 797 3475 1629 1497 682 1287
S D 279 393 696 687 201 743 294 153 149 82
C V 24.77 23.63 18.59 18.83 25.23 21.39 18.03 10.20 21.91 6.39
t-Test (2.96) (0.75) 2.57 2.47 (5.76) 2.05 (1.11) (3.00) (8.52) (8.12)
Ranking VI I V IV VIII III II VII X IX
Table 3 portrays that BOB has generated the highest average other incomes but DNB has the lowest average other incomes.
HO = “Banks have demonstrated a consistent performance in earning other incomes”
2. Analysis of expense items
i. Interest expense: Banks pay interest periodically to depositors and lenders of funds. The quantum of interest expense depends on the size of deposits mobilized and funds borrowed. A bank which has accepted more deposits and borrowed hefty funds will have to incur a huge interest expense. Thus, interest expense is a major item of expenses for banks. The data of interest expense of 10 PSBs is presented in Table 4.
Table 4 Interest expense (Rs in Crore)
S. No Year ADB ALB BOB BOI BOM CAN CBI CORP DNB INB
1 2011 5070 6992 13084 13941 3595 15241 9865 6196 3270 5325 2 2012 7579 10361 19357 20167 4697 23161 13981 9871 4693 7813 3 2013 9153 12569 23881 22885 6580 26199 16123 11908 6516 9368 4 2014 10560 13435 26974 27080 8448 30603 17933 14175 7473 10889 5 2015 11831 13538 29776 32086 8790 34086 19162 15486 8316 11392
Total 44193 56896 113072 116159 32110 129291 77064 57636 30269 44787
Average 8839 11379 22614 23232 6422 25858 15413 11527 6054 8957
S D 2636 2765 6583 6875 2275 7252 3665 3674 2058 2466
C V 29.83 24.30 29.11 29.59 35.43 28.04 23.78 31.87 34.00 27.53
t-Test (1.97) (0.96) 1.30 1.34 (3.34) 1.63 0.38 (0.68) (3.88) (2.06)
Ranking VII III IV V IX VI I II X VIII
Analysis of interest expense reveals (Table 4) that DNB has incurred the lowest average interest expense but CAN incurred the highest average interest expense among PSBs.
HO = “Banks have demonstrated a consistent performance in paying interest expense”
Table 4 portrays that there is consistent performance in interest expended by CBI, CORP, ALB, BOB, BOI, CAN, ADB and IND as their t-Test values are < ± 2.776 and disproved in respect of remaining banks.
ii. Manpower cost: Number of employees and monetary and non-monetary benefits offered to them by banks decide the quantum of manpower cost. The manpower cost is another major expense for a bank. Hence, the size of manpower cost depends on the number of employees as well as monetary and non-monetary benefits given to the employees. The information pertaining to manpower cost of the selected banks is displayed in Table 5.
Table 5 Manpower cost (Rs in Crore)
S. No Year ADB ALB BOB BOI BOM CAN CBI CORP DNB INB
1 2011 1104 1558 2917 3475 1157 2955 2964 895 688 1333 2 2012 1150 1834 2986 3069 1113 2973 2506 913 715 1484 3 2013 1289 1986 3450 3131 1188 3254 2892 990 792 1974 4 2014 1383 2245 4140 3991 1596 3672 3537 1190 1005 1927 5 2015 1698 2307 4261 4986 1633 4274 3825 1182 1117 1743
Total 6624 9930 17753 18652 6687 17128 15724 5171 4316 8460
Average 1325 1986 3551 3730 1337 3426 3145 1034 863 1692
S D 236 307 629 792 255 556 529 143 189 278
C V 17.83 15.45 17.72 21.22 19.04 16.23 16.83 13.86 21.84 16.44
t-Test (3.74) (0.73) 2.13 1.92 (3.42) 2.19 1.77 (8.19) (7.14) (1.86)
Ranking VIII I V IV VII VI II X IX III
Table 5 shows the average manpower cost incurred by each bank and it confirms that DNB has spent the lowest average manpower cost while BOI has incurred the highest average manpower cost. HO = “Banks have demonstrated a consistent performance in incurring on manpower cost”
Marketing agenda is in a bid to suit to their deposit and loan schemes. On the other hand, the administrative expenses
iii. Selling and Administrative expenses: Banks ought to market their financial products rigorously. This marketing activity is carried out through different means of marketing and the marketing strategies adopted differ from bank to banks since the banks follow their own strategies including rent of premises hired, electricity charges and maintenance of capital assets from time to time. The selling and administrative expenses of the selected PSBs are shown in Table 6.
Table 6 Selling and Administrative cost (Rs in Crore)
S. No Year ADB ALB BOB BOI BOM CAN CBI CORP DNB INB
1 2011 1639 2346 4210 4348 944 3379 2255 1818 867 2100 2 2012 2031 2687 5470 5721 1548 4204 3381 2140 1130 2330 3 2013 2145 3099 6715 6726 1924 4717 3314 2512 1395 2166 4 2014 3162 3978 7402 8174 2321 6538 5934 3566 1811 2542 5 2015 3582 5146 9589 8596 2982 6810 4481 3664 1722 2939
Total 12558 17256 33386 33565 9720 25648 19365 13701 6925 12077
Average 2512 3451 6677 6713 1944 5130 3873 2740 1385 2415
S D 821 1127 2034 1751 771 1492 1396 836 396 339
C V 32.68 32.66 30.46 26.08 39.65 29.08 36.03 30.52 28.63 14.02
t-Test (1.43) (0.21) 1.47 1.73 (2.26) 0.97 0.14 (1.13) (5.80) (3.75)
Ranking V II VI VII VIII III I IV X IX
Table 6 presents the average selling and administrative expenses incurred by each bank and it proves that DNB has spent the lowest average selling and administrative expenses but BOI has incurred the highest average selling and administrative expenses.
HO =“Banks have demonstrated a consistent performance in incurring on selling and administrative expenses”
CBI, ALB, CAN, CORP, ADB, BOB, BOI and BOM have demonstrated a consistent performance in spending on their selling and administrative expenses as their t-Test values < ± 2.776 while the remaining banks have failed to demonstrate the consistent performance.
iv. Miscellaneous expenses: Banks are required to spend money on various miscellaneous items of expenses namely travelling and dearness allowance, printing and stationery, postage and telegram, refreshments, community services, etc. Such expenses form miscellaneous expenses for banks and the amount of miscellaneous expenses vary from one bank to others. Hence, the miscellaneous expenses of the selected PSBs are portrayed in Table 7.
Table 7 Miscellaneous expense (Rs in Crore)
S. No Year ADB ALB BOB BOI BOM CAN CBI CORP DNB INB
1 2011 1705 2338 4630 5068 1644 4419 3999 1642 1073 1926 2 2012 1804 2691 5159 4941 1643 4674 3749 1784 1155 2187 3 2013 2037 2958 5947 5332 1797 5142 4232 1997 1300 2751 4 2014 2310 3457 7137 6699 2397 6081 5179 2392 1648 2832 5 2015 2739 3714 7674 8089 2526 7264 5582 2525 1839 2811
Total 10596 15159 30546 30129 10006 27580 22741 10339 7015 12507
Average 2119 3032 6109 6026 2001 5516 4548 2068 1403 2501
S D 418 559 1287 1350 427 1165 792 381 328 417
C V 19.72 18.43 21.06 22.40 21.34 21.11 17.41 18.44 23.39 16.68
t-Test (3.38) (0.90) 2.00 1.85 (3.58) 1.70 1.28 (3.84) (6.49) (2.47)
Ranking VII I V IV VIII III II IX X VI
HO = “Banks have demonstrated a consistent performance in incurring on miscellaneous expenses” It may be inferred from Table 7 that there is a consistent performance in miscellaneous expenses incurred by ALB, CBI, CAN, BOI, BOB and INB as their t-Test values < ± 2.776 and the said hypothesis is disproved for the remaining banks.
3. Analysis of profit items
i. Net profit: The main motto of every business is to earn profit from its economic activities. Similarly, banks also strive to generate profit from their activities. Thus, the profit is a prerequisite for bank’s perpetuity. In this context, a bank has to strike a healthy balance between its incomes and expenses so as to earn profits from its banking operations. The higher the income as well as the lesser the expenses, the higher would be the net profits and vice versa. The data relating to net profit of PSBs are shown Table 8.
Table 8 Net profit (Rs in Crore)
S. No Year ADB ALB BOB BOI BOM CAN CBI CORP DNB INB
1 2011 1267 1423 4242 2489 330 4026 1252 1413 612 1714 2 2012 1345 1867 5007 2678 431 3283 533 1506 803 1747 3 2013 1283 1185 4481 2749 760 2872 1015 1435 810 1581 4 2014 436 1172 4541 2729 386 2438 (1263) 562 552 1159 5 2015 638 621 3398 1709 451 2703 606 584 265 1005
Total 4969 6268 21669 12354 2357 15322 2144 5500 3042 7206
Average 994 1254 4334 2471 471 3064 429 1100 608 1441
S D 424 452 592 438 168 619 991 482 223 338
C V 42.67 36.04 13.66 17.73 35.53 20.20 231.04 43.85 36.71 23.46
t-Test (1.47) (0.80) 4.59 1.95 (6.84) 2.34 (1.20) (1.07) (4.52) (0.52)
Ranking V II IX VI X VII IV III VIII I
Table 8 shows that the average net profit of BOB is the highest whereas CBI has the lowest average net profit.
HO =“Banks have demonstrated a consistent performance in generating net profit”
INB, ALB, CORP, CBI, ADB, BOI and CAN have exhibited the consistent performance in earning net profits since their t-Test values < ± 2.776 but that is not the case with the remaining banks.
ii. Earnings per share (EPS): EPS plays a crucial role in deciding the healthy financial status of a bank. The distributable profits belong to the equity shareholders who bear the burden of any eventuality. It is essential to arrive at EPS by dividing such distributable profits by the number of outstanding equity shares. EPS is a key indicator of bank’s performance in a year since a soaring EPS enables a bank to declare higher dividend to its shareholders as well as pushes up the market price of its shares. Hence, the shareholders of banks smartly eye on the distributable profits year-on-year basis as well as they are worried of the creation of wealth for them by their bank. Hence, EPS has its own significance from the view point of shareholders. The data relating to EPS of the selected PSBs are portrayed in Table 9.
Table 9 Earnings per share (Amount in rupees)
S. No Year ADB ALB BOB BOI BOM CAN CBI CORP DNB INB
1 2011 23 30 108 46 6 91 28 95 18 39
2 2012 24 37 122 47 6 74 5 102 23 40
3 2013 23 24 106 46 11 65 8 94 23 36
4 2014 7 22 106 42 4 53 (9) 34 10 24
5 2015 11 11 15 26 4 57 4 7 5 21
Total 88 123 458 206 32 340 36 331 79 160
Average 18 25 92 41 6 68 7 66 16 32
S D 8 10 43 9 3 15 14 43 8 9
C V 45.05 39.98 47.06 21.52 42.91 22.38 186.36 65.11 51.21 27.27
Table 9 portrays that average earnings per share of BOB is the highest whereas BOM has the lowest average earnings per share.
HO =“Banks have demonstrated a consistent performance in earnings per share”
Table 9 presents that there is a consistent performance in earnings per share of BOI, INB, CORP, ALB, BOB, CAN, CBI ADB and DNB since their t- Test values < ± 2.776 and the said hypothesis is invalidated for BOM.
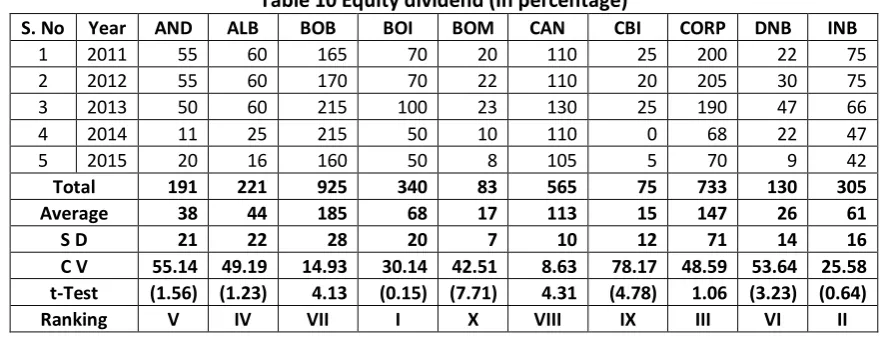
iii. Equity dividend: Out of distributable profits, some portion is retained in the business for various purposes. The remaining amount of distributable profit is distributed among the equity shareholders as equity dividend every year subject to profit earned by a bank. Equity dividend is first declared and paid to the shareholders when the profits are sufficient to do so. The information relating to equity dividend declared and paid by the selected PSBs is presented in Table 10.
Table 10 Equity dividend (In percentage)
S. No Year AND ALB BOB BOI BOM CAN CBI CORP DNB INB
1 2011 55 60 165 70 20 110 25 200 22 75 2 2012 55 60 170 70 22 110 20 205 30 75 3 2013 50 60 215 100 23 130 25 190 47 66 4 2014 11 25 215 50 10 110 0 68 22 47
5 2015 20 16 160 50 8 105 5 70 9 42
Total 191 221 925 340 83 565 75 733 130 305
Average 38 44 185 68 17 113 15 147 26 61
S D 21 22 28 20 7 10 12 71 14 16
C V 55.14 49.19 14.93 30.14 42.51 8.63 78.17 48.59 53.64 25.58
t-Test (1.56) (1.23) 4.13 (0.15) (7.71) 4.31 (4.78) 1.06 (3.23) (0.64)
Ranking V IV VII I X VIII IX III VI II
It may be inferred from Table 10 that the average equity dividend paid by BOB to its equity shareholders is the highest whereas CBI paid the lowest average equity dividend to its equity.
HO =“Banks have demonstrated a consistent performance in paying equity dividend”
BOI, INB, CORP, ALB and AND have demonstrated the consistent performance in paying equity dividend to their shareholders since their t-Test values < ± 2.776 but that is not the case with the remaining banks.
Table 11 Book value per share (Amount in rupees) S.
No Year AND ALB BOB BOI BOM CAN CBI CORP DNB INB
1 2011 116 161 537 292 61 405 131 482 104 184 2 2012 134 193 668 344 64 466 121 559 123 215 3 2013 151 210 759 401 71 516 113 626 165 243 4 2014 148 201 838 465 68 523 91 602 133 248 5 2015 167 206 180 472 63 557 94 125 133 261
Total 716 971 2983 1975 327 2466 552 2393 656 1152
Average 143 194 597 395 65 493 110 479 131 230
S D 19 20 258 78 4 59 17 205 22 31
C V 13.42 10.24 43.28 19.67 6.18 11.98 15.60 42.84 16.82 13.36
t-Test (7.33) (4.52) 1.21 1.43 (54.12) 3.54 (10.09) 0.95 (6.91) (1.74)
Ranking VIII VI II III X V IX I VII IV
Table 11 indicates that the average book value per share of BOB is the highest while the same is the lowest in the case of BOM.
HO =“Banks have demonstrated a consistent performance in creating book value per share”
Table 11 reveals that there is a consistent performance in book value per share of CORP, BOB, BOI and INB as their t-Test values <± 2.776 but, the said hypothesis is rejected in the case of other banks.
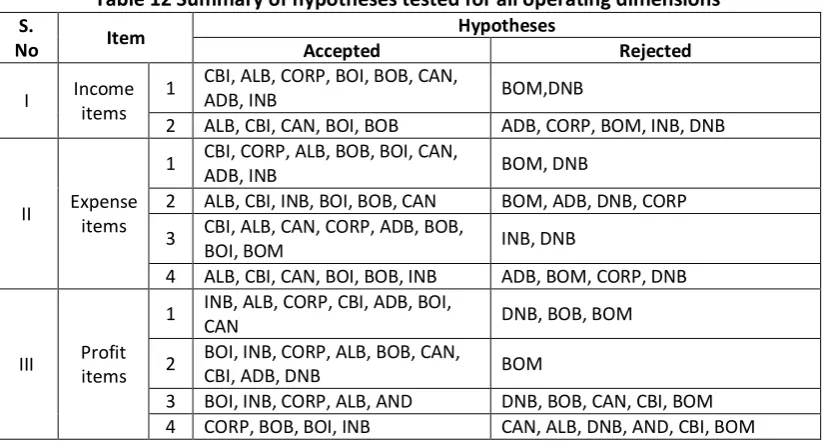
B. A summary of hypotheses tested
The hypotheses tested for all operating dimensions are summarized for their easy understanding in this section. The summary is as under
Table 12 Summary of hypotheses tested for all operating dimensions S.
No Item
Hypotheses
Accepted Rejected
I Income items
1 CBI, ALB, CORP, BOI, BOB, CAN,
ADB, INB BOM,DNB
2 ALB, CBI, CAN, BOI, BOB ADB, CORP, BOM, INB, DNB
II Expense items
1 CBI, CORP, ALB, BOB, BOI, CAN,
ADB, INB BOM, DNB
2 ALB, CBI, INB, BOI, BOB, CAN BOM, ADB, DNB, CORP
3 CBI, ALB, CAN, CORP, ADB, BOB,
BOI, BOM INB, DNB
4 ALB, CBI, CAN, BOI, BOB, INB ADB, BOM, CORP, DNB
III Profit items
1 INB, ALB, CORP, CBI, ADB, BOI,
CAN DNB, BOB, BOM
2 BOI, INB, CORP, ALB, BOB, CAN,
CBI, ADB, DNB BOM
3 BOI, INB, CORP, ALB, AND DNB, BOB, CAN, CBI, BOM 4 CORP, BOB, BOI, INB CAN, ALB, DNB, AND, CBI, BOM
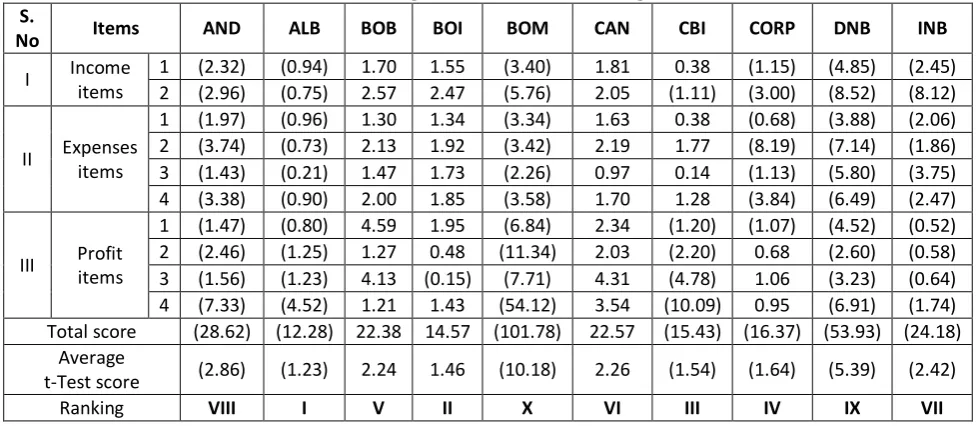
C. Overall ranking of banks based on average t-Test scores
earned, the better is the overall performance of a bank and vice versa. The details are presented in Table 13.
Table 13 Overall ranking of PSBs based on average t-Test scores S.
No Items AND ALB BOB BOI BOM CAN CBI CORP DNB INB
I Income items
1 (2.32) (0.94) 1.70 1.55 (3.40) 1.81 0.38 (1.15) (4.85) (2.45) 2 (2.96) (0.75) 2.57 2.47 (5.76) 2.05 (1.11) (3.00) (8.52) (8.12)
II Expenses items
1 (1.97) (0.96) 1.30 1.34 (3.34) 1.63 0.38 (0.68) (3.88) (2.06) 2 (3.74) (0.73) 2.13 1.92 (3.42) 2.19 1.77 (8.19) (7.14) (1.86) 3 (1.43) (0.21) 1.47 1.73 (2.26) 0.97 0.14 (1.13) (5.80) (3.75) 4 (3.38) (0.90) 2.00 1.85 (3.58) 1.70 1.28 (3.84) (6.49) (2.47)
III Profit items
1 (1.47) (0.80) 4.59 1.95 (6.84) 2.34 (1.20) (1.07) (4.52) (0.52) 2 (2.46) (1.25) 1.27 0.48 (11.34) 2.03 (2.20) 0.68 (2.60) (0.58) 3 (1.56) (1.23) 4.13 (0.15) (7.71) 4.31 (4.78) 1.06 (3.23) (0.64) 4 (7.33) (4.52) 1.21 1.43 (54.12) 3.54 (10.09) 0.95 (6.91) (1.74) Total score (28.62) (12.28) 22.38 14.57 (101.78) 22.57 (15.43) (16.37) (53.93) (24.18)
Average
t-Test score (2.86) (1.23) 2.24 1.46 (10.18) 2.26 (1.54) (1.64) (5.39) (2.42)
Ranking VIII I V II X VI III IV IX VII
Table 13 reveals that ALB has demonstrated the most consistency in its performance with regard to all operating dimensions identified for this study by securing the overall first rank among all the banks. On the other hand, BOM has exhibited the least consistency in its overall performance since it has succeeded in securing the overall tenth rank. In terms of consistency in overall performance, the selected banks have been ranked in the order from one to ten as follows: 1. ALB, 2. BOI, 3. CBI, 4. CORP, 5. BOB, 6. CAN, 7. INB, 8. AND, 9. DNB and 10. BOM.
X. Suggestions
The preceding discussion throws light on how the banks which have performed better in the selected indicators could not maintain consistency in those areas of performance. In the volatile environment, a consistency in banks’ performance holds key to their sustainability. Therefore, banks have to perform consistently by striking a happy balance between the associated incomes and costs. The banks can afford to pay the interest to depositors and lenders, dividend to shareholders and create the book value of shares provided they have earned higher income. All along, the banks also face challenges posed by business cycles that can affect their business. The study has found that the majority of selected banks have demonstrated inconsistency in performance in one or the other operating dimensions during the study period. These banks are prone to invite difficulties for themselves during the financial crisis. On the other hand, banks that have demonstrated a consistent performance in their operating dimensions can show resilience during the difficult times. Hence, a consistency in performance in operating dimensions is a key to their perpetual sustenance during crisis. Banks need to be consistent rather than zigzag in generating income and spending on costs. A steady and consistent performance helps them survive any crisis and achieve the desired goals. In addition, the efforts are to be made in maintaining a consistent growth in EPS with view to create a higher book value of shares subsequently leading to rise in market value of business. Above all, the depositors and shareholders need to deal with those banks that have ensured consistency in their performance in respect of key operating dimensions. Such banks would ensure the safety of deposits and investments during the economic turbulence in particular.
XI. Conclusion
consistent performance can ensure a perpetual sustenance and help overcome the problems. The depositors and stakeholders can ensure the safety of their deposits and investments respectively by dealing with those banks that have demonstrated a consistency in their performance.
References
1. Kothari CR, Research methodology, New Age International Publishers, New Delhi. 2005. 2. Patnaik VC, Profitability in public sector banks, Sonali Publication, New Delhi, 2005.
3. Ramakrishna G and Venu Gopal Roa K, Performance of public sector banks after reforms, Serial Publication, New Delhi, 2008.
4. Surychandra Rao. D. Banking reforms in India: An Evaluative study of performance of commercial banks, Regal Publications, New Delhi, 2008.
Journals
1. Kohli H. and Chawla AS. Profitability trends in commercial banks- a study of selected commercial banks. Indian Management Studies Journal, 10; 2006: 51-70.
2. Uppal RK and Kaur R. Comparative study of costs and profits in Indian commercial banks in the regime of emerging competition, IMS Manthan, 2007.
3. Gunjan MS. Efficiency of Indian public sector banks: an application of DEA approach. The IUP Journal of Applied Finance, 15 (1); November 2009: 52-64.
4. Mehta VH and Diwan H. Best banks’ survey 2008-09, The Financial Express, February 2010. 5. Ashish Srivastava. Commercial banking in India, 2009-10 report card. The Indian Banker, 5
(11); November 2010: 16-20.
6. Adinath B. K. (2011) Consistent growth for perpetual sustenance: a study of select banks. Indian Journal of Finance, 5 (9); September: 4-18.
Websites
1. Respective Banks