Development of a Human Robot Interaction (HRI) Trust scale. (Under the direction of Dr. Douglas Gillan.)
by
Rosemarie Elaine Yagoda
A thesis submitted to the Graduate Faculty of North Carolina State University
in partial fulfillment of the requirements for the Degree of
Master of Science
Psychology
Raleigh, North Carolina
2011
APPROVED BY:
_____________________________________________ _____________________________________________
Dr. Lori Foster Thompson Dr. Christopher Mayhorn
_____________________________________________
DEDICATION
To Dr. Lori Foster-‐Thompson for providing me with this amazing opportunity. You have changed my life.
To Dr. Doug Gillan for taking a chance on me.
To Dr. Michael Coovert for inspiring me and believing in me every step of the way.
Thank you.
BIOGRAPHY
Rosemarie E. Yagoda is a Human Factors and Ergonomics doctoral student in the Psychology Department at North Carolina State University. Ms. Yagoda received an undergraduate degree in Psychology with departmental honors at the University of South Florida. Ms. Yagoda has participated in collaborative research efforts within the advancement of human-‐robot interaction. The research presented in this document was funded by an Army Research Lab (ARL) grant through North Carolina State University.
ACKNOWLEDGEMENTS
This research was funded in part by the Army Research Laboratory Human Research & Engineering Directorate.
I would like to thank my committee for their input and guidance throughout – Dr. Lori
TABLE OF CONTENTS
LIST OF TABLES ... vi
LIST OF FIGURES ... vii
THE DEVELOPMENT OF A HUMAN ROBOT INTERACTION (HRI) TRUST SCALE ... 1
Introduction ... 1
Trust and Technology ... 3
Measuring Trust in Human-‐Robot Interaction ... 6
Study 1: Human Robot Interaction (HRI) Content Validity Assessment ... 9
Method ... 9
Results and Discussion ... 10
Study 2: Human Robot Interaction (HRI) Trust Scale Item Quality Assessment ... 18
Method ... 18
Results and Discussion ... 19
General Discussion ... 25
REFERENCES ... 28
APPENDICES ... 30
Appendix A. Study 1 Online Questionnaire Example ... 31
Appendix B. Written Scenario for Study 2 Data Collection ... 32
Appendix C. Final HRI Trust Scale ... 36
Appendix D. Interpersonal Trust Scale ... 38
LIST OF TABLES
Table 1: Summary of the Attributes That Describe the Basis of Trust ... 2
Table 2: Initial HRI Item Dimensions ... 9
Table 3: Missing Item and Alternate Label Analysis Summary ... 14
Table 4: Content Validity Ratio (CVR) HRI Attribute Table ... 16
Table 5: Final HRI Item Dimensions ... 17
Table 6: HRI Team Configuration Factor Loadings for HRI Trust Scale Analysis ... 20
Table 7: HRI Team Process Factor Loadings for HRI Trust Scale Analysis ... 21
Table 8: HRI Context Factor Loadings for HRI Trust Scale Analysis ... 22
Table 9: HRI Task Factor Loadings for HRI Trust Scale Analysis ... 23
Table 10: HRI System Factor Loadings for HRI Trust Scale Analysis ... 24
LIST OF FIGURES
Figure 1. Trust as it relates to intelligence and autonomy of technology……….……. 3
Figure 2. The role of trust as it relates to intelligence and autonomy of technology….… 5
Figure 3. Sample question from the item quality questionnaire………. 19
Figure 4. Diagram of the team configuration questionnaire………….………. 26
THE DEVELOPMENT OF A HUMAN ROBOT INTERACTION (HRI) TRUST SCALE
Introduction
Trust plays a critical role when operating a robotic system. In many cases, trust can determine the overall acceptance and usage of a system (Parasuraman & Riley, 1997). As with many concepts, there are a wide array of context dependent definitions. How the concept is utilized determines the appropriate definition. Needless to say, there are many accepted multidimensional definitions of trust. By examining the differences and common themes of these definitions, it is possible to identify critical considerations for understanding the basis of trust pertaining to human robot interaction (HRI).
Trust can be categorized in terms of expectations of outcomes where behavior, statements (verbal or written), or promises of others can be relied upon (Rotter, 1967; 1971). Another common categorization of trust is intention taking into account the state of vulnerability. For instance, “the willingness of a party to be vulnerable to the outcomes of another party based on the expectation that the other will perform a particular action important to the trustor, irrespective of the ability to monitor or control that other party” (Mayer, Davis, & Schoorman, 1995, p. 712). For trust to be an important part of any relationship, individuals must be willing to put themselves at risk or in a vulnerable position by delegating responsibility for actions to another party (Lee & See, 2004).
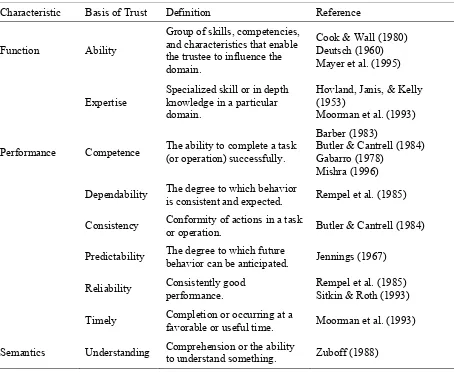
The basis of trust is the information that notifies the person about the ability of the trustee to achieve specific goals (Lee & See, 2004). Thus, the basis of trust provides the underlying attributes used to describe and utilize the concept of trust. The attributes presented in Table 1 describe the basis of trust in terms of grouping characteristics specific to HRI. The purpose of presenting these dimensions, describing the basis of trust, reflects the goal-‐oriented attribution to HRI. Using this attributional abstraction of trust moves away from relying upon a specific definition to conceptualize the meaning of trust. In turn, this approach takes into account the underlying meaning behind concept of trust.
Table 1: Summary of the Attributes That Describe the Basis of Trust
Characteristic Basis of Trust Definition Reference
Function Ability
Group of skills, competencies, and characteristics that enable the trustee to influence the domain.
Cook & Wall (1980) Deutsch (1960) Mayer et al. (1995)
Expertise
Specialized skill or in depth knowledge in a particular domain.
Hovland, Janis, & Kelly (1953)
Moorman et al. (1993)
Performance Competence The ability to complete a task (or operation) successfully.
Barber (1983)
Butler & Cantrell (1984) Gabarro (1978)
Mishra (1996)
Dependability The degree to which behavior is consistent and expected. Rempel et al. (1985)
Consistency Conformity of actions in a task
or operation. Butler & Cantrell (1984)
Predictability The degree to which future behavior can be anticipated. Jennings (1967)
Reliability Consistently good
performance.
Rempel et al. (1985) Sitkin & Roth (1993)
Timely Completion or occurring at a favorable or useful time. Moorman et al. (1993)
Semantics Understanding Comprehension or the ability
Trust and Technology
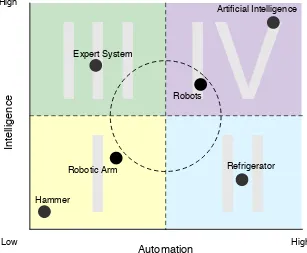
There are a myriad of ways in which humans may interact with technology. How humans interact with technology can be defined in terms of the intelligence and autonomy of the technology. As shown in Figure 1, both intelligence and autonomy levels are represented within four quadrants. These quadrants conceptualize automation and intelligence as interacting factors providing a new perspective on robotics.
Figure 1. Trust as it relates to intelligence and autonomy of technology.
Quadrant I represents low intelligence and low autonomy, an example of which is a hammer. A hammer is a simple piece of technology; it has a purpose and can be used to perform a specific task. A normal hammer is not intelligent nor is it autonomous. A person must physically use this piece of technology in order to obtain a desired outcome. A robotic arm is also included in Quadrant I. A human must physically manipulate a robotic arm in order to complete a variety of tasks. Quadrant II
High
Low High
Automation
In
te
lli
g
e
n
ce
I II
III IV
Expert SystemHammer
Robotic Arm Refrigerator
Artificial Intelligence
represents low intelligence and high autonomy, such as a refrigerator. A standard refrigerator has low intelligence in terms of functionality; however it is able to autonomously maintain a specified temperature. Once programmed to a desired temperature this piece of technology will automatically maintain itself using an internal thermometer. Quadrant III represents high intelligence and low autonomy, for instance an expert system. An expert system, such as a chef’s tool, has high intelligence in terms of recipes and instructions yet it cannot cook the meal. An expert system can provide step-‐by-‐step instructions for various tasks, however this piece of technology cannot perform the operations necessary to complete the desired task. Quadrant IV represents high intelligence and high autonomy, such as artificial intelligence. Artificial intelligence is essentially a computer system capable of autonomously performing various tasks and making decisions without human supervision. Robots are also included within Quadrant IV, however robots are less intelligent and have lower automation, comparatively speaking. Robots require more human supervision and guidance to complete a variety of tasks. It should be noted, robots are not restricted to Quadrant IV. The level of automation and the type of robotic control both have an impact on where a robot could be located within each quadrant. The dotted circle located in Figure 1 represents the entire domain of robotics.
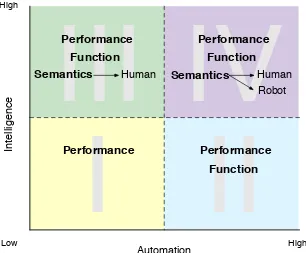
Figure 2. The role of trust as it relates to intelligence and autonomy of technology.
Quadrant I trust is affected based on performance-‐related characteristics. Take the hammer, for example, if a hammer cannot complete a task then that particular hammer may not be used again in the future. Simple, performance affects trust. Well, it is not that simple when automation and intelligence come into play. Functionality becomes increasingly more important as automation increases. Take for instance a vehicle accelerator; an accelerator has relatively low intelligence, only receiving input from the driver. An accelerator is highly automated; pressure applied from the driver determines the function or speed of the vehicle. With that said, in 2010 various Toyota vehicles had a malfunctioning accelerator leading to numerous accidents and injuries to vehicle occupants. In this example trust was violated in terms of both function (speed of vehicle) and performance (drivability) for vehicle drivers. On the other hand, when intelligence increases an understanding develops between the user and the system. Based on the increase in intelligence trust is now affected by semantics, performance and functionality. Robots, for example, vary on intelligence and automation.
High
Low High
Automation
In
te
lli
g
e
n
ce
II
I
III IV
Performance Function Performance
Performance Function Semantics
Performance Function
Human Semantics Human
Intelligence can increase or decrease depending on the robot functionality and interaction with the user; whereas automation can change based on system performance and capabilities. Thus, trust can be violated within HRI in terms of interacting with humans, functionality of the robot, and overall performance.
Measuring Trust in Human-‐Robot Interaction
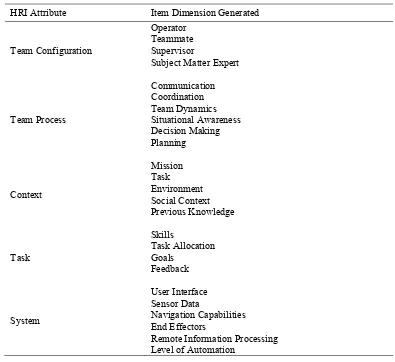
The interaction between human(s), the robot, and the corresponding level of automation is considered HRI. HRI can be further decomposed into five attributes: team configuration, team process, context, task, and system (Yagoda, 2010). In turn, this describes each element of the human-‐robot system in order to evaluate the overall configuration. These five attributes have been utilized in the development of the HRI workload measurement tool (HRI-‐WM; Yagoda, 2010). The HRI-‐WM can be tied to a specific platform and quantify perceived workload ratings associated with the human-‐ robot system that contribute an overall workload score.
There are a myriad of ways in which humans might interact with robots and often other people. An unmanned system (UMS) team configuration example was provided by Yagoda and Coovert (2009). In this example, the unmanned aerial vehicle (UAV) operator was not only interacting with the robot, but was also interacting with the mission specialist (i.e., team member) and the flight director (i.e., supervisor and subject matter expert) throughout each mission. The robot operator was responsible for operating the UAV while constantly communicating with the mission specialist and flight director to verify the appropriate data was collected. The flight director role was maintaining an overall situational awareness for the human team members, vehicle safety, and was considered the search-‐and-‐rescue task expert. Within the search-‐and-‐ rescue context of this study each team member plays a critical role in operating and interacting with the robot.
regards to both the human (e.g., operator, team member, supervisor, and subject matter expert) and the robot (e.g., functions, capabilities, and overall performance). Muir (1988) stated that individuals’ trust for machines can be affected by similar factors that are the basis of trust between individuals; for example, people trust others if they are reliable, but they lose trust when they are betrayed or let down, and the subsequent redevelopment of trust takes time. In addition, the robot can potentially interact with people, other than the operator, resulting in different trust-‐related issues. That is to say, the operator may not trust their team member to effectively and efficiently interact with the robot. Problems may also occur in situations where there is a lack of information from the robot to the operator to make accurate judgments. For instance, navigation operations can be challenged when trying to locate an objective and the information provided from the robot is not sufficient. This can make the task highly difficult for the operator and team members. Overall, trust in HRI can be described in terms of people interacting with other people and robot(s) at various levels of autonomy. In the future, one issue that may arise when assessing trust in HRI is the generalizability of the trust to various team configurations (i.e., one person or team controlling one or multiple robots).
Currently, there are no methods employed to assess trust specifically within HRI. Trust seems to be only measured in terms of automation then arbitrarily applied to the realm of HRI. Trust in an automated system is assessed using the following measures, as outlined in the Langan-‐Fox, Sankey, and Canty (2009): Human Computer Trust Rating Scale (Kauppinen, Brian, & Moore, 2002) and the SHAPE Automation Trust Index (SATI; Goillau, Kelly, Boardman, & Jeannot, 2003). Human Computer Trust Rating Scale measures trust in terms of five underlying constructs within air traffic control (ATC): understandability, technical competence, perceived reliability, faith, and personal attachment. The SATI was developed to address trust in ATC computer assistance tools and other forms of automation support.
current studies was to develop a HRI dispositional trust scale inventory. Prior to the two studies conducted, preliminary HRI items were generated based on five HRI attributes (Yagoda, 2010): team configuration, team process, context, task, and system. These items were developed based on a review of previous research within HRI and automation. The intention while generating these items was to be representative of the different facets involved with operating robots while remaining generalizable across UMS platforms and levels of automation. Table 2 provides a complete listing of the initial HRI items generated within each HRI attribute.
Study 1 conducts an exploratory content validity assessment of the preliminary item dimensions generated using a select group of HRI subject matter experts (SMEs). Study 2 assesses the quality of each trust scale item derived from the HRI item dimensions found in Study 1. The results were then compiled to generate the HRI dispositional trust scale inventory.
Table 2: Initial HRI Item Dimensions
HRI Attribute Item Dimension Generated
Team Configuration
Operator Teammate Supervisor
Subject Matter Expert
Team Process
Communication Coordination Team Dynamics Situational Awareness Decision Making Planning
Context
Mission Task Environment Social Context Previous Knowledge
Task
Skills
Task Allocation Goals
Feedback
System
User Interface Sensor Data
Navigation Capabilities End Effectors
Remote Information Processing Level of Automation
Study 1: Human Robot Interaction (HRI) Content Validity Assessment
This study involved HRI subject matter experts (SMEs) assessing each HRI item dimension listed in Table 2. Based on the SME feedback, a final list of HRI dimensions was compiled to generate the HRI trust scale (Table 5).
Method
at least 5 years professional experience within the field of HRI. All gave their informed consent to participate and were not monetarily compensated for their efforts.
Materials. An online questionnaire was generated to assess each item listed in Table 2. Each item dimension was first rated on a 5-‐point Likert scale (1 = “Not essential, should be deleted,” 2 = “Useful, but not essential,” 3 = “Useful,” 4 = “Very useful,” 5 = “Essential”). This portion of the questionnaire was used to determine the appropriateness of each item dimension within HRI domain. The rating scale was derived from a 3-‐point Likert scale (1 = “Not necessary,” 2 = “Useful, but not essential,” and 3= “Essential”) developed by Lawshe (1975). Next, each item label was examined. The items were to be ordered into 1 of 3 categories: “Change item Label,” “Keep item label,” or “Delete item.” Alternate label fields were provided, if necessary. Any items missing from Table 2 were identified next by the SME. Lastly, each HRI attribute was rated for overall importance within HRI. The SMEs were instructed to use their expertise within the domain to answer each question throughout the questionnaire. Comment fields were also provided throughout the questionnaire. An example of the questionnaire is provided in Appendix A.
Procedure. Twenty SME were selected to participate in the study based on published contributions while having at least 5 years professional experience within the field of HRI. The SMEs were contacted via email to participate in the study. Of the twenty SMEs selected, eleven participated in the study. The SMEs that participated in the study were emailed a URL link to complete the online questionnaire. All SMEs received the same questionnaire and were able to complete the questionnaire at their leisure.
Results and Discussion
of the results. Following, the more quantitative item dimension content validity assessment is present.
Team Configuration
Missing Items and Alternative Labels. No missing items were identified. 6 out of 11 SMEs mentioned that items should be explained better, mainly in terms of teammate and supervisor. For teammate, it was recommended to identify if the teammate is a human or a robot. The supervisor’s role should be explained to avoid confusion, if necessary. The low CVR rating for SME could be due to the fact the SME is not always part of a human-‐robot team. An overall solution proposed by one SME was to add a “N/A” button for each item.
Attribute-‐item Correlations. Results show a correlation between teammate and supervisor (r = .79, p = .004). A possible explanation of this finding is a person holding multiple roles on a team. This concludes that multiple roles should be taken into consideration while administering the HRI trust scale. This finding is consistent with the SME comments regarding role explanations within the team configuration.
Team Process
Missing Items and Alternative Labels. The following items were identified as missing by two SMEs: backup (i.e., functional replacement), leadership. It was also recommended by two SMEs to expand “planning” to also include “replanning.”
of communication. It is also interesting to examine some of the items that were not correlated; these could be referred to as independent actions (i.e., actions that could also be completed at an individual level) communication and decision-‐making (r = .42, p = .200) and planning (r = .52, p = .104). Both decision-‐making and planning could be performed at an individual level before or after the team is involved.
Context
Missing Items and Alternative Labels. No missing items were identified. The following modifications were suggested: one SME suggested changing “mission” to “operation” to avoid implying a military tone; for clarity three SMEs suggested changing “environment” to “physical environment,” change “social context” to “social environment” to avoid confusion since the item seemed to imply “social impact” to two SMEs, which was not the intention of the item; and two SMEs suggested “previous knowledge” should be broken down into a total of four categories – task, (human) team members, physical environment, and overall system.
Attribute-‐item Correlations. Results show correlations between social context and task (r = .64, p = .033) and previous knowledge (r = .76, p = .007). This finding concurs with the SME comments regarding the various underlying meanings for “social context” resulting in confusion about the item intent.
Task
Attribute-‐item Correlations. Results show correlations between goals and skills (r = .61, p = .048) and task allocation (r = .68, p = .021). This finding is consistent with alternate label suggestions made by the SMEs to provide more understandable labels for each correlated item.
System
Missing Items and Alternative Labels. A total of four SMEs identified the following items as missing: signal/bandwidth, and type of control. It was mentioned by two SMEs that some items should be explained better and that a “N/A” button should be provided for each item. Considering that 8 of the 13 SME comments mainly stemmed from discrepancies amongst item definitions, an explanation of each item would clarify the term usage, if necessary.
Attribute-‐item Correlations. Results show correlations between level of automation and user interface (r = .79, p = .004), navigation capabilities (r = .73, p = .010), and remote information processing (r = .66, p = .027); sensor data and end effectors (r = .86, p = .002); navigation capabilities and remote information processing (r = .76, p = .003). Similar to the team process attribute analysis, these results are mainly due to the dependency of the items upon one another.
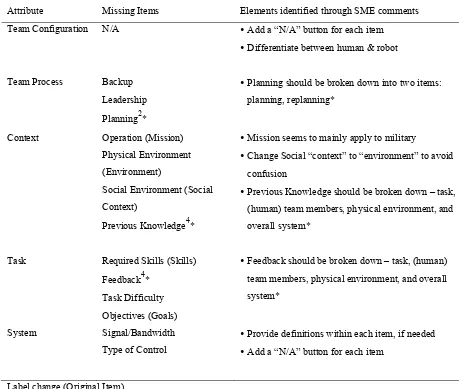
Table 3: Missing Item and Alternate Label Analysis Summary
Attribute Missing Items Elements identified through SME comments
Team Configuration N/A •Add a “N/A” button for each item
•Differentiate between human & robot
Team Process Backup Leadership Planning2*
•Planning should be broken down into two items: planning, replanning*
Context Operation (Mission)
Physical Environment (Environment)
Social Environment (Social Context)
Previous Knowledge4*
•Mission seems to mainly apply to military
•Change Social “context” to “environment” to avoid confusion
•Previous Knowledge should be broken down – task, (human) team members, physical environment, and overall system*
Task Required Skills (Skills)
Feedback4* Task Difficulty Objectives (Goals)
•Feedback should be broken down – task, (human) team members, physical environment, and overall system*
System Signal/Bandwidth
Type of Control
•Provide definitions within each item, if needed •Add a “N/A” button for each item
Label change (Original Item)
*Indicates the original item divided into sub items
Content Validity Assessment
content validity ratio: CVR = (ne -‐ N/2)/(N/2). CVR= content validity ratio, ne= number
of SME panelists indicating "essential", N= total number of SME panelists.
The CVR equation was originally derived using a 3-‐point Likert scale, for the purposes of this study (5-‐point Likert scale) two CVR equations were used: CVR = (ne -‐
N/4)/(N/4) and CVR = (ne -‐ N/3)/(N/3). The first modified CVR equation was used
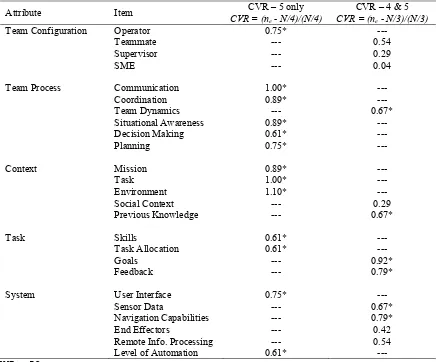
when SMEs rated an item “Essential” on the 5-‐point Likert scale; whereas the second CVR equation was used when an item was rated either “Essential” or “Very Useful.” The formulas yield values ranging from +1 to -‐1; positive values indicate that at least half the SMEs rated the item as essential. The CVR criterion level, which is based on the 11 SMEs, was set to .59 and remains consistent throughout analyses (Lawshe, 1975). This criterion value is used to ensure that the SME agreement is unlikely to be due to chance. Results are shown in Table 4. Items that did not meet the CVR criterion are as follows: teammate, supervisor, SME, social context, end effectors, and remote information processing. An alternate label and missing item analysis yielded several changes.
Table 4: Content Validity Ratio (CVR) HRI Attribute Table
Attribute Item CVR = (nCVR – 5 only
e - N/4)/(N/4)
CVR – 4 & 5 CVR = (ne - N/3)/(N/3)
Team Configuration Operator 0.75* ---
Teammate --- 0.54
Supervisor --- 0.29
SME --- 0.04
Team Process Communication 1.00* ---
Coordination 0.89* ---
Team Dynamics --- 0.67*
Situational Awareness 0.89* ---
Decision Making 0.61* ---
Planning 0.75* ---
Context Mission 0.89* ---
Task 1.00* ---
Environment 1.10* ---
Social Context --- 0.29
Previous Knowledge --- 0.67*
Task Skills 0.61* ---
Task Allocation 0.61* ---
Goals --- 0.92*
Feedback --- 0.79*
System User Interface 0.75* ---
Sensor Data --- 0.67*
Navigation Capabilities --- 0.79*
End Effectors --- 0.42
Remote Info. Processing --- 0.54
Level of Automation 0.61* ---
*CVR ≥ .59
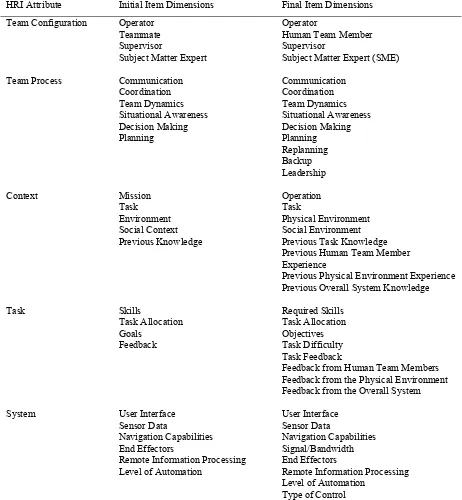
Based on the SME data collection and analysis, a comprehensive list of HRI dimensions was generated. This list is the foundation for developing a trust scale based on all the different elements encompassing HRI. Table 5 provides a complete listing of the HRI dimensions generated within each HRI attribute. Study 1 was intended to validate and expand upon the content presented in Table 2.
Table 5: Final HRI Item Dimensions
HRI Attribute Initial Item Dimensions Final Item Dimensions Team Configuration Operator
Teammate Supervisor
Subject Matter Expert
Operator
Human Team Member Supervisor
Subject Matter Expert (SME)
Team Process Communication
Coordination Team Dynamics Situational Awareness Decision Making Planning Communication Coordination Team Dynamics Situational Awareness Decision Making Planning Replanning Backup Leadership
Context Mission
Task Environment Social Context Previous Knowledge Operation Task Physical Environment Social Environment Previous Task Knowledge Previous Human Team Member Experience
Previous Physical Environment Experience Previous Overall System Knowledge
Task Skills
Task Allocation Goals Feedback Required Skills Task Allocation Objectives Task Difficulty Task Feedback
Feedback from Human Team Members Feedback from the Physical Environment Feedback from the Overall System
System User Interface
Sensor Data
Navigation Capabilities End Effectors
Remote Information Processing Level of Automation
User Interface Sensor Data
Navigation Capabilities Signal/Bandwidth End Effectors
Remote Information Processing Level of Automation
Type of Control
Study 2: Human Robot Interaction (HRI) Trust Scale Item Quality Assessment
This study involved assessing the quality of each trust scale item derived from the HRI item dimensions listed in Table 5. The results were compiled to generate a final HRI trust scale (see Appendix C).
Method
Participants. The 100 participants were recruited using a crowdsourcing web service, Amazon, Inc. Mechanical Turk (http://www.mturk.com). All participants resided in the United States and had an acceptance rate (i.e., successful completion of previous Human Intelligence Tasks or “HITs”) greater than 95%. Participants were compensated $.65 for successful completion of the study. In order for the participants to receive compensation, an experimental completion code (ECC) was generated at the end of the study for each participant to enter. The ECC was to ensure the participant completed each part of the study. The average completion time for the study was 33 minutes resulting in an effective hourly rate of $1.16.
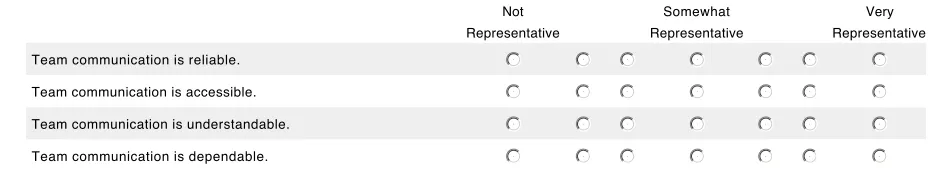
potential HRI trust scale items. The presentation order of each potential scale item was randomized for each administration.
Figure 3. Sample question from the item quality questionnaire. Each item dimension
question was required for the participant to answer (indicated with an asterisk).
Prior to completing the questionnaire, recruited participants from Mechanical Turk were directed to view a video online. The Intelligent Ground System Operational Concept video was an animated depiction of human-‐robot teams within a military context. The video was approximately 4 minutes in length and approved for public release. In addition to the video, a written scenario was provided explaining, in greater detail, the events of the video. Participants were able to view the video and read the corresponding scenario (see Appendix B) as many times as they wished prior to moving on to the questionnaire. The presentation order of the video and written scenario was not manipulated. The main goal of both the video and the written scenario was to familiarize the participant with an example of a human robot team prior to completing the item quality questionnaire.
Results and Discussion
In order to determine the final HRI trust scale items a set of exploratory factor analyses was conducted for each HRI item dimension. Assuming trust was consistent throughout, each item dimension loaded onto one factor. The factor analysis loadings
Page 2 Rate how well each answer choice represents the question statement.
1. I trust the team communication.
2. I trust the team coordination.
3. I trust the team dynamics.
The subject matter expert provides expertise. nmlkj jklmn nmlkj jklnm nmlkj kjmln nmlkj The subject matter expert is able. nmlkj jklmn nmlkj jklnm nmlkj kjmln nmlkj The subject matter expert is competent. nmlkj jklmn nmlkj jklnm nmlkj kjmln nmlkj The subject matter expert is reliable. nmlkj jklmn nmlkj jklnm nmlkj kjmln nmlkj
3. Team Process
*
Not Representative Somewhat Representative Very RepresentativeTeam communication is reliable. nmlkj jklmn nmlkj jklnm nmlkj kjmln nmlkj Team communication is accessible. nmlkj jklmn nmlkj jklnm nmlkj kjmln nmlkj Team communication is understandable. nmlkj jklmn nmlkj jklnm nmlkj kjmln nmlkj Team communication is dependable. nmlkj jklmn nmlkj jklnm nmlkj kjmln nmlkj
*
Not Representative Somewhat Representative Very RepresentativeTeam coordination is dependable. nmlkj jklmn nmlkj jklnm nmlkj kjmln nmlkj Team coordination is timely. nmlkj jklmn nmlkj jklnm nmlkj kjmln nmlkj Team coordination is accessible. nmlkj jklmn nmlkj jklnm nmlkj kjmln nmlkj Team coordination is reliable. nmlkj jklmn nmlkj jklnm nmlkj kjmln nmlkj
*
Not Representative Somewhat Representative Very RepresentativeTeam dynamics are predictable. nmlkj jklmn nmlkj jklnm nmlkj kjmln nmlkj Team dynamics are reliable. nmlkj jklmn nmlkj jklnm nmlkj kjmln nmlkj Team dynamics are dependable. nmlkj jklmn nmlkj jklnm nmlkj kjmln nmlkj Team dynamics are understandable. nmlkj jklmn nmlkj jklnm nmlkj kjmln nmlkj If there are any other statements that you think would best represent the question statement, please write them here.
If there are any other statements that you think would best represent the question statement, please write them here.
If there are any other statements that you think would best represent the question statement, please write them here.
for each HRI attribute are presented in Tables 6 – 10. The factor loadings in boldface type within each dimension represent the potential trust scale item with the highest factor loading. The highest potential trust scale item factor loading within each item dimension was used in the resulting HRI trust scale. The final HRI trust scale is presented in Appendix C.
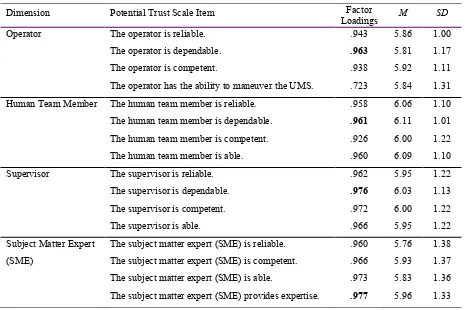
Table 6: HRI Team Configuration Factor Loadings for HRI Trust Scale Analysis
Dimension Potential Trust Scale Item Factor
Loadings M SD
Operator The operator is reliable. .943 5.86 1.00
The operator is dependable. .963 5.81 1.17
The operator is competent. .938 5.92 1.11
The operator has the ability to maneuver the UMS. .723 5.84 1.31
Human Team Member The human team member is reliable. .958 6.06 1.10
The human team member is dependable. .961 6.11 1.01
The human team member is competent. .926 6.00 1.22
The human team member is able. .960 6.09 1.10
Supervisor The supervisor is reliable. .962 5.95 1.22
The supervisor is dependable. .976 6.03 1.13
The supervisor is competent. .972 6.00 1.22
The supervisor is able. .966 5.95 1.22
Subject Matter Expert The subject matter expert (SME) is reliable. .960 5.76 1.38
(SME) The subject matter expert (SME) is competent. .966 5.93 1.37
The subject matter expert (SME) is able. .973 5.83 1.36 The subject matter expert (SME) provides expertise. .977 5.96 1.33
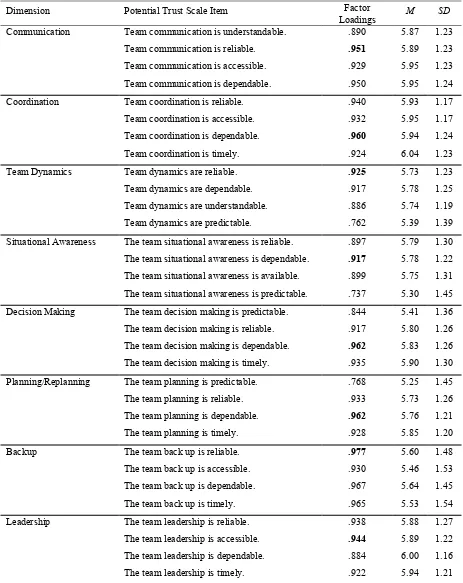
Table 7: HRI Team Process Factor Loadings for HRI Trust Scale Analysis
Dimension Potential Trust Scale Item Factor
Loadings M SD
Communication Team communication is understandable. .890 5.87 1.23
Team communication is reliable. .951 5.89 1.23
Team communication is accessible. .929 5.95 1.23
Team communication is dependable. .950 5.95 1.24
Coordination Team coordination is reliable. .940 5.93 1.17
Team coordination is accessible. .932 5.95 1.17
Team coordination is dependable. .960 5.94 1.24
Team coordination is timely. .924 6.04 1.23
Team Dynamics Team dynamics are reliable. .925 5.73 1.23
Team dynamics are dependable. .917 5.78 1.25
Team dynamics are understandable. .886 5.74 1.19
Team dynamics are predictable. .762 5.39 1.39
Situational Awareness The team situational awareness is reliable. .897 5.79 1.30 The team situational awareness is dependable. .917 5.78 1.22 The team situational awareness is available. .899 5.75 1.31 The team situational awareness is predictable. .737 5.30 1.45 Decision Making The team decision making is predictable. .844 5.41 1.36 The team decision making is reliable. .917 5.80 1.26 The team decision making is dependable. .962 5.83 1.26 The team decision making is timely. .935 5.90 1.30
Planning/Replanning The team planning is predictable. .768 5.25 1.45
The team planning is reliable. .933 5.73 1.26
The team planning is dependable. .962 5.76 1.21
The team planning is timely. .928 5.85 1.20
Backup The team back up is reliable. .977 5.60 1.48
The team back up is accessible. .930 5.46 1.53
The team back up is dependable. .967 5.64 1.45
The team back up is timely. .965 5.53 1.54
Leadership The team leadership is reliable. .938 5.88 1.27
The team leadership is accessible. .944 5.89 1.22
The team leadership is dependable. .884 6.00 1.16
Table 8: HRI Context Factor Loadings for HRI Trust Scale Analysis
Dimension Potential Trust Scale Item Factor
Loadings M SD
Operation The operation is reliable. .902 5.53 1.42
The operation is predictable. .762 5.03 1.66
The operation is understandable. .837 5.77 1.33
The operation is accessible. .881 5.59 1.39
Task The task is reliable. .914 5.41 1.48
The task is predictable. .853 5.02 1.40
The task is understandable. .902 5.52 1.44
The task is accessible. .875 5.50 1.40
Physical Environment The physical environment is reliable. .969 3.94 2.00 The physical environment is predictable. .940 4.02 1.98 The physical environment is consistent. .938 4.02 2.13 The physical environment is dependable. .931 3.90 2.04
Social Environment The social environment is reliable. .976 4.01 1.95
The social environment is predicable. .964 3.90 1.96
The social environment is consistent. .972 4.00 1.93
The social environment is dependable. .973 3.90 1.93
Previous Task My previous task knowledge is reliable. .974 4.93 1.73
Knowledge My previous task knowledge is consistent. .963 4.87 1.78
My previous task knowledge is dependable. .979 4.98 1.73 My previous task knowledge is accessible. .974 4.99 1.72 Previous Human Team My previous human team member experience is reliable. .928 5.47 1.48 Member Experience My previous human team member experience is consistent. .939 5.43 1.52 My previous human team member experience is dependable. .964 5.53 1.44 My previous human team member experience is accessible. .933 5.35 1.54 Previous Physical My previous physical environment experience is reliable. .945 4.85 1.70 Environment Experience My previous physical environment experience is consistent. .935 4.66 1.77 My previous physical environment experience is dependable. .944 4.74 1.71 My previous physical environment experience is accessible. .903 4.86 1.69 Previous System My previous system knowledge is reliable. .975 5.02 1.72
Knowledge My previous system knowledge is consistent. .962 5.00 1.66
Table 9: HRI Task Factor Loadings for HRI Trust Scale Analysis
Dimension Potential Trust Scale Item Factor
Loadings M SD Required Skills My skills required for the task are reliable. .971 5.44 1.66 My skills required for the task are consistent. .966 5.52 1.58 My skills required for the task are dependable. .986 5.16 1.69 My skills required for the task are accessible. .968 5.46 1.58
Task Allocation The task allocation is reliable. .966 5.51 1.50
The task allocation is dependable. .964 5.57 1.46
The task allocation is consistent. .955 5.60 1.51
The task allocation is timely. .951 5.59 1.47
Objectives The task objectives are reliable. .942 5.58 1.45
The task objectives are accessible. .911 5.60 1.46
The task objectives are predictable. .870 5.24 1.52
The task objectives are timely. .934 5.60 1.36
Task Difficulty The difficulty of the task is predictable. .873 4.69 1.85
The difficulty of the task is timely. .828 5.05 1.73
The difficulty of the task is reliable. .919 4.96 1.74
The difficulty of the task is consistent. .915 4.89 1.81
Feedback: Task The task feedback is reliable. .944 5.64 1.53
The task feedback is dependable. .965 5.60 1.52
The task feedback is accessible. .960 5.51 1.59
The task feedback is timely. .947 5.55 1.54
Table 10: HRI System Factor Loadings for HRI Trust Scale Analysis
Dimension Potential Trust Scale Item Factor
Loadings M SD
User Interface The user interface is reliable. .973 5.63 1.41
The user interface is dependable. .961 5.55 1.46
The user interface is understandable. .947 5.46 1.46
The user interface is accessible. .964 5.59 1.51
Sensor Data The sensor data is reliable. .955 5.69 1.43
The sensor data is dependable. .975 5.66 1.49
The sensor data is understandable. .925 5.65 1.33
The sensor data is timely. .960 5.79 1.44
Navigation Capabilities The navigation capabilities are reliable. .955 5.78 1.41 The navigation capabilities are dependable. .960 5.67 1.45 The navigation capabilities are accessible. .918 5.69 1.51 The navigation capabilities are consistent. .970 5.78 1.41
Signal/Bandwidth The signal/bandwidth is reliable. .973 5.10 1.66
The signal/bandwidth is consistent. .968 5.14 1.65 The signal/bandwidth is dependable. .977 5.14 1.59
The signal/bandwidth is timely. .901 5.03 1.69
End Effectors The end effectors are reliable. .957 5.28 1.62
The end effectors are dependable. .955 5.34 1.63
The end effectors are consistent. .951 5.31 1.69
The end effectors are accessible. .953 5.26 1.69
Remote Information The remote information processing is reliable. .959 5.45 1.52 Processing The remote information processing is dependable. .950 5.46 1.57 The remote information processing is timely. .963 5.52 1.42 The remote information processing is accessible. .917 5.26 1.69 Level of Automation The level of automation is reliable. .946 5.44 1.51 The level of automation is dependable. .911 5.34 1.60 The level of automation is consistent. .945 5.41 1.54 The level of automation is accessible. .877 5.38 1.59
Type of Control The type of control is reliable. .952 5.40 1.41
The type of control is dependable. .924 5.37 1.40
The type of control is understandable. .866 5.42 1.40
General Discussion
The aim of the present studies was to develop a human robot interaction (HRI) trust scale. In order to generate the HRI trust scale a better understanding of the different facets involved with humans interacting with robots had to be established. This involved generating a preliminary list of dimensions (see Table 2) within five HRI attributes: team configuration, team process, context, task, and system. HRI subject matter experts (SMEs) then evaluated the preliminary list of HRI dimensions. A final list of HRI dimensions was then compiled based on the results of Study 1 (see Table 5). This comprehensive list of HRI dimensions served as the basis for developing the HRI trust scale. The trust scale item quality was assessed. The item quality results were compiled in order to generate a final HRI trust scale (see Appendix C).
The HRI trust scale could also be adapted based on the team configuration, see Figure 4. The adaptive nature of the scale would address instances when a person holds multiple roles on a team. This questionnaire would modify the resulting HRI trust scale based on the team configuration item responses provided. A team configuration questionnaire should be administered prior to completing the HRI trust scale; thus, clearly defining the roles of each individual on the team. Using a team configuration questionnaire would avoid role confusion when administering the HRI trust scale. This solution is consistent with the SME findings within first study.
Figure 4. Diagram of the team configuration questionnaire.
The HRI trust scale developed is to be packaged with a validated interpersonal trust scale, developed by Rotter (1967, 1971), essentially creating a HRI trust assessment inventory. This scale is designed to measure a person’s expectations that the behavior, statements (verbal or written), or promises of others can be relied upon. The interpersonal trust scale and scoring key can be found in Appendix D. The goal of this HRI trust assessment inventory is not only to assess trust within the human robot system, but also to take into account individual differences that could account for the varying trust levels. Thus, incorporating individual differences to the HRI trust
I am the main robot operator.
Do you operate a function of the
robot?
Yes
No
Is there an additional human team
member?
Is there a team supervisor?
Is there a person specialized in a
certain area (subject matter
expert) on the team? Are you the team
supervisor?
Does the team member operate a function of the
robot? Do you have
multiple roles on the team?
Are you specialized in a
certain area (subject matter
expert) on the team?
What is your role on the
team? No
Yes
Do you operate an additional function of the
robot? Yes
Are you the team supervisor?
Are you specialized in a
certain area (subject matter
expert) on the team?
What is your additional role on the team? No
Yes
No No
measure generated will provide a comprehensive assessment of trust within human robot interaction.
Traditionally, trust in HRI has been measured only in terms of automation. Although automation is an important component of HRI, it is not the only element that should be taken into consideration, there are many. That said, the scale developed in this study is the first to measure trust within HRI taking into account the various dimensions of each HRI attribute: team configuration, team process, context, task, and system.
Future research will be geared towards the expansion of the HRI trust scale to include a human information processing subscale. The subscale generated would be used to assess at what stage of information processing (e.g., information acquisition, information analysis, action selection, action implementation) a person’s level of trust changed or varied, based on initial HRI trust scale ratings. This subscale would provide additional information regarding the underlying processes influencing trust within each HRI trust scale item. For instance, team communication. If team communication was rated unreliable, what part or process within team communication was actually unreliable? Using the information processing subscale, team communication could be further analyzed using the following statements: General team communications are reliable (information acquisition); Analyzing relevant team communications is reliable (information analysis); Deciding what to communicate to the team is reliable (action selection); Communicating to the team is reliable (action implementation). The information processing subscale example now provides insight into why low trust ratings were reported for team communication.
In addition to expanding the HRI trust scale to include the human information processing subscale, future research will also be directed towards scale validation. The HRI trust scale will be administered and compared across various trust manipulations to assess the sensitivity of the scale. Thus, future research will pertain specifically towards improving the scale to in order to provide a comprehensive assessment of trust