Efficiency and Result Analysis of 50Kw Grid
Connected PV System Using
MATLAB/SIMULINK
Nisha Sharma, Deepak Dalal
Assistant Professor, Department of Electrical Engineering in Printing, GJUS&T, Hisar, India M. Tech Student, Department of Electrical Engineering , GITAM College, Kablana, India
ABSTRACT: Grid-connected photovoltaic systems are required to introduce photovoltaic solar energy into urban areas. Various models have been developed in MATLAB/SIMULINK to investigate different aspects of PV technology. In this paper a 50Kw grid connected photovoltaic (PV) generation system Sunpower Panel installed at Elcomponics sales Pvt Ltd., NOIDA. India has been analyzed through simulation model developed on MATLAB/SIMULINK. In this panel there are total 165 modules, in which 11 are connected in series and 15 such strings in parallel with 96 cells per module. Taking the effect of irradiation and temperature into consideration, the output current, voltage and power characteristic of PV system are obtain. The results obtained are compared with the practical results. The simulated results are very close to the practical result.
KEYWORDS: Maximum power point tracking, Photovoltaic (PV) system, Module, Grid connection,
I. INTRODUCTION
As a solution for the depletion of conventional fossil fuel energy sources and serious environmental problems, focus on the photovoltaic (PV) system has been increasing round the world. Since it is clean, pollution-free, and inexhaustible, researches on the PV power generation system have received much attention. Furthermore, for the continuing decrease in PV arrays cost and the increase in their efficiency, PV power generation system could be one of comparable candidates as energy sources for mankind in near future [1]. A photovoltaic system converts sunlight into electricity. The basic device of a photovoltaic system is the photovoltaic cell. Cells may be grouped to form panels or modules. Panels can be grouped to form large photovoltaic arrays. [2].
PV module represents the fundamental power conversion unit of a PV generator system. The output characteristics of PV module depends on the solar insolation, the cell temperature and output voltage of PV module. Since PV module has nonlinear characteristics, it is necessary to model it for the design and simulation of maximum power point tracking (MPPT) for PV system applications. The mathematical PV models used in computer simulation have been built for over the past four decades [3]-[4]. To make best use of the solar PV systems the output is maximized either by mechanically tracking the sun and orienting the panel in such a direction so as to receive the maximum solar irradiance or by electrically tracking the maximum power point under changing condition of insolation and temperature. The overall performance of solar cell varies with varying Irradiance and Temperature [5]-[6].The PV application ranges from small installations of a few kW located in individual premises to large power plants generating several MW of power [7]-[8].
PV arrays are normally composed of large numbers of PV modules. These PV modules can have different current–voltage– characteristics. The difference between module characteristics is called I–V mismatch. I –V mismatch can have permanent or temporary sources.
A temporary source for I–V mismatch changes in the irradiance level received by PV modules. I–V mismatch caused by the changes in irradiance level is called partial shading of the PV array. Furthermore, partial shading sources could be divided into easy-to-predict and difficult-to-predict sources. Easy-to-predict sources include nearby PV arrays, buildings, and trees. Examples for difficult-to-predict sources are clouds soiling, and snow. Partial shading loss reduces annual energy yield by 5%–10% in Building Integrated Photovoltaic (BIPV) [15], [16] and by 3%–6% in PV farms [17].
Each module in the PV array should operate at its own maximum power point in order to maximize the power production of the PV array. This can be ensured by a single Maximum Power Point Tracker (MPPT) if there is no mismatch between the modules. In case of mismatch, there is no guarantee that all the modules are operating at their Maximum Power Points (MPPs). This can be avoided by having an MPPT for each PV module [18], [19]. Another solution is to use a multilevel inverter with independent voltage control for each PV module [20], [21]. In [22], it is proposed to connect all the modules in parallel to avoid these losses.
Avariety of maximum power point tracking (MPPT) algorithms have been proposed including fractional open circuit voltage [23]–[24], fractional short circuit current [25], [26], perturb and observe (P&O) [27]–[28], incremental conductance (INC) [29]–[30], and artificial-intelligence-based algorithms [17]–[21]. These algorithms vary in their complexity, efficiency, cost, and potential applications [27], [31], [32].
The main aim of this paper is to provide readers with the fundamental knowledge on how a model can be made on MATLAB/SIMULINK and how the simulated result can be compared with the actual results obtained from PV panel installed. The principle and operation of the PV cell and the fundamental characteristics of PV cell are discussed in para II. The simulation model developed using MATLAB/SIMULINK and the results obtained are presented and discussed in para III and the comparison of simulated result with that of practical result is discussed in para IV.
II. OPERATION AND CHARACTERISTICS OF PV OR SOLAR CELLS
During darkness, the solar cell is not an active device; it works as a diode, i.e a p-n junction. It produces neither a current nor a voltage. However, if it is connected to an external supply (large voltage), it generates a current ID, called
diode current or dark current [9].
The model contain a current source Iph , one diode, a parallel resistance Rsh & a series resistance Rs , which represents
the resistance inside each cell and in the connection between the cells. The net current is the difference between the photocurrent is the connection between the cells. The net current is given by the following equation:
Fig.1 Circuit diagram of PV cell I= Iph – Is(
( )
-1)) – ( ) 1
Where A is idealizing factor, k is Boltzmann’s gas constant, Tc the absolute temperature of the cell, q electronic charge
& V is the voltage imposed across the cell. Is is dark saturation current and it is strongly dependent on the temperature.
Fig.2 Characteristic curve of PV system.
III. MODELING AND SIMULATION OF PV CELL IN MATLAB/SIMULINK
The model is developed in MATLAB/SIMULINK based on the mathematical equation of PV cell. For developing the model, Sunpower Panel SPR-310-WHT-D has been chosen. The Sunpower Panel SPR-310-WHT-D, a 50 KW grid-connected photovoltaic (PV) generation systems have been installed at Elcomponics sales Pvt Ltd, Noida. In order to analyze the performance of grid connected PV system a model is developed in MATLAB and the curves obtained are compared with the actual values obtained. . In this panel there are total 165 modules, in which 11 are connected in series and 15 such strings in parallel with 96 cells per module. The key specifications of the solar panel are shown in Table 1.
Target Tool used:
In this Dissertation work the tool used is SIMULINK models. To open that the path followed is Library SIMULINKsource
Library SIMULINK Math operation
Library Simevent Simevent Ports and Subsystem This is the main model PV array System.
Table 1. Key specifications of Sunpower Panel SPR-310E-WHT-D
A real solar cell can be characterized by the following fundamental parameters which are also sketched in model in Fig. 1
Model SPR-310E-WHT-D Cell type monocrystalline Maximum Power[W] (-0/+5w)(pump) 310w Open circuit voltage Voc[V] 64.4
Short Circuit Current[Isc] 6.05
Current, Max power Impp [A] 5.67
Voltage , Max power Vmpp[V] 54.7
Normal operating cell temperature 45
Temperature co-eff of Voc (beta), β -0.176% / 0C
Temperature co-eff of Isc(alpha), α 0.003% / 0C
a) Short circuit current Isc=Iph. It is the greatest value of the current generated by a cell. It is produced under short circuit
condition V=0.
b) Open circuit Voltage corresponding to the voltage drop across the diode (p-n junction), when it is traversed by the photocurrent Iph (namely ID=Iph), namely when the generated current is I=0. It reflects the voltage of the cell in the night
and it can be mathematically expressed as:
Voc= ln ( ) = Vt ln ( ) 1
Where Vt = is known as thermal voltage and Tc is the absolute cell temperature.
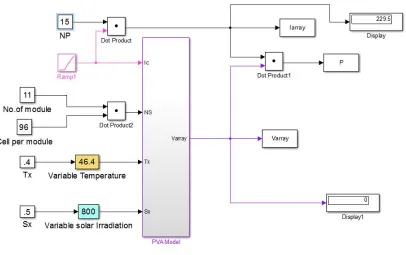
Fig 3.Main Model of PV array system
IV. RESULT
The output of the models can be obtained on different temperature and different irradiation value. The outputs of simulated output are shown in the tables and graphs.
Fig 4 shows that when temperature 46 0C and irradiation 797 watt/m2, value of Imax is 84.86 A,Vmax is 514.9 V and
Fig. 4 Variation of P, V & I at Temp 46 0C and Irradiation 797 watt/m2
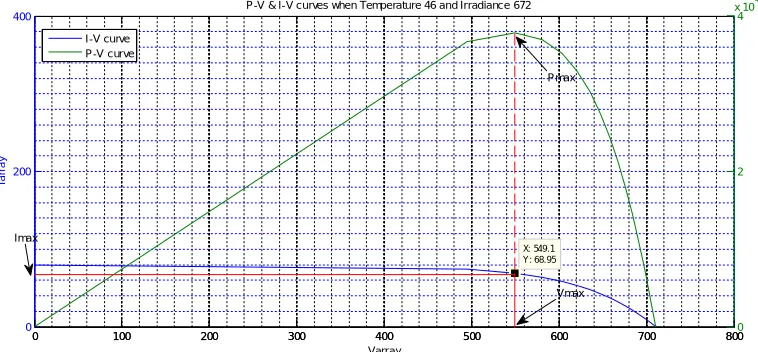
Fig 5 shows that when temperature 46 0C and irradiation 672 watt/m2, value of Imax is 68.95A, Vmax is 549.1 V and Pmax
is 37.8 kW.
Fig. 5 Variation of P, V & I at Temp 46 0C and Irradiation 672 watt/m2
The graph shows the variation of Power, Current and voltage according to temperature and irradiation. The open circuit Voltage increase logarithmically with the ambient irradiation, while the short circuit current is a linear function of the ambient irradiation. Similar graph has been studied and following data has been predicted.
0 100 200 300 400 500 600 700
0 100 200 300
X: 514.9 Y: 84.86
Varray
Ia
rr
a
y
P-V & I-V curves when temperature 46 and irradiance 797
0 100 200 300 400 500 600 7000
2 4 6 x 10⁴
P-V curve I-V curve
Pmax
Imax Vmax
0 100 200 300 400 500 600 700 800
0 200 400
X: 549.1 Y: 68.95
Varray
Ia
rr
a
y
P-V & I-V curves when Temperature 46 and Irradiance 672
0 100 200 300 400 500 600 700 8000
2 4 x 10⁴
I-V curve P-V curve
Vmax Imax
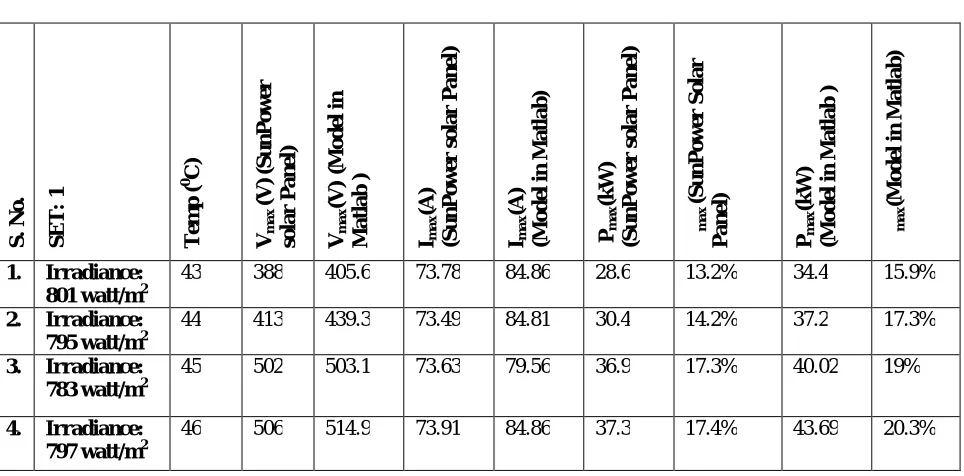
Table 2 Comparison of data of SUNPOWER SOLAR PANEL and Simulated result in MATLAB S . N o . S ET: 1 Te mp ( 0 C ) Vm a x (V ) (S u n P ow e r sol ar P an e l) Vm a x (V ) (M od el i n M atl ab )
Ima
x (A ) (S u n P ow e r sol a r P an e l)
Ima
x (A ) (M od el i n M at lab ) Pm a x (k W) (S u n P ow e r sol a r P an e l) ηm a x (S u n P ow er S o lar P an e l) Pm a x (k W) (M od el i n M at lab ) ηm a x (M od e l in M at lab )
1. Irradiance: 801 watt/m2
43 388 405.6 73.78 84.86 28.6 13.2% 34.4 15.9%
2. Irradiance: 795 watt/m2
44 413 439.3 73.49 84.81 30.4 14.2% 37.2 17.3%
3. Irradiance: 783 watt/m2
45 502 503.1 73.63 79.56 36.9 17.3% 40.02 19%
4. Irradiance: 797 watt/m2
46 506 514.9 73.91 84.86 37.3 17.4% 43.69 20.3%
From the table 2 it is also concluded that the maximum efficiency of SunPower Solar Panel obtain is 17.4% at temperature 460C and irradiation 797 watt/m2 and that of obtained from Model in MATLAB/SIMULINK is 20.3% at temperature 460C and irradiation 797 watt/m2.
V. CONCLUSION
The performance of PV system is strongly dependant on meteorological conditions such as shading, irradiance, PV array surface temperature, etc. Therefore, the performance of PV arrays was analyzed using the measured performance results of PV systems for monitoring period and investigated by reviewing several problems such as performance, deterioration and losses. Data obtained from SUNPOWER SOLAR PANEL.
From the results above following points are concluded:
By varying the temperature there is almost no effect on current.
By varying the irradiation there is large fluctuation in current.
The maximum efficiency of a solar photovoltaic cell is given by the following equation:
η max (maximum efficiency) =
( )
( ∗ )
The irradiation could better be described as the amount of sunlight that hits the earth’s surface in W/m2. The assumed incident radiation flux under standard test conditions (STC) that manufacturers use is 800 W/m2. Keep in mind though, that STC includes several assumptions and depends on your geographic location.
It has been found that, on average, the mean daily power generated by our installation has been 43 kWh and the nominal power given by the manufacturer is 50 kWh. This huge difference is because of the absence of ideal condition i.e Temperature must be 46 0C and Irradiation must be 800 watt/m2 for maximum power. But during a whole day there is fluctuation in temperature and as well as irradiation which enables to form an ideal condition and hence the efficiency is not able to reach to its highest point.
1. With the increase in temperature the rate of photon generation increases thus reverse saturation current increases rapidly and this results on reduction in band gap. Hence this leads to marginal changes in current but major changes in voltage.(Observe tables)
2. Efficiency it increased a little bit when the modules are kept neat and clean.
3. Solar cells in PV array work only in part of volt-ampere Characteristic near working point where maximum voltage and maximum current is.
4. Such a model would provide a tool to predict the behavior of any solar PV cell, module and array under climate and physical parameters changes.
REFERENCES
[1] Jung Hun So, Young Seok Jung, Gwon Jong Yu, Ju Yeop Choi, Jae Ho Choi, Performance results and analysis of 3 kW grid-connected PV systems,elseveir Renewable Energy 32 (2007) pp. 1858–1872.
[2] Marcelo Gradella Villalva, Jonas Rafael Gazoli, Ernesto Ruppert Filho, MODELING AND CIRCUIT-BASED SIMULATION OF PHOTOVOLTAIC ARRAYS, 10th Brazilian Power Electronics Conference (COBEP), 2009
[3] S. W. Angrist, , Direct Energy Conversion, Allyn and Bacon, Inc., 4th edition, 1982, pp. 177-227.
[4] J. C. H. Phang, D. S. H. Chan, and J. R. Philips, “Accurate analytical method for the extraction of solar cell model parameters,” Electronics Letters, vol. 20, no. 10, 1984, pp.406-408.
[5] Pradhan Arjyadhara1, Ali S.M2, Jena Chitralekha3, Analysis of Solar PV cell Performance with Changing Irradiance and Temperature., International Journal Of Engineering And Computer Science ISSN:2319-7242 Volume 2 Issue 1 Jan 2013 Page No. 214-220.
[6] ‘Lee, Kui-Jun et al ; An Adaptive Maximum Power Point Tracking Scheme Based on a Variable Scaling Factor for Photovoltaic Systems’, The Korean Institute of Power Electronics, May 2012, Volume 17, pp.423-430.
[7] G.Petronea and C.A.Ramos - Pajab, Modeling of photovoltaic fields in mismatched conditions for energy yield evaluations, ”Elect. Power Syst. Res.,vol.81,no.4, pp.1003-1013,Apr.2011.
[8] B.InduRani, Member, IEEE, G.SaravanaIlango, and Chilakapati Nagamani, Member, IEEE, Enhanced Power Generation From PV Array Under Partial Shading Conditions by Shade Dispersion Using Su Do Ku Configuration. IEEE TRANSACTIONS ON SUSTAINABLE ENERGY November14,2012 pp. 1-7.
[9] S. Sheik Mohammed, ‘Modeling and Simulation of Photovoltaic module using MATLAB/Simulink’, International Journal of Chemical and Environmental Engineering Volume 2, No.5, October 2011. 350-355
[10] Huan-Liang Tsai, Ci-Siang Tu, and Yi-Jie Su, Member, IAENG ‘Development of Generalized Photovoltaic Model Using MATLAB/SIMULINK’, Proceedings of the World Congress on Engineering and Computer Science 2008 WCECS 2008, October 22 - 24, 2008, San Francisco, USA.
[11] Anca D. Hansen, ‘Models for a Stand-Alone PV System’, Riso-R-1219(EN)SE C-R-12, Risco National Laboratory, Roskilde , December 2000 pp. 1-78.
[12] M. Sidrach-de-Cardona, Ll. Mora Lo´pez, Performance analysis of a grid-connected photovoltaic system, pergamon, Energy 24 (1999) 93–102. [13] F. Spertino and J. S. Akilimali, “Are manufacturing I–V mismatch and reverse currents key factors in large photovoltaic arrays?,” IEEE Trans.