1519 | P a g e
DATA CLASSIFICATION USING MODIFIED FUZZY
CLUSTERING
Nisha Singh
M.Tech Scholar, Rama University, Kanpur
ABSTRACT
Fuzzy Clustering plays a vital role in clustering the real world data where a data item relates to more than one cluster. Where the fuzzy logic based algorithms are always suitable for performing soft clustering tasks. Fuzzy-C Means (FFuzzy-CM) algorithm is very popular algorithm based on fuzzy logic. In fuzzy logic based algorithm, the parameter as exponent for partition matrix, that we have to fix for the clustering task, plays a very important role on the performance of the used algorithm. In this paper, an experimental analysis is done over Modified Fuzzy-C Means (M-FCM) algorithm to observe the impact of this exponent parameter on the performance of the algorithm.
Keywords
-
Clustering, Modified FCM, Matlab, Soft clustering.
I. INTRODUCTION
Clustering of data is an unsupervised study where we try to categorize our data into separate groups known as
“clusters” there. But on doing this, we need to maintain two basic and important features that are: 1. High
Cohesive feature and 2. Low coupling feature. According to the first feature, the data items inside a cluster must
exhibit high similar properties, and the second property says that data items inside a cluster must be different in
nature from the data items in another cluster. The cluster field is again divided into two categories: 1. Exclusive
clustering (Hard Clustering. 2. overlapping clustering (Soft clustering). In case of hard clustering, a data
item must belong to only one cluster exclusively. Among the popular ones, K-Means is a frequently chosen
algorithm for hard clustering task. While, in case of soft clustering task, a membership value is assigned to every
object based on which an object may simultaneously belong to more than one cluster. Fuzzy-C Means (FCM)
algorithm is a famous soft clustering technique. In this paper, first of all an introduction of soft clustering and
FCM algorithm is given, and then we move for the experimental analysis of FCM algorithm by analyzing the
impact of different values of exponent for the partition matrix on the performance of the algorithm.
II. SOFT CLUSTERING
Soft clustering is also referred as overlapping clustering or fuzzy logic based clustering [1].In soft clustering, a
data item may not belong to particular one cluster exclusively. Depending on the membership value, it may
belong to more than one cluster. Sometimes, hard clustering is not fruitful for our clustering task. As for
1520 | P a g e
genre, such as “Aliens”, which is listed in the action, horror and science fiction genres. Similarly, in case ofdocument categorizations, a single document may belong to more than one category [3]. In such cases, soft
clustering is selected for clustering task. In soft clustering, a data item is associated with a set of membership
values which indicates the strength of the relation between that data element and a particular cluster [4]. Fuzzy
logic is used in the involved mathematical calculations.
III. MODIFIED FUZZY C-MEANS ALGORITHM
Modified Fuzzy C-means (FCM) algorithm is a clustering technique wherein each data point belongs to a cluster to some degree which is specified by a membership value. This overall technique was originally introduced by
Jim Bezdek in 1981 as an improvement to the earlier clustering methods [4] [5]. It provides a method of how to
partition data points that populate some multidimensional space into a specific number of defined clusters. The
main advantage of modified fuzzy c – means clustering is that it allows gradual membership of data points to
clusters measured as degrees within the boundary [0,1]. This gives the flexibility to express those data points
that they can belong to more than one cluster.
It is based on minimization of the defined objective function. Fuzzy matrix µ with n rows and c columns are
used to describe fuzzy clustering of different objects where n means numbers of data and c for the numbers of
clusters. In the matrix µ the element in ith row and jth column, the element is µij .
µij J [0,1] , i=1,2,….,n ; j=1,2,….,c (1)
ij =1 i=1,2,….,n (2)
0 < ij < n j=1,2,….c (3)
The objective function is minimization of fuzzy clustering equation :
Jm= ijm || xi – cj ||2 (4)
Where, cj is the clusterand m is the fuzzy index governing the influences of membership grades, where m is set
to 2.1.
µij = (5)
cj= ( ijm .xi) / ( ijm ) (6)
Where, µij is used to evaluate membership values. And it depends on value of m, high value of m will provide
the lower value of µij .
From the sample points xi to the cluster center aj , the Euclidean distance is measured by the term used here in
equation (4) as || xi – aj ||2 .
Here in given equation the iteration gets terminated when, maxij |µij(k+1)- µij(k)| < ϵ, where ϵ is a termination
criterion between 0 and 1, whereas k are the iteration steps.
Algorithm for the modified fuzzy c-means strategy to follow is :
1. Initialize U=[µij] matrix, U(0)
2. At k-step: calculate centers vectors
1521 | P a g e
cj= ( ijm .xi) / ( ijm ) //set m=2.13. Update U(k) , U(k+1)
µij =
4. If || U(k+1) – U(k) || < ϵ Then STOP;
Otherwise return to step 2.
where, aj is the jth element and m is the fuzzy index governing the influences of membership grades, where m is
set to 2.1.
From the sample points xi to the cluster center aj , the Euclidean distance is measured by the term used here in
equation (4) as || xi – aj ||2 .where m is a constant known as fuzzifier (or index of fuzziness) as it controls the
fuzzyness of resulting contents. The objective function is minimization of fuzzy clustering equation.
In this paper, research is focusing basically on the value of the exponent for the partition matrix. Because, the
modified criteria of FCM is determined by the value of this parameter. Value of this exponent determines the degree
of fuzziness. Commonly, it is assigned a value which is greater than 1.When the exponent value is tending to
infinity, the degree of fuzziness is increasing. In the next section, we will experimentally analyze the FCM
algorithm with different values of exponent for the partition matrix using Matlab.
IV. VALIDATION
The validation step is related to the procedure for the verification of fuzzy zone, as it fits best to the whole database.
Usually, the cluster validity indexes are calculated in this step measure statistical properties of clustering results,
usually the distance within cluster or among clusters. In this step fitting includes other fields also as a fixed number of
clusters and the shapes of cluster found.
This study has validated the set of objects via two types of validity indices described as following:
(a) Partition Coefficient (PC): calculates the value of "overlapping" between clusters it is defined by bezdec et al.
(1984) as the given equation:
PC(c) = (µij) 2
(7)
where µij is membership function of data joint j in cluster i.
(b) Classification Entropy (CE): according to the study of cheng et al. (1998), CE measures the fuzziness of the
cluster partition only, which is same as measuring the previous coefficient.
CE(c) = - µij log(µij) (8)
V. EXPERIMENTAL RESULTS
The whole experiment has been done using Matlab R2013a (version 8.1).The basic characteristics of these
twelve datasets are summarized with the brief description of their attributes and instances with no. of clusters
1522 | P a g e
Table 1. The collection of data usedHere, dataset used as iris flower dataset, monk_2,Wisconsin, titanic, Haber, Hayes, Balance, User_Hamdi,
Page_Block, Banana, Teaching Assistant Evaluation (TAE), Lenses are total twelve dataset with no missing value,
over which the work has been performed. These are taken from various benchmark datawise databases where some
of them are taken from UCI repository for the testing of effectiveness of modified fuzzy c-means technique.
In order to evaluate the high performance of proposed method, performance test is illustrated for the proposed
modified fuzzy c-means clustering algorithm, and the proposed clustering algorithm results (for the value of
exponent at 2.0 and 2.1) are compared with that of other state-of-the-art approach. Basic Fuzzy c-means algorithm
which is shown in (table 2) with its effectiveness measured in terms of %correctness for the value assumed of
exponent variable (m=2.1).
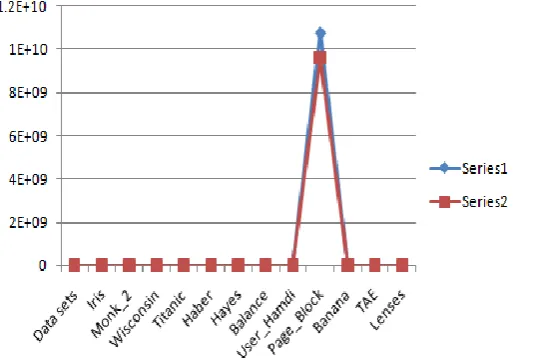
In the given table comparison has been done and for that comparison also the graph has been plotted in figure 1.
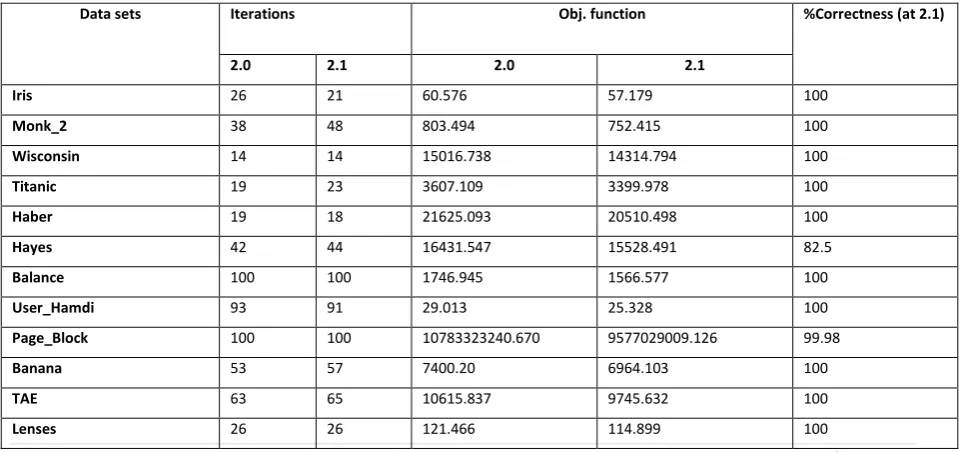
Table 2.Clustering results obtained for data sets
According to this table 2 graph is plotted as following.
Data sets Samples Features Clusters
Iris 150 4 3
Monk_2 432 6 2
Wisconsin 683 9 2
Titanic 2201 3 2
Haber 306 3 2
Hayes 160 5 3
Balance 625 4 3
User_Hamdi 403 5 4
Page_Block 5473 10 5
Banana 5300 2 2
TAE 151 5 3
Lenses 24 5 3
Data sets Iterations Obj. function %Correctness (at 2.1)
2.0 2.1 2.0 2.1
Iris 26 21 60.576 57.179 100
Monk_2 38 48 803.494 752.415 100
Wisconsin 14 14 15016.738 14314.794 100
Titanic 19 23 3607.109 3399.978 100
Haber 19 18 21625.093 20510.498 100
Hayes 42 44 16431.547 15528.491 82.5
Balance 100 100 1746.945 1566.577 100
User_Hamdi 93 91 29.013 25.328 100
Page_Block 100 100 10783323240.670 9577029009.126 99.98
Banana 53 57 7400.20 6964.103 100
TAE 63 65 10615.837 9745.632 100
1523 | P a g e
Fig 1. Graph plotted between the value achieved at exponent value 2.0 and 2.1 of objective function.Fig.:1 Graph for objective function achieved at exponent value 2.0 and 2.1. Here series 1 representing the
obj. function value at 2.0 and series 2 is representing the obj. function value at 2.1.
VI. CONCLUSIONS
In basic Fuzzy clustering, which constitute the oldest component of soft computing, are suitable for handling the
issues related to understandability of patterns, incomplete/noisy data, mixed media information and human
interaction, and also can provide approximate solutions faster. And they have been mainly interacted with
discovery of association rules and functional dependencies and image retrieval. And there is effect in the output
also if we vary the value of exponent as 2.0 which is standard value assigned to it but in some cases it is not
compulsory to take same value of exponent every time. It means we can get effective result on varying the value
of exponent in comparison to being stuck to a constant value as in covered problem in this paper it is found that
at exponent value 2.1 results are quite good in terms of clustered data as well as objective function value is also
achieved minimal as compare to previous rigid value. Here the complete working is moving around for
complete data sets with no missing value. In future goal will be to perform same experiment for datasets with
missing values for effectiveness.
REFERENCES:
[1] Bezdek, J., R. Ehlich, W. Full. 1984 FCM: The fuzzy c-means clustering algorithm. Computers and
geosciences. 10(2) , 191-203.
[2] Cheng, H. D., Chen, J.R, Li., J.1998. Thresold selection based on fuzzy c-partition entropy approch. Pattern
recognition, 31(7), 857-870.
[3] Frank Hoppner, Fuzzy cluster analysis: methods for classification, data analysis, and image recognition.