Methods of parameterization of amplitudes and extraction
of resonances,
D
-decay amplitudes
RobertKami´nski1,∗
1Institute of Nuclear Physics PAS, Radzikowskiego 152, Kraków
Abstract.Amplitudes used for analyses of two-body interactions very often are not unitary therefore can not guarantee correct results. It is, however, quite easy to construct unitary amplitude or check whether given amplitude fulfills unitarity condition. Only few conditions must be fulfilled to guarantee unitarity. Presently, when in many data analyses very small, overlapping or broad signals are studied, non-unitary effects can significantly influence results and lead to nonphysical interpretation of obtained parameters.
1 Introduction
Unitarity can be compared to probability that is conserved in nature. Therefore unitarity should play crucial role in analyses of amplitudes in various interactions and decays. Here we concentrate on the simplest case: two-body interactions. The typical easiest way to construct amplitudes containing several resonances is just to add the smallest number of individual amplitudes which sufficiently well describe data. Here we show that amplitudes constructed in such a way may be not unitary and may be not sufficient to describe the data and need additional smooth background. Backgrounds may be interpreted as an effective influence of all omitted singularities of the amplitudes. These singularities usually lie very far from the physical region and are very model dependent, therefore can not be interpreted as real resonances. Resonances which we can find in for example Particle Data Group Tables should be model independent and should play leading role in construction of full amplitudes (phase shifts and inelasticities), both elastic and inelastic. Parameters of resonances (for example mass and width) do, however, depend very much on whether the amplitudes used in analyses were unitary or not.
2 Unitarity for one resonance amplitude in one channel scattering
What tell us about unitarity? Similarity between unitarity and probability is difficult to apply directly to amplitude. Square of modulus of amplitude is proportional to cross section for given process and varies with energy. Function which behaves like probability isS-matrix (one element in one channel case). Modulus ofS-matrix is equal to one what strongly con-strains analytical structure of unitary amplitude. Let us construct such amplitude for the simplest case - one resonance.
∗e-mail: [email protected]
GenerallyS-matrix can be expressed as ratio of two Jost functionsS(k)= DD((−kk)) =e2iδ. To reproduce resonance in ourS-matrix let us first assume minimum condition - one zero of the denominatorD(k) atk=kj. SoD(k)=(k−kj) andD(−k)=(−k−kj). One can easily
check that in such "one pole" case|S(k)|, 1 therefore our amplitudeA(k) related with the S(k)-matrix byA(k)= S(2kik)−1 is not unitary. Adding second-symmetric pole also on the 2nd Riemann sheet but atk=−k∗
jone getsD(k)=(k−kj)(k+k∗j) andD(−k)=(−k−kj)(−k+k∗j).
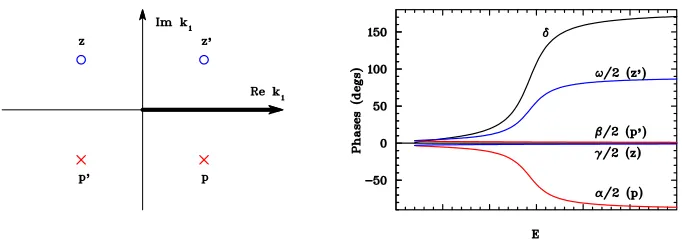
One can easily check that now|S(k)|=1 and phase shiftδ=(−α−β+γ+ω)/2, whereα, β, γ
andωare phases of the polesp,p0and zeroesz0andzpresented on Fig. (1). Full phase shifts and all components are presented on this figure.
All those phase components are given by ArcT an(−Imkj
k−Rekj). It shows that of course only
polepand zeroz0lying closer to physical region than their mirror polep0and zeroz(hereafter "second pole") can produce increase of the phase by π/2 what is characteristic for single resonances. Therefore the role of the second pole decreases with the energy. Nowhere is, however, equal to zero. At the threshold, i.e. right in the middle between p, z0 p0 andz influence of the all these poles and zeroes on the amplitude is the same.
Figure 1.Schematic positions of all necessary poles and zeroes of an unitary amplitude for single res-onance in the complex momentum plane (left figure) and phases of all these poles and zeroes compared with their sumδ- phase shifts of the amplitude (right figure), thick black line denotes physical region.
The most popular amplitude used in for example experimental analyses is Breit-Wigner type amplitudeBW(E)= M Γ/2k
BW−E−iΓ/2. Using relationBW(E)= SBW(k)−1
2ik one can easily
calcu-lateSBW(E) and check if thisS-matrix is unitary as should be. From definition ofBW(E) one
getsSBW(E) =
MBW−E+iΓ/2
MBW−E−iΓ/2. One can easily check that|SBW(E)|=1 so single Breit Wigner
approximation is unitary. Of course Breit-Wigner is approximation and works well only near the resonance mass, especially for narrow resonances. For example threshold behavior of
such amplitude is wrong. In the limitE −→ 2mtheS-matrixSBW(E) −→ 2m−E∗
j 2m−Ej (where
Ej =MBW −iΓ/2) andδ(E) −→ArcT an(MBWΓ/−22m),0 (alsoσ(E),0). In case of unitary S-matrix defined by Jost functions with two poles and zeroes presented above, corresponding limits are correct, i.e.S(k)−→ −kj∗kj
−kj∗kj soδ(k)−→0 andσ(k)−→0.
3 Unitarity for amplitude with more resonance and more channels
S1−1 2ik +
S2−1
2ik what corresponds toS1+S2=e
2iδ1+e2iδ2. Of course|S
1+S2|,1 what means that isobar model violates unitarity. In case of analyses usingS-matrix instead of amplitudes one can create productS1S2 which fulfills unitarity (for more resonances described bySi
the method is the same). Another popular way of parameterization of amplitudes is to use K-matrix defined byS =(1+iK)/(1−iK). Sum of twoK-matrices does not violate unitarity. In case of more that one channel situation becomes more complicated. Because of simple
ambiguityk2 =±
q
k12+m21−m22every new channel doubles number of Riemann sheets. So
in case ofnchannels one has 2n Riemann sheets and 2n−1 poles lying on various Riemann sheets and coming from one single pole appearing in one of the channels in fully decoupled case. All these poles are shifted more or less (it depends on strength of coupling between channels) with respect to position of this original pole.
Figure (2) presents Riemann sheets for two channels and schematic positions of poles and zeroes corresponding to one resonance. Names of Riemann sheets are given by signs of imaginary parts of momenta in all channels. For example in two channel case mark (−,+) means thatIm(k1)<0 andIm(k2)>0
Figure 2.Riemann sheets for two channels with poles (crosses) and zeroes (circles) for one resonance
Table 1 presents an example of positions of theS-matrix poles for three resonances found in two channel analysis of scalar-isoscalarππinteractions below 2 GeV (analysis similar to that in [1]). Underlined are poles which play leading role in the full amplitude. They were found checking distances of the poles from the physical region in complex conformal variable zdefined byz= √k1+k2
m2
K−m2π
. The results of such analysis have been confirmed by analysis of
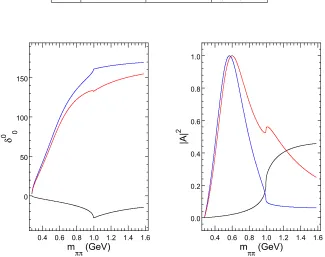
phases and squared modules of amplitudes (proportional to cross section) corresponding to each pole. Figures (3) and (4) present phases and squared modules of amplitudes for each pole separately and for pairs of poles related with given resonance. It is seen that in both cases (especially for f0(980)) one pole is dominant and the second one plays minor role.
In case of analysis of more than 2 channels one can not define and use similar confor-mal variable and the simplest and effective method is just analysis of influence of all found poles on the phase shifts and inelasticities as was shown on Figs (3) and (4). Another method relays on presentation of positions of all poles in 3 dimensional combinations of real and/or
Table 1.Positions of two channelS-matrix poles found in analysis of scalar-isoscalalrππinteractions below 2 GeV
Pole ReEpoleMeV ImEpoleMeV R. sheet
1 639.6 -323.9 (−,−) :III
1’ 511.4 -230.6 (−,+) :II
2 982.0 -36.9 (−,+) :II
2’ 432.4 -8.4 (−,−) :III
3 1431.7 -79.3 (−,−) :III
3’ 1394.9 -120.6 (−,+) :II
0.4 0.6 0.8 1.0 1.2 1.4 1.6
0 50 100 150
m
ππ (GeV)
δ
0 0
0.4 0.6 0.8 1.0 1.2 1.4 1.6 0.0
0.2 0.4 0.6 0.8 1.0
m
ππ (GeV)
|A|
2
Figure 3.Phase shifts and squared modules of amplitudes produces by single poles from Table 1 and their pairs, black lines are for pole 1, blue for 1’ and red for both poles together.
imaginary parts of complex momenta in all channels. Reasonable choice of axis and careful analysis of distances of these poles from physical region enables to identify the most promi-nent poles. Example of results of such 3-channel analysis one can find in [2] (Tables 3-7).
Independently on analyzed number of channels and number of found resonances crucial is the use of correct i.e unitary amplitude. In recent analysis of pion electromagnetic form factor [3] authors present various ways of parameterization ofe+e−→π+π−cross section and of vector-isoscalarππelastic amplitude. In Table 2 compared are parameters ofρstates ob-tained using Gounaris-Sakurai model and unitary and analytic approach. The latter one gives significantly different results than those from PDG Tables and than obtained using Gounaris-Sakurai model. Mass difference forρ(770) is about 9 MeV and forρ0andρ00about 170 MeV and 78 MeV respectively. Sign of these differences agrees with what was presented in Section 2 (mass from unitary amplitude is smaller). Small phase produced by second pole (denoted in Section 2 byp0) leads to shift of the main polep(i.e. shift of the mass) to lower energies
0.4 0.6 0.8 1.0 1.2 1.4 1.6 0
50 100 150
m
ππ (GeV)
δ
0 0
0.4 0.6 0.8 1.0 1.2 1.4 1.6 0.0
0.2 0.4 0.6 0.8 1.0
m
ππ (GeV)
|A|
2
Figure 4.Phase shifts and squared modules of amplitudes produces by single poles from Table 1 and their pairs, black lines are for pole 2, blue for 2’ and red for both poles together.
Table 2.Parameters ofρstates obtained using Gounaris-Sakurai model and unitary and analytic approach are compared with values from Particle Data Tables [4].
Parameter PDG MeV G.S. MeV U&A MeV mρ 775.26±0.25 774.81±0.01 763.88±0.04
mρ0 1465.00±25.00 1497.70±1.07 1326.35±3.46 mρ” 1720.00±20.00 1848.40±0.09 1770.54±5.49 Γρ 149.10±0.80 149.22±0.01 144.28±0.01
Γρ0 400.00±60.00 442.15±0.54 324.13±12.01 Γρ” 250.00±100.00 322.48±0.69 268.98±11.40
in comparison with mass determined by value of phase shift equal toπ/2. In case ofρ(770) this shift should be few MeV and for wider states should be bigger what agrees with numbers in Table 2.
3.1 Crossing symmetry as additional constraint
It is very advisable to introduce the crossing symmetry requirement to the amplitudes. For identical particles likeππit quite easy and was proposed by Roy few decades ago [5] and later was developed and applied in number of works in the early 2000s e.g. [6] and [7]. For non-identical mesons likeπandKsimilar analysis was performed recently [8].
Introduction of the crossing symmetry requirement to amplitudes describing scalar-isoscalar ππinteractions has led to spectacular successes. One of them was to eliminate the long standing up-down ambiguity in these amplitudes (in favor of the down solution)
[9] and the second was to reduce by factor about 6 the uncertainty caused by the significant dispersion of experimental data. This reduction was possible thanks to the application of a newly derived set of Roy-type dispersion relations GKPY with one subtraction [7].
3.2 Example of unitary amplitudes in heavy meson decays
Heavy meson decays are very often described using popular isobar model. For example in one of the BaBar analysis of theD0 → K0
SK+K
−decays [10] isobar model with A
tot(m)=
P
rareiΦrAr(m)+aNReiΦNR was used for 5 resonances: a0(980),a0(1450), f0(1370),φ(1020) and f2(1270)+their charge "twins". In results sum of the fraction was 152.2% andχ2 = 1.1pdf for 14 free parameters.
Using a different method to describe these decays (based on quasi-two-body factorization) the total amplitude may be expressed byAtot(m)=S0(m)+S+(m)+S−(m)+P0(m)+D0(m) with unitaryS0(m),S+(m),S−(m),P0(m) andD0(m) components. In results sum of the fraction is
≈ 130% andχ2 ≈1.2pdf for 16 free parameters [11]. The same method with also unitary
amplitudes in single channels has already been successfully used to describe the decays of other heavy mesons (see for example [12]).
4 Conclusions
The condition of unitarity is very important and quite easy to introduce when building ampli-tudes. They must meet several conditions, such as for example the presence of two symmet-rical poles for each resonance. When drawing conclusions from the analysis of multi-channel amplitudes fitted to the experimental data, it is extremely important to correctly identify the leading poles and link them to existing (or new) resonances. To avoid ambiguity in determin-ing the parameters of these resonances, it should always be clearly explained how they were identified and what amplitudes were used for this.
Acknowledgments
The work was created as a result of the implementation of the Polish research project No. 2018/29/B/ST2/02576 financed from the funds of the National Science Center
References
[1] R. Kami´nski, L. Le´sniak and J.-P. Maillet, Phys. ReV. D50, 3145 (1994). [2] R. Kami´nski, L. Le´sniak and B. Loiseau, Eur. Phys. J. C9, 141 (1999). [3] Erik Barto˘set al., Phys. Rev. D96, 113004 (2017).
[4] C. Patrignani et al. (Particle Data Group Collaboration), Chin. Phys. C 40, 100001 (2016).
[5] S. M. Roy, Phys. Lett. 36B, 353 (1971).
[6] G. Colangelo, J. Gasser and H. Leutwyler, Nucl. Phys. B603, 125 (2001); B. Anantha-narayan, G. Colangelo, J. Gasser and H. Leutwyler, Phys. Rep. 353, 207 (2001).
[7] R. García-Martínet al., Phys. ReV. D83, 074004 (2011).
[8] J. R. Pelaez, A. Rodas and J. Ruiz de Elvira, Eur. Phys. J. C77, 91 (2017); J. R. Pelaez and A. Rodas, Phys. reV. D93, 074025 (2016); J. R. Pelaez and A. Rodas, Eur. Phys. J. C78, 897 (2018).
[9] R. Kami´nski, L. Le´sniak and B. Loiseau, Phys. Lett. B551, 241 (2003). [10] B. Aubert et al. (BABAR Collaboration), Phys. Rev. D 78, 034023 (2008). [11] Temporary results, works in progress.
[12] D. Boitoet al., Phys. Rev. D96, 113003 (2017).

![Table 2. Parameters of ρ states obtained using Gounaris-Sakurai model and unitary and analyticapproach are compared with values from Particle Data Tables [4].](https://thumb-us.123doks.com/thumbv2/123dok_us/8005056.1330054/5.482.81.413.73.298/parameters-obtained-gounaris-sakurai-analyticapproach-compared-particle-tables.webp)
