EPJ Web of Conferences 155, 00002 (2017) DOI: 10.1051/epjconf/201715500002 JDN 22
Instrumental aspects
Navid Qureshi
Institut Laue Langevin, 38000 Grenoble, France
Abstract. Every neutron scattering experiment requires the choice of a suited neutron diffractometer (or spectrometer in the case of inelastic scattering) with its optimal configuration in order to accomplish the experimental tasks in the most successful way. Most generally, the compromise between the incident neutron flux and the instrumental resolution has to be considered, which is depending on a number of optical devices which are positioned in the neutron beam path. In this chapter the basic instrumental principles of neutron diffraction will be explained. Examples of different types of experiments and their respective expectable results will be shown. Furthermore, the production and use of polarized neutrons will be stressed.
1. Introduction
A successful neutron scattering experiment requires a thorough plan of which instrument to use and how to set up its configuration in order to obtain the best possible results. Optimally, the decision of the set-up is taken beforehand, but in many cases the instrument parameters are modified on-the-fly after analyzing the first results. Due to the different experimental tasks – reaching from magnetic or nuclear structure investigation to the mapping of phase diagrams – and the different sample dimensions (both the crystal size and the lattice parameters), which can be investigated at one and the same instrument, it becomes obvious that the versatility of some instruments has to be adjusted to satisfy the experimental tasks. Obviously, the sample state (powder, single crystal, liquid, etc.) limits the choice of instruments, however, you can find powder diffractometers which differ from each other concerning the used neutron wavelength and particular devices in the beam path in order to maximize the efficiency for a type of experiment.
In this chapter the different instrumental aspects of powder and single-crystal diffractometers will be discussed including the choice of the sample environment and how this may be tuned in order to influence the obtainable results in terms of intensity, resolution, etc. At the end a short insight into the use of polarized neutrons will be given and how the analysis of the polarization after the scattering process can be exploited for the determination of magnetic properties of single-crystal samples.
2. The basic diffractometer
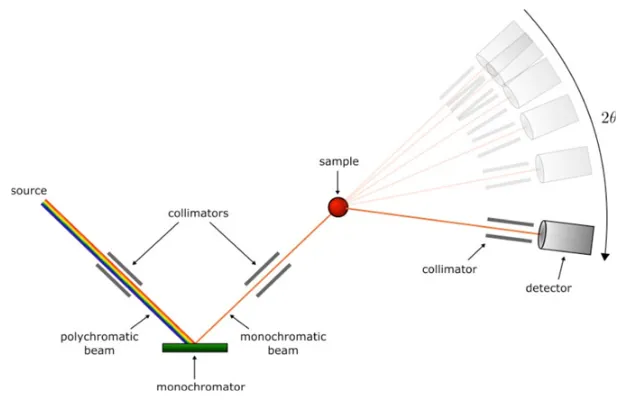
Regardless of the type of diffractometer (powder, single crystal, high resolution, high flux, etc.) the basic components along the beam path are the same (see Fig.1) starting with neutrons coming from the source [reactor (continuous), spallation (pulsed)] and passing through optical devices (e.g. collimators, slits, diaphgrams) until a single wavelength is selected at
EPJ Web of Conferences 155, 00002 (2017) DOI: 10.1051/epjconf/201715500002 JDN 22
Figure 1. Sketch of a basic diffractometer with the usual components along the beam path.
the monochromator according to the Bragg’s law (Eq. (1)).
n=2d sin (1)
The monochromatic beam interacts with the sample and is scattered under an angle of 2, where it is finally detected. Collimators can be used between (a) the source and the monochromator, (b) the monochromator and the sample and (c) the sample and detector in order to decrease the primary, secondary and tertiary divergence, respectively. A (Soller) collimator for neutron beams consists of parallel sheets made out of or covered with a neutron-absorbing material which only lets pass those neutrons which have a small divergence from the beam axis. In order to adjust the shape and size of the beam at the sample position a set of slits and diaphragms can be used in addition to the collimators. Collimators and slits between the sample and detector are used in order to reduce the background which originates from neutrons being scattered under a different angle at a different position (e.g. at the walls of the sample environment such as a cryostat). Obviously, all optical devices which reduce the beam divergence and affect its size will increase the resolution of the diffractometer. But as this is at the cost of those neutrons which have been absorbed the intensity of neutrons delivered to the sample or to the detector decreases, which constitutes the compromise between flux and resolution.
EPJ Web of Conferences 155, 00002 (2017) DOI: 10.1051/epjconf/201715500002 JDN 22
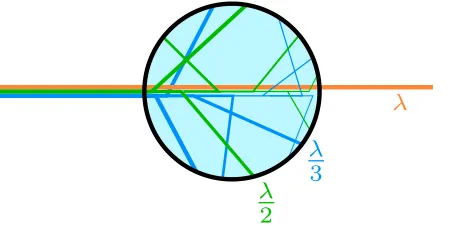
Figure 2. Schematic representation of a higher-harmonics filter.
monochromator and the sample. Such a filter (like pyrolytic graphite or Be) is chosen upon its largest lattice plane distance according to the relation <2dF, which states the cut-off
wavelength for Bragg diffraction. In such a way all wavelengths inferior to 2dFare diffracted
out of the beam path and absorbed at the container walls of the filter (see Fig.2). For Si or Ge monochromators, typically the (111) reflection is used for monochromatizing the beam, because the (222) reflection is forbidden by the extinction rules of this particular space group. Now that a monochromatic neutron beam is available, which possibly has been collimated and shaped, the experimental conditions have to be set. Measuring physical properties of a sample at low temperatures (down to the mK region) requires a cryostat (optionally with a
3He/4He dilution), while for elevated temperatures obviously a furnace is needed. Magnetic
fields or pressure can be applied by using a cryomagnet or a pressure cell, respectively. Each of these sample environments has its purpose, but also its limitations in terms of the accessibility of Bragg reflections when single-crystal diffraction is concerned.
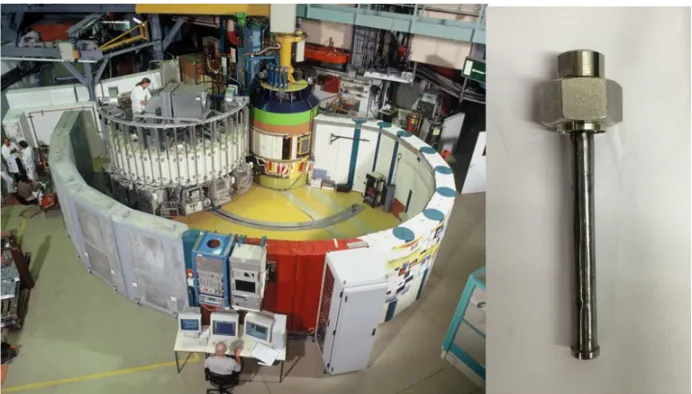
Finally, after the interaction with the sample the scattered neutrons travel to the detector (eventually after passing further collimators and slits) where they trigger a reaction with the detector material in order to produce a charged particle which is afterwards accelerated by an electric field and thereby detected. Typically, the3He isotope is used as a gas inside the detector cells, because it has a strong neutron absorption cross section and is rather insensitive to gamma radiation. Neutron detectors can consist of a single3He cell (single detector), but especially for powder diffraction where the statistical orientation of the crystallites leads to scattering in all possible directions large area detectors are used to cover a large 2 range. Such an area detector of the D20 diffractometer at the Institut Laue Langevin is shown in Fig.3.
3. Diffraction techniques
In this section the different diffraction techniques will be explained.
3.1 Powder diffraction
EPJ Web of Conferences 155, 00002 (2017) DOI: 10.1051/epjconf/201715500002 JDN 22
Figure 3. Large area detector at the D20 neutron diffractometer at the ILL.3He gas cells cover an angle
of 153.6◦. Taken from [1].
Figure 4. Left panel: D20 powder diffractometer at the ILL (taken from [1]). Right panel: Vanadium sample holder.
i.e. it does not produce additional Bragg peaks in the diffraction pattern, but a uniform increase of background.
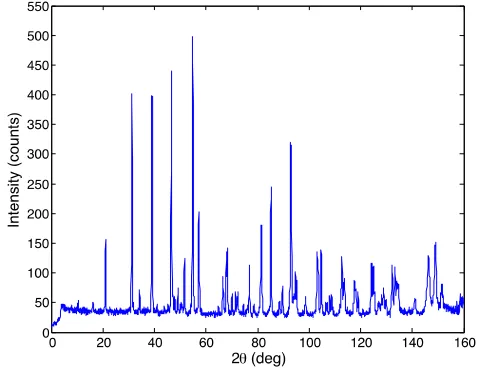
As mentioned above coherently scattered neutrons will produce Bragg peaks in the diffraction pattern (the scattered intensity as a function of the scattering angle 2(see Fig.1), which bear all the information necessary to determine the crystal or magnetic structure of the investigated material. In this context the observations to be exploited are the positions of the peaks, their intensity as well as their shape and width.
EPJ Web of Conferences 155, 00002 (2017) DOI: 10.1051/epjconf/201715500002 JDN 22
Figure 5. Powder diffraction pattern. Coherently scattered neutrons produce Bragg peaks at certain 2 values.
i.e. an (hkl) plane has been attributed to every Bragg reflection, the lattice parameters of orthorhombic systems (for simplicity) can be obtained from thed values according to
d = h2
a2 +
k2
b2 +
l2
c2
−1 2
(2)
Hence, with the known monochromatic wavelength one is able to obtain the lattice parameters by measuring the scattering angles, which gives the metric of the unit cell. However, this does not yet tell how the atoms are distributed within. This information can be obtained by analyzing the integrated intensity of the Bragg reflections which is proportional to the nuclear [Eq. (3)] or the magnetic structure factor [Eq. (4)] depending on if nuclear or magnetic scattering is concerned.
FN(Q)=
i
biexp(iQri)exp
−Bisin
2
2
(3)
FM(Q)= i
ifi(Q)exp(iQri)exp
−Bisin
2
2
(4)
Here the sum is taken over alliatoms in the unit cell,bi is the scattering length,ri is the vector containing the fractional coordinates and fi is the magnetic form factor of atomi, with magnetic momenti.
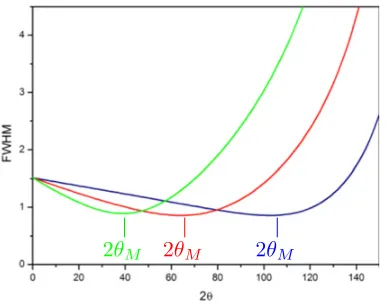
Finally, real structure properties like stress and strain can be obtained from the shape and width of the Bragg reflections. Therefore, in order to derive the effects coming from the sample one must know the instrumental contribution to the peak profile, which depends on many factors, e.g. the size of the neutron source and the monochromator, the system of slits and collimators, the monochromator take-off angle, etc. All these instrument-related factors are expressed with the empirical Cagliotti formula giving the full width at half maximum (FWHM) of a peak as a function of the scattering angle.
FWHM2=
EPJ Web of Conferences 155, 00002 (2017) DOI: 10.1051/epjconf/201715500002 JDN 22
Figure 6. Resolution curve according to the Cagliotti formula for three different arbitrary instrument configurations.
The resulting resolution curve is sketched in Fig. 6 for three different instrument configurations. It has to be pointed out that the resolution function minimum is always located at the scattering angle corresponding to the monochromator take-off angle resulting from a focusing effect combining secondary and tertiary divergence.
Knowing which parts of the diffraction pattern contain the information for which the experiment is carried out at the first place permits the choice and correct configuration of the powder diffractometer. Figure7 shows powder diffraction data on the oxypnictide iron superconductor LaO1−xFxFeAs where details both of the crystal and the magnetic structure were examined. In this system a structural phase transition takes place from a tetragonal to an orthorhombic crystal structure upon F-doping or decreasing temperature. The phase transition is manifest in the splitting of the tetragonal (220) reflection into the orthorhombic (400) and (040) reflections due to the splitting of the a andb lattice constants. In order to be able to resolve the double-peak feature in Fig. 7(a) the best possible resolution is needed for which this part of the experiment was carried out at the high-resolution neutron powder diffractometer D2B (ILL). In order to analyze the magnetic structure integrated magnetic Bragg intensities have to be collected which can be related to the magnetic moment alignment according to Eq. (4). Due to the relatively weak intensity of the magnetic reflections (marked by arrows) and due to the fact that the resolution plays a minor role, when integrated intensities have to be measured, such kind of experiment is best done on a high-flux diffractometer. But what exactly are the differences between the two kinds?
First of all, as pointed out above, the resolution curve has its minimum at the monochromator take-off angle 2M. Therefore, the investigation of magnetic reflections, which usually occur at small 2values due to the magnetic form factor decay, would benefit from a small 2M, while a large take-off angle would provide a good resolution over a wide range of the diffraction pattern (see blue curve in Fig.6). Besides this the take-off angle has another effect. By considering the derivation of the Bragg’s law with respect to the scattering angle=M [Eq. (6)] it can be seen that an increase in the take-off angle goes alongside with a decrease in the selected wavelength band/and vice versa.
=McotM (6)
EPJ Web of Conferences 155, 00002 (2017) DOI: 10.1051/epjconf/201715500002 JDN 22
Figure 7. (a) Focus on the (220)T reflection which splits into the (400)O and (040)O reflections at
the structural phase transition (measured at the high-resolution diffractometer D2B (ILL). (b) Powder diffraction pattern measured at the high-flux diffractometer D20 (ILL). Weak magnetic reflections indicated by arrows are observed at small diffraction angles. Taken from [1].
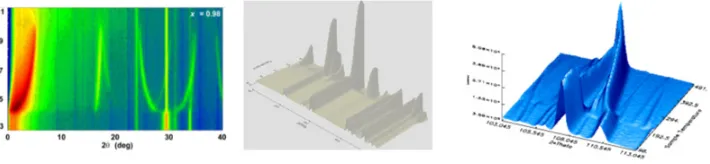
Figure 8. Thermodiffraction as a method to clearly reveal structural or magnetic phase transitions.
To further increase the resolution Soller collimators should be used wherever possible. Especially a collimation before the detector removes the dependence of the resolution on the sample size. On the other hand, if the flux is to be maximized no collimation should be used as this cuts off parts of the neutron beam. Furthermore, a large vertically focusing monochromator with a large mosaic spread increase the flux at the sample where the latter is also related to Eq. (6). As the monochromator reflectivity increases proportionally to3 larger wavelengths provide more flux. Finally, the more sample is in the neutron beam, the higher is the scattered intensity. By optimizing all those parameters a diffraction pattern at the high-flux diffractometer D20 can be recorded in a matter of seconds allowing a collection as a function of e.g. temperature in order to trace phase transitions (see Fig.8for examples).
3.2 Single-crystal diffraction
EPJ Web of Conferences 155, 00002 (2017) DOI: 10.1051/epjconf/201715500002 JDN 22
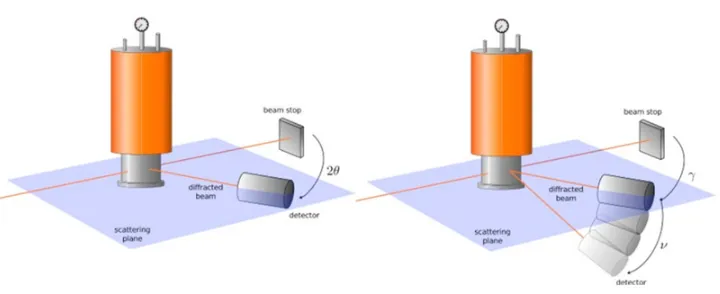
Figure 9. Left panel: Sketch of the normal beam equatorial geometry with the sample within a cryostat. Right panel: Normal beam geometry with lifting arm detector.
experiments fail to provide useful results. Measuring an (hkl) reflection is done by positioning the detector at the correct 2value (that is why the lattice parameters must be known) and rotating the sample about a vertical axis, which is called the angle given that the (hkl) vector to be measured lies within the plane defined by the incident and the scattered beam. This geometry is called the normal-beam equatorial mode. When heavy sample environments like cryomagnets are used the tilting angle of the sample is very limited. The minimal tilt geometry permits to tilt the sample table with the sample environment by a few degrees. This also means that the sample alignment needs to be quite accurate in order to bring those (hkl) vectors which are intended to be measured within the equatorial plane (this is why the orientation of the crystal axes must be known). Another possibility is to move the detector out of the equatorial plane, which is called a lifting arm detector and is depicted in the right panel of Fig.9. For a complete overview of the different single-crystal diffraction geometries, the instrument design and beam optics the interested reader is referred to [3].
The movement of the detector out of the scattering plane is expressed by the angleν, while the movement within the scattering plane is denoted(forν=0equals to 2). With this option scattering vectors not too far away from the equatorial plane can still be reached and more reflections are available for the subsequent structure refinement.
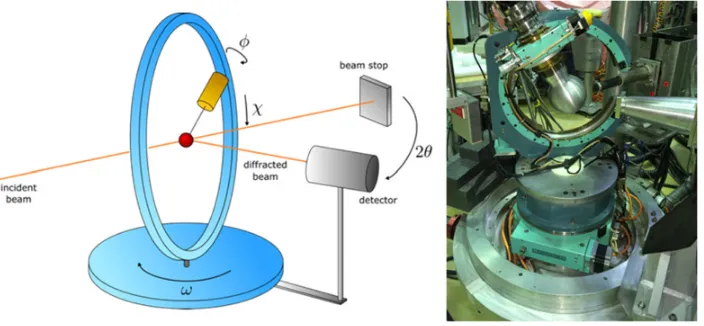
Sample environments that can be mounted within a Eulerian cradle bear the advantage that the sample can be rotated around two more angles permitting to reach the majority of reciprocal space points within the Ewald sphere. In a so called 4-circle diffractometer the anglerotates the sample around a horizontal axis and the angleis the rotation around the sample axis (Fig.10).
In a single-crystal diffraction experiment the sample alignment is almost as important as the data collection itself. The sample should not precess while any of the three angles,,
is being adjusted while being in the center of the neutron beam. The typical experimental procedure is then to find two linearly independent (hkl) reflections which provide the ability to calculate the orientation matrix UB [4]. This matrix relates the sample lattice parameters and the diffractometer axes and allows therefore to calculate the diffractometer angles for any (hkl) reflection and hence to position the sample accordingly. The UB matrix is usually refined after measuring a set of 20–30 reflections in order to achieve a correct positioning within a large 2range and for different regions within the reciprocal lattice [e.g. measuring hundreds of (hk0) reflections does not allow the refinement of the UB matrix entries forl=0
EPJ Web of Conferences 155, 00002 (2017) DOI: 10.1051/epjconf/201715500002 JDN 22
Figure 10. Left panel: Sketch of a Eulerian cradle for an experiment in the 4-circle mode. Right panel: 4-circle cryostat at the D10 diffractometer (ILL).
conditions. Measuring a Bragg reflection consists in a rocking scan around the reflection position, the observed peak is then integrated which yields an observation proportional to the square of the structure factor. In order to improve statistics symmetry-equivalent reflections are merged and averaged. The set of integrated intensities is then used to refine a magnetic or structural model by a least-squares algorithm.
Of course, other types of experiments can be carried out on a single-crystal diffractometer, e.g. phase transitions that manifest themselves by a change in position or intensity of a certain family of (hkl) reflections can easily be traced. Sometimes the interesting information is hidden between the Bragg peaks for which a volumetric mapping of the reciprocal space is necessary in order to reveal diffuse scattering and reflection profiles.
3.3 Laue diffraction
The most important feature of Laue diffraction is the use of a white neutron beam, i.e. a large wavelength band is used instead of selecting a wavelength by a monochromator. Furthermore, the single-crystal sample is kept fixed at the center of the Laue diffractometer. All (hkl) reflections which lie between the two Ewald spheres with the radii 1/max and 1/min(Ewald construction in reciprocal space) can be measured. In other words due the large wavelength band there is always an adequate wavelength which is able to produce a Bragg peak according to Eq. (1) after being scattered at a randomly oriented (hkl) lattice plane. In order to measure a large part of the reciprocal space neutron-sensitive films or cameras can be placed cylindrically around the sample leaving just a small hole for the incoming beam. Laue diffraction allows the quick alignment of single crystals for subsequent structure determination experiments at a single-crystal diffractometer as described in Sect. 2.2. Furthermore, due to the rather fast acquisition of a large portion of reciprocal space magnetic or structural phase transitions can be investigated as a function of temperature (or pressure etc.) by tracing the Laue spots of certain (hkl) reflections.
4. Polarized neutrons
EPJ Web of Conferences 155, 00002 (2017) DOI: 10.1051/epjconf/201715500002 JDN 22
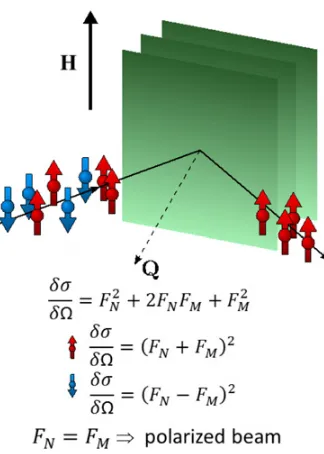
Figure 11. Polarizing crystal producing a polarized neutron beam.
nuclear interaction is only neutron spin dependent, if the scattering nucleus itself has a spin and if the spins of the nuclei are ordered, which only applies to extreme conditions like very low temperatures in the mK region of very high magnetic fields. Therefore, nuclear scattering can be considered as spin independent. In contrast, electron spins are much more easily ordered leading to an important neutron spin dependence of the magnetic scattering. Polarized neutron diffraction is used to determine precise magnetic structure factors by the
flipping ratio method. Analyzing the polarization state of the neutron after the scattering
process offers the possibility to determine the type of interaction and the configuration of magnetic moments in a magnetically ordered compound.
4.1 Production of a polarized neutron beam
Different techniques are used to achieve a neutron beam in which the majority of neutrons have the same spin direction, where the polarization is defined as
P = I+−I−
I++I− (7)
Important factors which have to be taken into account are e.g. the desired degree of polarization, the available space at the instrument and the budget.
EPJ Web of Conferences 155, 00002 (2017) DOI: 10.1051/epjconf/201715500002 JDN 22
Figure 12.3He spin filter exploiting the fact that optically pumped3He ions have a strongly
neutron-spin-dependent absorption cross section.
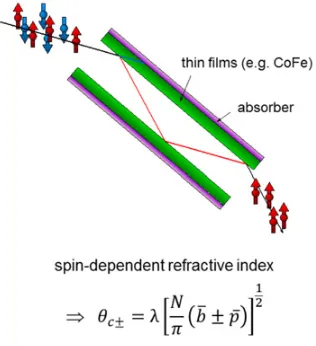
Figure 13. Sketch of a neutron supermirror which polarizes a neutron beam due to the spin-dependent refractive indexc±.
Not only the scattering cross section is spin dependent, but also the absorption cross section. In this context the3He nucleus turns out to be ideal as it is almost transparent for one neutron spin state and highly absorbing for the other. In such spin filters3He gas under
a certain pressure optimizing the transmission-to-absorption ratio is optically pumped by a laser in order to have only one3He spin state, which will therefore only absorb one of the
neutron spin states (Fig.12).
Another method (among others) is based on the spin-dependent refractive index when neutrons are scattered at thin films of e.g. CoFe under small angles. While e.g. spin-up neutrons undergo total reflection between two limiting walls and therefore get transported, spin-down neutrons penetrate the thin film and are absorbed by the shielding of the guide. A sketch of a so called neutron supermirror is shown in Fig.13.
4.2 Guiding the polarization
EPJ Web of Conferences 155, 00002 (2017) DOI: 10.1051/epjconf/201715500002 JDN 22
Figure 14. Left: adiabatic rotation of the neutron spin due to the slow enough change of the magnetic field direction. Right: non-adiabatic transition due to the abrupt 90◦rotation of the magnetic field. The neutron spin cannot follow the field change and precesses around the new field direction.
Figure 15. Left: principle of a Cryoflipper. Neutron spins adiabatically rotate towardsH. Due to the abrupt change fromH toHthe neutron spin is effectively flipped with respect to the guide fieldH. The actual spin flip is effectuated by reversing the direction ofH. Right: principle of a Mezei flipper. By choosing the correct path length for the non-adiabatic transition the neutron spin can be caught after a 180◦rotation by a second vertical magnetic field.
guided along the beam path in so called guide fields which are of the order of a few Gauss.
Along its travel path the neutron spin precesses around the guide field with the well-defined Larmor frequencyL, which is dependent on the strength of the magnetic field H:
L=N0H (8)
where H is the neutron’s gyromagnetic ratio and 0 is the vacuum permeability. If the direction of the external magnetic field is varied slowly enough (e.g. as a function of the distanceyalong the neutron beam path), the neutron spin is able to follow the magnetic field change (see left panel of Fig.14). An empirical requirement to maintain the polarization is
L H >
10→ *H
*y <2.65H (9)
whereH is the angle between the magnetic field direction and an arbitrary axis. However, if the change of the magnetic field is too fast for the neutron spin to follow, the latter will precess around the new field direction (see right panel of Fig.14), which is a non-adiabatic transition.
4.3 Flipping the polarization
EPJ Web of Conferences 155, 00002 (2017) DOI: 10.1051/epjconf/201715500002 JDN 22
Table 1. Cross sections for polarized neutron scattering with longitudinal polarization analysis (Qx).
NSF SF
P0x N M y+M z
P0y N+M y M z
P0z N+M z M y
manipulated as well. Devices which affect the polarization of a neutron in a way that it is rotated by 180◦ are called spin flippers and use the adiabatic (left panel of Fig.15) or non-adiabatic transitions (right panel of Fig.15) explained in the previous section.
4.4 Selection rules for polarized neutrons
Polarized neutrons add additional selection rules to the general law in neutron scattering that only magnetic components perpendicular to the scattering vector contribute. Generally, nuclear scattering is a non-spin-flip (NSF) process regardless of the initial neutron polarization state. Only magnetic components perpendicular to the scattering vector (Qx by definition) are accessible in a neutron experiment. The components perpendicular to the polarization axis (y being in the scattering plane and z being the perpendicular axis of the instrument) contribute to the spin-flip (SF) channel, while those parallel to the axis of polarization scatter into the NSF channel. The method where the neutron spin is polarized along one axis and then analyzed along the same axis is called longitudinal polarization
analysis (LPA). The cross sections for the different polarizations are given in Table1. As it can be seen the analysis of the final neutron polarization is a powerful tool as it permits to separate the nuclear and the magnetic cross sections by measuring the appropriate channels. Furthermore, it is possible to gain information about the spatial configuration of the magnetic moments. Such experiments are carried out with a set of Helmholtz coils which generate a magnetic field of a desired direction at the sample position (see Sect.4.6). Even more information can be acquired when the final polarization is analyzed in all three directions for every individual initial polarization, which is called spherical polarization
analysis (SPA) and is carried out using the Cryogenic Polarization Device (CryoPAD), see
Sect.4.7.
For more information on this and the next two sections the interested reader is referred to the chapter Polarized Neutrons and Polarization Analysis by J. Schweizer in [5].
4.5 Flipping ratio method
The flipping ratio method is used for the experimental derivation of precise magnetic structure factors. Hereby, the interference between nuclear and magnetic scattering and its dependence on the neutron spin are exploited (e.g.FM =0.1FN):
I+∼(FN+FM)2=FN2 +0.2FN2 +0.01FN2 =1.21FN2 (10)
I−∼(FN−FM)2 =FN2 −0.2FN2 +0.01FN2 =0.81FN2
whereas for unpolarized neutrons:
I ∼FN2 +FM2 =FN2 +0.01FN2 =1.01FN2 (11)
EPJ Web of Conferences 155, 00002 (2017) DOI: 10.1051/epjconf/201715500002 JDN 22
structure factors are strong. The flipping ratio is defined as
R= I +
I− (12)
The collection of a large number of precise magnetic structure factors permits a more sophisticated analysis of the magnetization density by non-spherical models, e.g. the Maximum Entropy Method or the multipole description of the atomic orbitals.
Figure 16 shows the basic setup of a flipping ratio experiment. The neutron beam is polarized and monochromatized at the polarizer and the neutron spin can be flipped by turning the spin flipper on, which permits the measurement of the intensitiesI+andI−. The sample is placed within an external magnetic field in order to fully saturate the magnetic moments and especially to create a mono-domain state. Therefore, the magnetic moments all point along the vertical axis z. In a flipping ratio experiment the initial polarization of the neutrons is set only along+z or –z, i.e. by looking at Table1the only cross section to be expected is
N+Mzin the NSF channel (as no y component of the magnetic moment is present) and no
polarization analysis is necessary.
Figure 16. Sketch of a polarized neutron experiment using the flipping ratio method. The spin of the polarized neutrons can be reversed by turning on the spin flipper which is positioned between the monochromator and the sample. Therefore, the intensitiesI+andI−can be measured in order to derive the flipping ratioR=I+/I−. An analyzer is not necessary as all scattering should be non-spin-flip.
4.6 Longitudinal polarization analysis
In an LPA experiment the final polarization state of the neutrons needs to be controlled as much as the initial one. Therefore a second polarizer – or rather analyzer – and a second spin flipper are placed between the sample and the detector (Fig.17).
EPJ Web of Conferences 155, 00002 (2017) DOI: 10.1051/epjconf/201715500002 JDN 22
Figure 17. Sketches of a polarized neutron experiment with longitudinal polarization analysis. The combination of a polarizer, an analyzer and two spin flippers makes it possible to measure all four spin-state transitions.
Figure 18. Schematic setup of the CryoPAD.
turning the neutron polarization to one of the three reference axes. The interaction with the sample can be of spin-flip or non-spin-flip nature and in either case the vertical guide field between sample and analyzer will adiabatically turn the polarization towards the z axis so that e.g. only spin-up neutrons can pass the analyzer. Switching on the second flipper inverts the neutron spins and can therefore separate SF and NSF scattering.
4.7 Spherical polarization analysis
EPJ Web of Conferences 155, 00002 (2017) DOI: 10.1051/epjconf/201715500002 JDN 22
interaction with the sample. As the cross sections for different incident and final polarizations are known important information about the magnetic moment configuration in the studied system can be derived, especially chiral terms. The instrumental realization of such a task is done using the CryoPAD (Fig.18). In order to have full control of the neutron spin the sample needs to be in an absolutely magnetic field free region which is achieved by an inner Meissner shield provided by a superconducting material. In order to manipulate the neutron spin in the incident and in the scattered beam two individual magnetic fields are necessary which are supplied by a primary coil and a secondary. On the incoming and the outgoing parts of the CryoPAD nutators are positioned in which an axial guide field can be set along a direction perpendicular to the direction of motion of the neutron. The neutron spin will then adiabatically rotate towards that field direction. An outer Meissner shield prevents the superposition of the nutator field and the coils. Due to the abrupt field change at the entrance of the CryoPAD the neutron spin will non-adiabatically rotate around the new field direction. Hereby, the magnetic field is set according to the distance the neutron will travel and its wavelength in order to control the rotation angle in such a way that the neutron spin arrives at the desired polarization axis when it enters the field-free region where it stays constant. Depending on the interaction with the sample the neutron spin might be flipped or rotated. In any case by adjusting the field in the primary coil and in the outgoing nutator thex,y orzcomponent of the scattered neutron spin can be rotated to be parallel to the guide field between the analyzer and the sample. Similar to the LPA experiment a set of two spin flippers (after the monochromator and before the analyzer) is used to distinguish between the different spin-flip and non-spin-flip transitions.
Detailed information is available in the chapter Spherical Neutron Polarimetry by P.J. Brown in [5].
5. Summary
Different types of diffractometers have been elucidated throughout this chapter. Understanding the origin of their characteristics allows one to adopt the ideal instrument setup for a particular experimental task. Detailed structure analysis profits from high resolution, while weak magnetic signals are best investigated with a high neutron flux. Unfortunately, a compromise between both has to be made. Due to the statistical orientation of the crystallites in a powder no special care has to be taken for positioning the sample in comparison to single-crystal experiments, where different measuring geometries exist. Finally, it was shown that the use of polarized neutrons gives access to much more information when it comes to the investigation of magnetic materials. The analysis of the neutron spin after the scattering process allows distinguishing between nuclear and magnetic scattering and offers the possibility to draw conclusions concerning the configuration of magnetic moments within the sample.
References
[1] www.ill.fr
[2] N. Qureshi et al., Phys. Rev. B 82, 184521 (2010)
[3] U.W. Arndt, B.T.M. Willis, Single crystal diffractometry (Cambridge University Press, 1966)
[4] W.R. Busing, H.A. Levy, Acta Cryst. 22, 457 (1967)