Semantic Features Based on Word Alignments
for Estimating Quality of Text Simplification
Tomoyuki Kajiwara†andAtsushi Fujita‡ †Tokyo Metropolitan University, Tokyo, Japan
‡National Institute of Information and Communications Technology, Kyoto, Japan
[email protected],[email protected]
Abstract
This paper examines the usefulness of se-mantic features based on word alignments for estimating the quality of text simpli-fication. Specifically, we introduce seven types of alignment-based features com-puted on the basis of word embeddings and paraphrase lexicons. Through an em-pirical experiment using the QATS dataset (ˇStajner et al., 2016b), we confirm that we can achieve the state-of-the-art perfor-mance only with these features.
1 Introduction
Text simplification is the task of rewriting com-plex text into a simpler form while preserving its meaning. Systems that automatically pursue this task can potentially be used for assisting reading comprehension of less language-competent peo-ple, such as learners (Petersen and Ostendorf,
2007) and children (Belder and Moens, 2010). Such systems would also improve the performance of other natural language processing tasks, such as information extraction (Evans,2011) and machine translation (MT) (ˇStajner and Popovi´c,2016).
Similarly to other text-to-text generation tasks, such as MT and summarization, the outputs of text simplification systems have been evaluated sub-jectively by humans (Wubben et al.,2012; ˇStajner
et al., 2014) or automatically by comparing with handcrafted reference texts (Specia,2010;Coster and Kauchak,2011;Xu et al.,2016). However, the former is costly and not replicable, and the latter has achieved only a low correlation with human evaluation.
On the basis of this backdrop, Quality Estima-tion (QE) (Specia et al.,2010), i.e., automatic eval-uation without reference, has been drawing much attention in the research community. In the shared
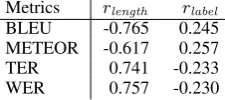
[image:1.595.360.473.223.273.2]Metrics rlength rlabel BLEU -0.765 0.245 METEOR -0.617 0.257 TER 0.741 -0.233 WER 0.757 -0.230
Table 1: The QATS training data shows that typ-ical MT metrics are strongly biased by the length difference between original and simple sentences (rlength), while they are less correlated with the
manually-labeled quality (rlabel).
task on quality assessment for text simplification (QATS),1 two tasks have been addressed (ˇStajner
et al.,2016b). One is to estimate a real-value qual-ity score for given sentence pair, while the other is to classify given sentence pair into one of the three classes (good,ok, andbad). In the classifica-tion task of the QATS workshop, systems based on deep neural networks (Paetzold and Specia,
2016a) and MT metrics (ˇStajner et al.,2016a) have achieved the best performance. However, deep neural networks are rather unstable because of the difficulty of training on a limited amount of data; for instance, the QATS dataset offers only 505 sen-tence pairs for training. MT metrics are incapable of properly capturing deletions that are prevalent in text simplification (Coster and Kauchak,2011), as they are originally designed to gauge seman-tic equivalence. In fact, as shown in Table1, well-known MT metrics are strongly biased by the length difference between original and simple sen-tences, even though it is rather unrelated with the quality of text simplification assessed by humans. In order to properly account for the surface-level inequivalency occurring in text simplifica-tion, we examine semantic similarity features based on word embeddings and paraphrase lexi-cons. Unlike end-to-end training with deep neural networks, we quantify word-level semantic
corre-1http://qats2016.github.io/shared.html
spondences using two pcompiled external re-sources: (a) word embeddings learned from large-scale monolingual data and (b) a large-large-scale para-phrase lexicon. Using the QATS dataset, we em-pirically demonstrate that a supervised classifier trained upon such features achieves good perfor-mance in the classification task.
2 Semantic Features Based on Word Alignments
We bring a total of seven types of features that are proven useful for the similar task, i.e., finding corresponding sentence pairs within En-glish Wikipedia and Simple EnEn-glish Wikipedia (Hwang et al., 2015; Kajiwara and Komachi,
2016). Specifically, we assume that some of these features are useful to capture inequivalency be-tween original sentence and its simplified version introduced during simplification, such as lexical paraphrases and deletion of words and phrases.
Throughout this section, original sentence and its simplified version are referred to as x and y, respectively.
2.1 AES: Additive Embeddings Similarity Given two sentences,xandy, AES between them is computed as follows.
AES(x, y) = cos ∑|x|
i=1
⃗xi, |y|
∑
j=1
⃗yj
(1)
where each sentence is vectorized with the sum of the word embeddings of its component words,
⃗xi and⃗yj, assuming the additive compositionality (Mikolov et al.,2013).
2.2 AAS: Average Alignment Similarity
AAS (Song and Roth, 2015) averages the co-sine similarities between all pairs of words within given two sentences,xandy, calculated over their embeddings.
AAS(x, y) = |x||y|1
|x|
∑
i=1 |y|
∑
j=1
cos(⃗xi, ⃗yj) (2)
2.3 MAS: Maximum Alignment Similarity
AAS inevitably involves noise, as many word pairs are semantically irrelevant to each other.
MAS(Song and Roth,2015) reduces this kind of
noise by considering only the best word alignment for each word in one sentence as follows.
MAS(x, y) = 1 |x|
|x|
∑
i=1
max
j cos(⃗xi, ⃗yj) (3)
AsMASis asymmetric, we calculate it for each direction, i.e.,MAS(x, y)andMAS(y, x), unlike
Kajiwara and Komachi(2016) who has averaged these two values.
2.4 HAS: Hungarian Alignment Similarity
AASandMASdeal with many-to-many and one-to-many word alignments, respectively. On the other hand,HAS(Song and Roth,2015) is based on one-to-one word alignments.
The task of identifying the best one-to-one word alignmentsHis regarded as a problem of bipartite graph matching, where the two sets of vertices re-spectively comprise words within each sentencex
andy, and the weight of a edge betweenxiandyj is given by the cosine similarity calculated over their word embeddings. Given H identified us-ing the Hungarian algorithm (Kuhn, 1955), HAS
is computed by averaging the similarities between embeddings of the aligned pairs of words.
HAS(x, y) = |H|1 ∑
(i,j)∈H
cos(⃗xi, ⃗yj) (4)
where |H| = min(|x|,|y|), as H contains only one-to-one word alignments.
2.5 WMD: Word Mover’s Distance
WMD (Kusner et al., 2015) is a special case of the Earth Mover’s Distance (Rubner et al.,1998), which solves the transportation problem of words between two sentences represented by a bipartite graph.2 Letn be the vocabulary size of the
lan-guage,WMDis computed as follows.
WMD(x, y) = min∑n
u=1 n
∑
v=1
Auveud(⃗xu, ⃗yv) (5)
subject to :
n
∑
v=1
Auv= |x|1 freq(xu, x)
n
∑
u=1
Auv= |y|1 freq(yv, y)
2Note that the vertices in the graph represent the word
whereAuv is a nonnegative weight matrix repre-senting the flow from a wordxuinxto a wordyv iny,eud(·,·)the Euclidean distance between two word embeddings, andfreq(·,·)the frequency of a word in a sentence.
2.6 DWE: Difference of Word Embeddings We also introduce the difference between sentence embeddings so as to gauge their differences in terms of meaning and simplicity. As the represen-tation of a sentence, we used the averaged word embeddings (Adi et al.,2017).
DWE(x, y) = |x|1
|x|
∑
i=1
⃗xi−|y|1 |y|
∑
j=1
⃗yj (6)
2.7 PAS: Paraphrase Alignment Similarity
PAS(Sultan et al.,2014,2015) is computed based on lexical paraphrases. This feature has been proven useful in the semantic textual similarity task of SemEval-2015 (Agirre et al.,2015).
PAS(x, y) = PA(x, y|x|) + PA(+|y| y, x) (7)
PA(x, y) =
|x|
∑
i=1
{
1 ∃j:xi⇔yj ∈y
0 otherwise
wherexi ⇔ yj holds if and only if the word pair
(xi, yj)is included in a given paraphrase lexicon. 3 Experiment
The usefulness of the above features was evaluated through an empirical experiment using the QATS dataset (ˇStajner et al.,2016b).
3.1 Data
The QATS dataset consists of 505 and 126 sen-tence pairs for training and test, respectively, where each pair is evaluated from four different aspects: Grammaticality, Meaning preservation, Simplicity, and Overall quality. Evaluations are given by one of the three classes: good, ok, and bad.
We used two pre-compiled external resources to compute our features. One is the pre-trained 300-dimensional CBOW model3 to compute the
fea-tures based on word embeddings, while the other is PPDB 2.0 (Pavlick et al.,2015)4for PAS.
3https://code.google.com/archive/p/
word2vec/
4http://paraphrase.org/
3.2 Evaluation Metrics
Each system is evaluated by the three metrics as in the QATS classification task (ˇStajner et al.,
2016b): Accuracy (A), Mean Absolute Error (E) and Weighted F-score (F). To compute Mean Ab-solute Error, class labels were converted into three equally distant numeric scores retaining their rela-tion, i.e.,good= 1,ok= 0.5, andbad= 0.
3.3 Baseline Systems
As the baseline, we employed four types of sys-tems from the QATS workshop (ˇStajner et al.,
2016b): two typical baselines and two top-ranked systems. “Majority-class” labels all the sentence pairs with the most frequent class in the training data. “MT-baseline” combines BLEU (Papineni et al., 2002), METEOR (Lavie and Denkowski,
2009), TER (Snover et al.,2006), and WER ( Lev-enshtein, 1966), using a support vector machine (SVM) classifier.
SimpleNets (Paetzold and Specia, 2016a) has two different forms of deep neural network ar-chitectures: multi-layer perceptron MLP) and recurrent neural network (SimpleNets-RNN). SimpleNets-MLP uses seven features of each sentence: the number of characters, tokens, and word types, 5-gram language model probabil-ities estimated on the basis of either SUBTLEX (Brysbaert and New, 2009), SubIMDB ( Paet-zold and Specia, 2016b), Wikipedia, and Simple Wikipedia (Kauchak, 2013). SimpleNets-RNN, which does not require such feature engineering, uses embeddings of wordN-grams.
SMH (ˇStajner et al., 2016a) has two types of classifiers: logistic classifier (SMH-IBk/Logistic) and random forest classifier (SMH-RandForest, SMH-RandForest-b). Both are trained relying on the automatic evaluation metrics for MT, such as BLEU, METEOR, and TER, in combination with the QE features for MT (Specia et al.,2013).
Instead of reimplementing the above baseline systems, we excerpted their performance scores from (ˇStajner et al.,2016b).
3.4 Systems with Proposed Features
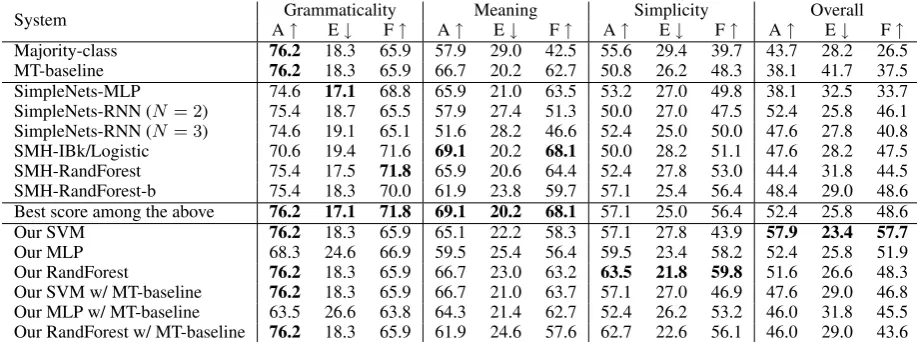
de-System AGrammaticality↑ E↓ F↑ A↑ MeaningE↓ F↑ A↑SimplicityE↓ F↑ A↑ OverallE↓ F↑ Majority-class 76.2 18.3 65.9 57.9 29.0 42.5 55.6 29.4 39.7 43.7 28.2 26.5 MT-baseline 76.2 18.3 65.9 66.7 20.2 62.7 50.8 26.2 48.3 38.1 41.7 37.5 SimpleNets-MLP 74.6 17.1 68.8 65.9 21.0 63.5 53.2 27.0 49.8 38.1 32.5 33.7 SimpleNets-RNN (N = 2) 75.4 18.7 65.5 57.9 27.4 51.3 50.0 27.0 47.5 52.4 25.8 46.1 SimpleNets-RNN (N = 3) 74.6 19.1 65.1 51.6 28.2 46.6 52.4 25.0 50.0 47.6 27.8 40.8 SMH-IBk/Logistic 70.6 19.4 71.6 69.1 20.2 68.1 50.0 28.2 51.1 47.6 28.2 47.5 SMH-RandForest 75.4 17.5 71.8 65.9 20.6 64.4 52.4 27.8 53.0 44.4 31.8 44.5 SMH-RandForest-b 75.4 18.3 70.0 61.9 23.8 59.7 57.1 25.4 56.4 48.4 29.0 48.6 Best score among the above 76.2 17.1 71.8 69.1 20.2 68.1 57.1 25.0 56.4 52.4 25.8 48.6 Our SVM 76.2 18.3 65.9 65.1 22.2 58.3 57.1 27.8 43.9 57.9 23.4 57.7
Our MLP 68.3 24.6 66.9 59.5 25.4 56.4 59.5 23.4 58.2 52.4 25.8 51.9 Our RandForest 76.2 18.3 65.9 66.7 23.0 63.2 63.5 21.8 59.8 51.6 26.6 48.3 Our SVM w/ MT-baseline 76.2 18.3 65.9 66.7 21.0 63.7 57.1 27.0 46.9 47.6 29.0 46.8 Our MLP w/ MT-baseline 63.5 26.6 63.8 64.3 21.4 62.7 52.4 26.2 53.2 46.0 31.8 45.5 Our RandForest w/ MT-baseline 76.2 18.3 65.9 61.9 24.6 57.6 62.7 22.6 56.1 46.0 29.0 43.6
Table 2: Results on QATS classification task. The best scores of each metric are highlighted in bold. Scores other than ours are excerpted from ˇStajner et al.(2016b).
Feature set C γ Grammaticality Meaning Simplicity Overall
ALL 1.0 0.1 76.2 65.1 57.1 57.9
-AES 1.0 0.1 76.2 65.1 57.1 57.1
-MAS(original,simple) 0.1 0.1 76.2 57.9 55.6 56.4
-MAS(simple,original) 1.0 0.1 76.2 64.3 57.1 54.8
-PAS 0.1 0.1 76.2 57.9 55.6 53.2
-DWE 0.01 1.0 76.2 57.9 55.6 51.6
-WMD 0.01 0.1 76.2 57.9 55.6 46.8
-AAS 0.1 0.1 76.2 57.9 55.6 45.2
[image:4.595.71.530.62.233.2]-HAS 0.01 0.01 76.2 57.9 55.6 35.7
Table 3: Ablation analysis on accuracy. Features are in descending order of overall accuracy.
termined through 5-fold cross validation using the training data, regarding accuracy in terms of over-all quality as the objective.
For the SVM classifier, we used the RBF kernel. The trinary classification was realized by means of the one-versus-the-rest strategy. For a given set of features, we examined all the combinations of hyper-parameters amongC∈ {0.01,0.1,1.0}and
γ ∈ {0.01,0.1,1.0}; for the full set of features,
C= 1.0andγ = 0.1were chosen.
As for the MLP classifier, among 1 to 3 lay-ers with all the combinations of dimensionality among{100,200,300,400,500}and “ReLu” for the activation function among {Logistic, tanh, ReLu}, the 2-layer one with 200 × 200 dimen-sionality was optimal. We used Adam (Kingma and Ba,2015) as the optimizer.
For the RandForest classifier, we examined all the combinations of the following three hyper-parameters: {10,50,100,500,1000} for num-ber of trees,{5,10,15,20,∞}for the maximum depth of each tree, and {1,5,10,15,20} for the minimum number of samples at leaves. The op-timal combination for the full set of features was
(500,15,1).
3.5 Results
Experimental results are shown in Table2. The SVM classifier based on our features greatly out-performed the state-of-the-art methods in terms of overall quality. The RandForest classifier some-how achieved the best simplicity scores ever, even though we had optimized the system with respect to the accuracy of overall quality. As we ex-pected, MLP did not beat the other two classi-fiers, presumably due to the scarcity of the train-ing data. The bottom three rows reveal that the performance in terms of overall quality was de-teriorated when MT-baseline features were incor-porated on top of our feature set. This suggests that word embeddings are superior to surface-level processing in finding corresponding words within sentence pairs.
Focusing on the overall quality, we conducted an ablation analysis of the SVM classifier. The analysis revealed, as shown in Table3, thatHAS,
meaning-Original Whileselfwas nothistoriansmanipulatedconcurthat the result, the voting pro- it-cess was neither free nor secret.
Simple Mostnotfixedhistorians,butthe voting process was nei-agreethat the result was ther free nor secret.
Hungarian Alignment
[image:5.595.73.291.65.153.2](while, but), (concur, agree), (itself, most), (manipulated, fixed), and identical word pairs.
Table 4: An example of word alignment. Differ-ences between the original and simplified versions are presented in bold. This is a sentence pair from good class on overall quality. HASusing word-level similarity reaches 0.85, while BLEU is 0.54.
Feature rlength rlabel
AES -0.661 0.185
AAS -0.335 0.318
MAS(original,simple) -0.817 0.226
MAS(simple,original) 0.092 -0.090
HAS 0.061 -0.050
WMD 0.788 -0.215
PAS -0.120 -0.039
Table 5: Correlation between each feature and the difference of sentence length and the manually-labeled quality. Note that DWE cannot be in-cluded, as it is not a scalar value but the differential vector between original and simplified sentences.
preserving rewritings from original sentence to simple one. On the other hand, as exemplified in Table4, HASand some other features can de-tect the linkages between complex words and their simpler counterparts. As a result of properly cap-turing the alignments between such lexical para-phrases, our system successfully classified this sentence intogoodin terms of overall quality.
We expected thatAAScould yield noise, as it involves irrelevant pairs of words, but in fact, it contributed to the QATS task. We speculate that it helps to evaluate the appropriateness of substitut-ing a word to other one considersubstitut-ing the semantic matching with the given context, as in lexical sim-plification (Biran et al.,2011) and lexical substitu-tion (Melamud et al.,2015;Roller and Erk,2016;
Apidianaki,2016).
The contribution of WMD was expected as it was proven effective in the sentence alignment task of English Wikipedia and Simple English Wikipedia (Kajiwara and Komachi,2016).
Table5 shows that some of our semantic sim-ilarity features are also strongly biased by the length difference between original and simple sen-tences, as MT metrics (cf. Table1). Nonetheless,
HASwas not biased by the length difference al-most at all, andAASandWMDhighly correlated with the manually-labeled quality.
4 Conclusions
We presented seven types of semantic similarity features based on word alignments for quality esti-mation of text simplification. Unlike existing MT metrics, our features can flexibly deal with word alignments, taking deletions and paraphrases into account. Our SVM classifier based on these fea-tures achieved the best performance on the QATS dataset.
Acknowledgments
This work was carried out when the first author was taking up an internship at NICT, Japan. We are deeply grateful to the anonymous reviewers for their insightful comments and suggestions. This work was conducted under the program “Promo-tion of Global Communica“Promo-tions Plan: Research, Development, and Social Demonstration of Mul-tilingual Speech Translation Technology” of the Ministry of Internal Affairs and Communications (MIC), Japan.
References
Yosshi Adi, Einat Kermany, Yonatan Belinkov, Ofer
Lavi, and Yoav Goldberg. 2017. Fine-grained
Analysis of Sentence Embeddings Using Auxiliary
Prediction Tasks. In International Conference on
Learning Representations.
Eneko Agirre, Carmen Banea, Claire Cardie, Daniel Cer, Mona Diab, Aitor Gonzalez-Agirre, Weiwei Guo, Inigo Lopez-Gazpio, Montse Maritxalar, Rada Mihalcea, German Rigau, Larraitz Uria, and Janyce Wiebe. 2015. SemEval-2015 Task 2: Semantic Tex-tual Similarity, English, Spanish and Pilot on Inter-pretability. InProceedings of the 9th International Workshop on Semantic Evaluation. pages 252–263.
Marianna Apidianaki. 2016. Vector-space models for
PPDB paraphrase ranking in context. In
Proceed-ings of the 2016 Conference on Empirical Methods in Natural Language Processing. pages 2028–2034.
Jan De Belder and Marie-Francine Moens. 2010. Text
Simplification for Children. In Proceedings of
the SIGIR Workshop on Accessible Search Systems. pages 19–26.
Or Biran, Samuel Brody, and Noemie Elhadad. 2011. Putting it Simply: a Context-Aware Approach to
[image:5.595.94.267.243.323.2]Annual Meeting of the Association for Computa-tional Linguistics: Human Language Technologies. pages 496–501.
Marc Brysbaert and Boris New. 2009. Moving beyond Kuˇcera and Francis: A Critical Evaluation of Cur-rent Word Frequency Norms and the Introduction of a New and Improved Word Frequency Measure
for American English. Behavior Research Methods
41(4):977–990.
William Coster and David Kauchak. 2011. Simple En-glish Wikipedia: A New Text Simplification Task. In Proceedings of the 49th Annual Meeting of the Association for Computational Linguistics: Human Language Technologies. pages 665–669.
Richard J. Evans. 2011. Comparing methods for
the syntactic simplification of sentences in
informa-tion extracinforma-tion. Literary and Linguistic Computing
26(4):371–388.
William Hwang, Hannaneh Hajishirzi, Mari Ostendorf, and Wei Wu. 2015. Aligning Sentences from
Stan-dard Wikipedia to Simple Wikipedia. In
Proceed-ings of the 2015 Conference of the North Ameri-can Chapter of the Association for Computational Linguistics: Human Language Technologies. pages 211–217.
Tomoyuki Kajiwara and Mamoru Komachi. 2016. Building a Monolingual Parallel Corpus for Text Simplification Using Sentence Similarity Based on
Alignment between Word Embeddings. In
Proceed-ings of the 26th International Conference on Com-putational Linguistics. pages 1147–1158.
David Kauchak. 2013. Improving Text Simplifica-tion Language Modeling Using Unsimplified Text
Data. In Proceedings of the 51st Annual Meeting
of the Association for Computational Linguistics. pages 1537–1546.
Diederik P. Kingma and Jimmy Ba. 2015. Adam: A
Method for Stochastic Optimization. In
Proceed-ings of the 3rd International Conference on Learn-ing Representations.
Harold W. Kuhn. 1955. The Hungarian Method for
the Assignment Problem. Naval Research Logistics
Quarterly2:83–97.
Matt Kusner, Yu Sun, Nicholas Kolkin, and Kilian Weinberger. 2015. From Word Embeddings To
Doc-ument Distances. In Proceedings of The 32nd
In-ternational Conference on Machine Learning. pages 957–966.
Alon Lavie and Michael Denkowski. 2009. The ME-TEOR Metric for Automatic Evaluation of Machine
Translation. Machine Translation23(2-3):105–115.
Vladimir Iosifovich Levenshtein. 1966. Binary Codes Capable of Correcting Deletions, Insertions and
Re-versals. Soviet Physics Doklady10(8):707–710.
Oren Melamud, Omer Levy, and Ido Dagan. 2015. A Simple Word Embedding Model for Lexical Substi-tution. InProceedings of the 1st Workshop on Vector Space Modeling for Natural Language Processing. pages 1–7.
Tomas Mikolov, Ilya Sutskever, Kai Chen, Greg S Cor-rado, and Jeff Dean. 2013. Distributed Representa-tions of Words and Phrases and Their Composition-ality. InAdvances in Neural Information Processing Systems. pages 3111–3119.
Gustavo H. Paetzold and Lucia Specia. 2016a. Sim-pleNets: Evaluating Simplifiers with
Resource-Light Neural Networks. In LREC 2016 Workshop
& Shared Task on Quality Assessment for Text Sim-plification. pages 42–46.
Gustavo H. Paetzold and Lucia Specia. 2016b. Un-supervised Lexical Simplification for Non-Native
Speakers. In Proceedings of the Thirtieth AAAI
Conference on Artificial Intelligence. pages 3761– 3767.
Kishore Papineni, Salim Roukos, Todd Ward, and Wei-Jing Zhu. 2002. BLEU: a Method for Automatic
Evaluation of Machine Translation. InProceedings
of 40th Annual Meeting of the Association for Com-putational Linguistics. pages 311–318.
Ellie Pavlick, Pushpendre Rastogi, Juri Ganitkevitch, Benjamin Van Durme, and Chris Callison-Burch. 2015. PPDB 2.0: Better paraphrase ranking, fine-grained entailment relations, word embeddings, and style classification. InProceedings of the 53rd An-nual Meeting of the Association for Computational Linguistics and the 7th International Joint Confer-ence on Natural Language Processing. pages 425– 430.
Sarah E. Petersen and Mari Ostendorf. 2007. Text Sim-plification for Language Learners: A Corpus
Anal-ysis. In Proceedings of the Speech and Language
Technology in Education Workshop. pages 69–72.
Stephen Roller and Katrin Erk. 2016. PIC a Different Word: A Simple Model for Lexical Substitution in
Context. InProceedings of the 2016 Conference of
the North American Chapter of the Association for Computational Linguistics: Human Language Tech-nologies. pages 1121–1126.
Yossi Rubner, Carlo Tomasi, and Leonidas J. Guibas. 1998. A Metric for Distributions with Applications to Image Databases. InProceedings of the Sixth In-ternational Conference on Computer Vision. pages 59–66.
Yangqiu Song and Dan Roth. 2015. Unsupervised Sparse Vector Densification for Short Text
Simi-larity. In Proceedings of the 2015 Conference of
the North American Chapter of the Association for Computational Linguistics: Human Language Tech-nologies. pages 1275–1280.
Lucia Specia. 2010. Translating from Complex to Sim-plified Sentences. InProceedings of the 9th Interna-tional Conference on ComputaInterna-tional Processing of the Portuguese Language. pages 30–39.
Lucia Specia, Dhwaj Raj, and Marco Turchi. 2010. Machine Translation Evaluation versus Quality
Es-timation.Machine Translation24(1):39–50.
Lucia Specia, Kashif Shah, Jose G.C. de Souza, and Trevor Cohn. 2013. QuEst - A translation quality
es-timation framework. InProceedings of the 51st
An-nual Meeting of the Association for Computational Linguistics. pages 79–84.
Md Arafat Sultan, Steven Bethard, and Tamara Sum-ner. 2014. Back to Basics for Monolingual Align-ment: Exploiting Word Similarity and Contextual
Evidence. Transactions of the Association for
Com-putational Linguistics2:219–230.
Md Arafat Sultan, Steven Bethard, and Tamara
Sum-ner. 2015. DLS@CU: Sentence Similarity from
Word Alignment and Semantic Vector Composition. InProceedings of the 9th International Workshop on Semantic Evaluation. pages 148–153.
Sanja ˇStajner, Ruslan Mitkov, and Horacio Saggion. 2014. One Step Closer to Automatic Evaluation
of Text Simplification Systems. In Proceedings of
the 3rd Workshop on Predicting and Improving Text Readability for Target Reader Populations. pages 1– 10.
Sanja ˇStajner and Maja Popovi´c. 2016. Can Text
Sim-plification Help Machine Translation? Baltic
Jour-nal of Modern Computing4(2):230–242.
Sanja ˇStajner, Maja Popovi´c, and Hanna B´echara. 2016a. Quality Estimation for Text Simplification. InLREC 2016 Workshop & Shared Task on Quality Assessment for Text Simplification. pages 15–21. Sanja ˇStajner, Maja Popovi´c, Horacio Saggion,
Lu-cia SpeLu-cia, and Mark Fishel. 2016b. Shared Task on Quality Assessment for Text Simplification. In
LREC 2016 Workshop & Shared Task on Quality As-sessment for Text Simplification. pages 22–31. Sander Wubben, Antal van den Bosch, and Emiel
Krahmer. 2012. Sentence Simplification by
Mono-lingual Machine Translation. InProceedings of the
50th Annual Meeting of the Association for Compu-tational Linguistics. pages 1015–1024.
Wei Xu, Courtney Napoles, Ellie Pavlick, Quanze Chen, and Chris Callison-Burch. 2016. Optimizing Statistical Machine Translation for Text
Simplifica-tion. Transactions of the Association for