R E S E A R C H A R T I C L E
Open Access
Computational analysis identifies a sponge
interaction network between long non-coding
RNAs and messenger RNAs in human breast
cancer
Paola Paci
1*, Teresa Colombo
2and Lorenzo Farina
3Abstract
Background: Non-coding RNAs (ncRNAs) are emerging as key regulators of many cellular processes in both
physiological and pathological states. Moreover, the constant discovery of new non-coding RNA species suggests that the study of their complex functions is still in its very early stages. This variegated class of RNA species encompasses the well-known microRNAs (miRNAs) and the most recently acknowledged long non-coding RNAs (lncRNAs). Interestingly, in the last couple of years, a few studies have shown that some lncRNAs can act as miRNA sponges,i.e.as competing endogenous RNAs (ceRNAs), able to reduce the amount of miRNAs available to target messenger RNAs (mRNAs).
Results: We propose a computational approach to explore the ability of lncRNAs to act as ceRNAs by protecting mRNAs from miRNA repression. A seed match analysis was performed to validate the underlying regression model. We built normal and cancer networks of miRNA-mediated sponge interactions (MMI-networks) using breast cancer expression data provided by The Cancer Genome Atlas.
Conclusions: Our study highlights a marked rewiring in the ceRNA program between normal and pathological breast tissue, documented by its “on/off” switch from normal to cancer, andvice-versa. This mutually exclusive activation confers an interesting character to ceRNAs as potential oncosuppressive, or oncogenic, protagonists in cancer. At the heart of this phenomenon is the lncRNAPVT1, as illustrated by both the width of its antagonist mRNAs in normal-MMI-network, and the relevance of the latter in breast cancer. Interestingly,PVT1revealed a net binding preference towards the mir-200 family as the bone of contention with its rival mRNAs.
Keywords: Systems biology, Networks analysis, Epigenetics
Background
The idea that the greater complexity of higher eukaryotes arises from the portion of the genome called non-coding RNAs (ncRNAs) is becoming increasingly widespread [1,2]. Indeed, ncRNAs are of growing interest, as they have been found to be important regulators of gene expres-sion in development, physiology, and, when dysfunctional, in the presence of disease. This variegated class of RNA species encompasses the well-known miRNAs, as well as the most recently acknowledged lncRNAs. Discovered
*Correspondence: [email protected]
1Institute for System Analysis and Computer Science “Antonio Ruberti”, National Research Council, Viale Manzoni 30, 00185 Rome, Italy Full list of author information is available at the end of the article
first, miRNAs have been intensively studied and much is now known about their biological functions, as opposed to lncRNAs. In fact, the latter constitutes a new, potentially fascinating, territory to be explored yet.
miRNAs are single-stranded short RNAs (∼22 nucleo-tides long) that post-transcriptionally regulate gene expression by translation inhibition or degradation of their target mRNAs [3-6]. Virtually, all biological pro-cesses have been proved to involve miRNA regulation, including development, metabolism, cell proliferation, differentiation and apoptosis [7,8]. Accordingly, altered miRNA expression characterizes many human diseases and mounting evidence strongly links specific miRNAs to tumor initiation, progression and metastasis [9-14].
© 2014 Paci et al.; licensee BioMed Central Ltd. This is an Open Access article distributed under the terms of the Creative Commons Attribution License (http://creativecommons.org/licenses/by/4.0), which permits unrestricted use, distribution, and reproduction in any medium, provided the original work is properly credited. The Creative Commons Public Domain Dedication waiver (http://creativecommons.org/publicdomain/zero/1.0/) applies to the data made available in this article, unless otherwise stated.
Several mechanisms, including gene locus amplification [15], chromosomal deletion [16], mutation and epigenetic silencing [9,17,18], have been identified as responsible for deregulating miRNA expression in cancer. However, the underlying mechanisms leading to miRNA deregulation in cancer are far from being fully understood.
A new mechanism of miRNA regulation concern-ing the ability of RNAs to compete for miRNA bind-ing has recently been discovered [19]. This intrigubind-ing mechanism, also known as ‘target mimicry’ process, was first discovered in plants [20]. Ebert et al. [21] later showed that exogenously administered miRNA competi-tors in mammalian cells derepressed miRNA targets at least as strongly as chemically modified antisense oligonucleotides. Crucial triggers of this new layer of post-transcriptional regulation are ‘decoys’ - or miRNA ‘sponges’ - including both coding and non-coding RNAs, such as pseudogenes, large intergenic ncRNAs, and cir-cular RNAs [19,22-24]. Sponges exert their decoy activity by recruiting miRNA molecules via base-pairing with miRNA-recognition elements (MREs), which they share with a target, subsequently causing release of the target from miRNA control.
Polisenoet al.[22] analyzed this miRNA removal mech-anism by focusing on pseudogenes in samples of both normal and prostate-tumor human tissues. Pseudogenes are defined as copies of real genes that originate from duplications or retro-transpositions. Furthermore, the lat-ter is not translated into functional proteins because their coding potential is corrupted by premature stop codons, deletions/insertions and frameshift mutations. Moving from the evidence that despite lack of translation -sequence conservation of pseudogenes suggests function-ality, the authors proposed them as perfect endogenous competitors of their ancestral genes, because they retain many of the miRNA binding sites.
More recently, Sumazinet al.[25] investigated the abil-ity of coding and non-coding RNAs to act as ceRNAs in human glioblastoma. They identified a broad network of sponge interactions and suggested them as mediators of crosstalk between different regulatory pathways. Due to the computationally prohibitive burden of testing all possible combination of RNA/miRNA/RNA triplets, the authors only considered those RNA/RNA pairs sharing a statistically significant number of common miRNAs, thus using somea prioriinformation on putative or validated seeds to complementing expression data.
In this paper, we study the role of lncRNAs as pos-sible sponge regulators of miRNA activity on target mRNAs. We furthermore explored miRNA decoy mech-anism within gene regulatory circuitry using expression data from tumor and matched normal samples of breast invasive carcinoma (BRCA), provided by The Cancer Genome Atlas (TCGA). Our main aim was to probe
whether specific lncRNAs may function as ceRNAs of protein-coding RNAs. lncRNAs are broadly categorized as RNAs with more than 200 nucleotides lacking an exten-sive open reading frame [26]. Although recent studies have begun to associate subsets of lncRNAs to specific regulatory mechanisms [27-31], the relevance of their role in controlling normal cell physiology and pathogenesis remains unclear.
In our study, we built two networks of lncRNA-mRNA interactions mediated by miRNAs as inferred by multi-variate analysis for normal and cancer data, respectively. The reduced dimensionality of this configuration space, obtained by using a lncRNA-centered approach, made the computational burden manageable, with the addi-tional advantage of using a purely data-driven approach. Our study revealed the existence in normal samples -of a complex regulatory network -of miRNA-mediated interactions (normal-MMI-network) that appears to be missing in tumor samples. As a result, an oncosup-pressive activity of some specific lncRNAs, exploiting a decoy mechanism, is speculated therein. Furthermore, the MMI-network assembled in tumor samples (cancer-MMI-network), highlighted some sponge interactions triggered in cancer and shut off in normal tissues, pointing to their potential oncogenic activity.
Results
Identification of miRNA-mediated mRNA/lncRNA interactions
We analyzed a large dataset of tumor and matched nor-mal samples of BRCA profiled for both gene and miRNA expression, obtained from TCGA. As discussed in details in the Methods section, we restricted our study to a total of 10492 mRNAs, 311 miRNAs and 833 lncRNAs.
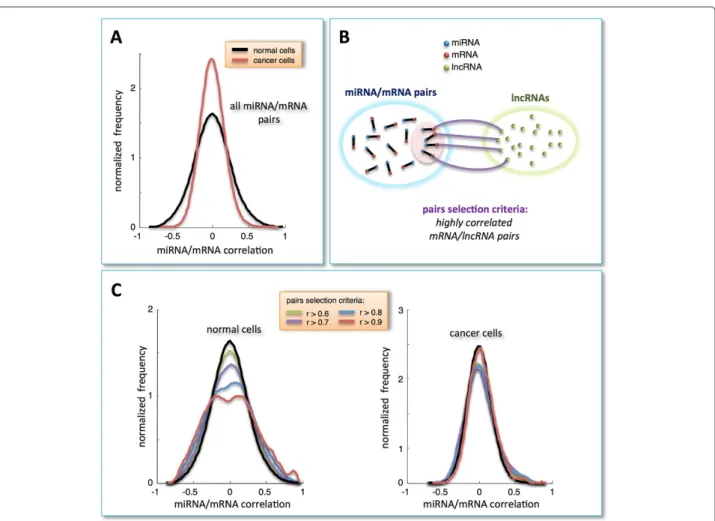
Firstly, we systematically evaluated Pearson correlations for all available pairs of 10492 mRNAs and 311 miR-NAs in normal breast and BRCA samples (Figure 1A and Additional file 1: Table S1 and Additional file 2: Table S2). The resulting distribution curves are both unimodal, symmetric and centered at zero, thus not displaying any peculiar underlying correlation pattern. By contrast, selec-tion for mRNAs with at least one co-expressed lncRNA (i.e., highly correlated pairs,r > 0.7; Figure 1B) showed the presence, in the normal dataset, of a clear bimodal dis-tribution (Figure 1C, left). At variance, this effect is not visible using cancer data where the distribution remains unchanged (Figure 1C, right). These preliminary results suggest a possible involvement of lncRNAs in eliciting positive and negative co-expressed mRNA/miRNA pairs. Repeating the same selection for mRNAs with at least one anti-correlated lncRNA (r<−0.7) yielded the emergence of a similar bimodal behavior (data not shown). From a purely statistical framework, positively and negatively correlated mRNA/miRNA pairs are both interesting.
Figure 1Correlation analysis.A)Distribution of Pearson correlation coefficients - normalized to unit area - for all combinations of miRNA and mRNA expression profiles in normal and cancer tissues (black and red lines, respectively).B)Schematic representation of pairs-selection criteria: among all possible miRNA/mRNA pairs, we selected only those involving mRNAs that were highly correlated with (at least) one lncRNA in the normal dataset.C)Distributions of Pearson correlation coefficients - normalized to unit area - of miRNA/mRNA pairs, selected as described in panel B. The various distributions are plotted as a function of different correlation threshold values, as indicated in the inset, for normal (left side) and cancer dataset (right side).
However, an high positive correlation between RNAs competing for miRNA binding has been recently experi-mentally observed and discussed [22]. Thus, we focused on mRNA/lncRNA pairs marked by highly positive cor-relation - which we calledcognate genesin analogy with [22] - to investigate the scenario in which specific miR-NAs may mediate their interactions (i.e., the so-called ‘sponge model’). To pursuit this aim, we applied a well-established tool of multivariate analysis (i.e., the partial correlation) to each selected mRNA/lncRNA pair with respect to each miRNA in our dataset (see Algorithm and implementationsubsection). We then computed for each triplet the difference between the Pearson and partial correlation coefficients and defined itsensitivity correlation(S):
S=corr(mRNA,lncRNA)
−corr(mRNA,lncRNA|miRNA).
Informally speaking, the partial correlation measures the extent to which an observed correlation between two vari-ablesX andY (here, the expression profiles of a mRNA and a lncRNA) relies on the presence of a third controlling variableZ (here, the expression profile of a miRNA). In particular, values ofSapproaching to zero are indicative of a direct interaction between the two dependent variables (i.e., low sensitivity to the miRNA), whereas values close to the Pearson correlation vaue are indicative of an indi-rect interaction, suggesting a leading contribution of the explanatory variable (i.e., high sensitivity to the miRNA).
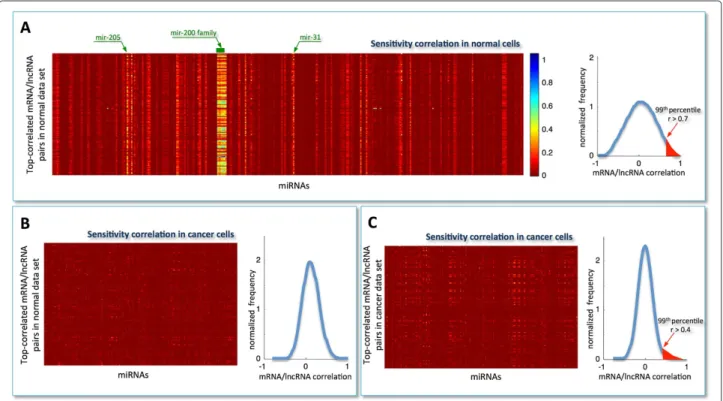
The sensitivity correlation computed in normal breast samples (Figure 2A, left) unveils an overall trend of miRNA-independent interactions between cognate genes (S∼0, red background in the heat-map) with the notable exception of a limited pool of miRNAs (S=0, light verti-cal stripes in the heat-map). This marked pattern suggests the existence of specific miRNAs, particularly the mir-200
Figure 2Sensitivity analysis.Heat-map representing the sensitivity correlationS, computed using:A)the normal expression data for the top-correlated mRNA/lncRNA pairs (N = 87398) in the normal dataset. Light vertical stripes point to a little pool of miRNAs that is responsible for the high correlation between all top-correlated mRNA/lncRNA pairs;B)the cancer expression data for the top-correlated mRNA/lncRNA pairs in the normal dataset;C)the cancer expression data for the top-correlated mRNA/lncRNA pairs in the cancer dataset. Rows: top-correlated mRNA/lncRNA pairs; columns: miRNAs. Color key: red to blue scale corresponds to low to highS. Top-correlated mRNA/lncRNA pairs: Pearson correlation values exceeding the 99thpercentile of the overall correlation distribution (i.e.,r>0.7 in normal andr>0.4 in cancer).
family, acting at global level as buffers of mRNA/lncRNA highly co-expressed pairs. This finding appeares to be par-ticularly relevant, since it directly points to a limited pool of miRNAs capable of establishing a crosstalk through-out the transcriptome as a whole. Computation of the sensitivity correlation repeated in cancer for the same triplets surprisingly resulted in complete disappearance of the observed pattern (Figure 2B, left). This result pin-points the presence of a three-way mechanism triggered in normal breast which appears to be shut off in cancer. Interestingly, it may suggest that overriding the interac-tions of a small group of specific miRNAs with their partners - mRNAs and lncRNAs - could contribute to cancer onset and development. Of note, the high Pearson correlation between mRNAs and lncRNAs that charac-terizes the top-correlated pairs selected in normal breast (Figure 2A, right; highlighted red region) drops when using cancer data. In fact, the Pearson correlation distri-bution - computed in cancer for the same pairs - becomes nearly symmetric and centered around zero (Figure 2B, right).
The same procedure, i.e. selection of top-correlated mRNA/lncRNA pairs followed by computation of sensitivity correlation, was applied to cancer samples
(Figure 2C, left). Here, a first difference emerges in the distribution of Pearson correlation coefficients, which exhibits a smaller variance and thus a less populated tail of cognate genes (Figure 2C, right). Furthermore, there is lack of evident vertical stripes, despite the presence of sporadic light spots.
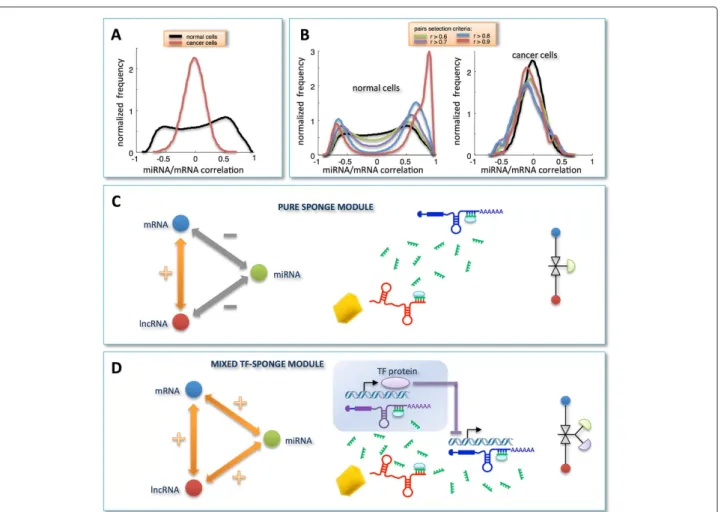
In the normal dataset, the unimodal and zero-centered distribution of Pearson correlation coefficients between all miRNAs and all mRNAs (Figure 1A), when limit-ing miRNAs to that subset which is responsible for the light vertical stripes in the sensitivity correlation heat-map (Figure 2A, left), approaches to a bimodal curve (Figure 3A). This effect seems to be specific for the normal breast since the same miRNA selection does not affect the Pearson correlation distribution in cancer (Figure 3A).
To summarize, we observed the emergence of a clear distinction between cancer and normal cells induced by two independent data selection criteria in the miRNA/mRNA Pearson correlation analysis: i. selection based on mRNAs having at least one highly correlated lncRNA (Figure 1C); ii. selection based on miRNAs mediating mRNA/lncRNA interactions (Figure 3A). Both approaches independently disclosed a tendency towards a bimodal behavior in normal samples, which is unmatched
Figure 3Correlation analysis for selected miRNA/mRNA pairs and RNA-interaction modules.A)miRNA/mRNA correlation distributions obtained by selecting only those miRNAs that are responsible for the light vertical stripes in Figure 2A.B)miRNA/mRNA correlation distributions obtained by merging pairs-selection criteria applied in Figure 1C and Figure 3A. In details, among all possible miRNA/mRNA pairs, we selected only those involving mRNAs and miRNAs as follows: i. mRNAs characterized by a high correlation with at least one lncRNA in the normal tissues; ii. miRNAs responsible for the light vertical stripes in Figure 2A. Distributions are plotted as a function of different correlation thresholds, as indicated in the inset, for normal (left) and cancer dataset (right). The two peaks clearly visible in panelB(left) identify two ways of mRNA/miRNA interaction: one leading to a negative Pearson correlation between them; one leading to a positive Pearson correlation between them. Correspondingly, we defined two sponge modules:C)thepure sponge module, where the mRNA/miRNA correlation is negative;D)themixed TF-sponge module, where the mRNA/miRNA correlation is positive and could be due to the presence of a repressor TF. In both cases, the lncRNA and the mRNA compete for miRNA binding (panelsCandD, center). In the panelsCandD(right), the valve symbols provide a schematic representation of the regulatory circuit:C)the mRNA (blue circle) concentration is due to the presence of the miRNA (valve) that is in turn regulated by the lncRNA (red circle);D)the mRNA (blue circle) concentration is due to the presence of a repressor TF regulated by the miRNA that is in turn regulated by the lncRNA.
in cancer. Interestingly, when the two selection criteria are adopted together, the bimodal character of the correlation distribution - observed in normal breast - becomes much more evident and witnessed by the sharp breakup of the negative and positive contributions (Figure 3B, left). Again this scenario is unmatched in cancer (Figure 3B, right).
This analysis allowed us to identify two RNA-interaction modules that we termedpure sponge module
and mixed RNA-sponge module. Both of them accom-modate miRNA-mediated communication between the mRNA and the lncRNA, but they discriminate the cor-relation sign linking the mRNA and the miRNA (nega-tive and posi(nega-tive, respec(nega-tively). Fulfilling ceRNA features,
the pure sponge module may be thought of as a reser-voir of putative sponges (Figure 3C). On the contrary, the unexpected positive correlation between the mRNA and the miRNA in the mixed RNA-sponge module may have many different explanations. Among others, we spec-ulate that it may hint to a further layer of regulation ruled by another actor, for instance a transcription factor (TF), which is both a repressor of the mRNA and a tar-get of the miRNA (Figure 3D). We called this possibility
mixed TF-sponge module. This module may be thought of as a built-in regulatory loop where the transcrip-tional level is intertwined with the post-transcriptranscrip-tional one.
miRNA-mediated interactions networks
In animals, miRNAs usually repress the expression of target genes at the post-transcriptional level by binding to partially complementary sites in their 3’ untranslated region (3’UTR). Particularly, Watson-Crick base-pairing to the seed region, which comprises nucleotides 2-7 in the 5’ region of the mature miRNA sequence, is important for target recognition [4]. A seed match analysis -ran for each of those miRNAs that are responsible of the light vertical stripes in the sensitivity correlation heat-map (Figure 2A) - showed that the selected mRNA/lncRNA pairs are enriched for instances where both RNAs har-bor one or more binding sites for the related miRNA (hypergeometric test p-value<0.01).
Integrating the results of multivariate analysis and seed match analysis, we built in normal breast a network of pure and mixed sponge interactions (Figure 4), that we called miRNA-mediated interactions network or MMI-network. Nodes in this network represent both mRNAs and lnRNAs and edges represent miRNAs mediating their interactions (Additional file 3: Table S3). Concretely, linked nodes are required to meet two conditions: i. matching high values of the sensitivity correlation (i.e.,
S > 0.3; see Algorithm and implementation subsec-tion); ii. harboring one or more MREs for the miR-NAs that they can “sponge”. We assigned a weight to each mRNA/lncRNA sponge interaction on the basis of the number of the shared miRNAs (Additional file 4: Table S4).
We used the degree of connectivity (i.e., the number of outgoing edges) of each node in the MMI-network as a suitable parameter of judgement to rank top can-didate endogenous decoys for miRNAs. Outgoing edges from a lncRNA node encompass different types of rela-tionship with the nearest-neighbor mRNA nodes. In par-ticular, a given lncRNA can: i. share with the same mRNA multiple miRNAs for which they compete for binding
(many-to-onerelationship); ii. communicate with several different mRNAs through the same miRNA (one-to-many
relationship); iii. communicate with one mRNA through a single miRNA (one-to-onerelationship).
According to this topological measure, we found that the lncRNAPVT1with its 2169 edges represents the first hub in the normal-MMI-network. It is connected to 753 different mRNAs (∼50% of total mRNAs in the network) and the mir-200 family members are mediating over 80% of these interactions (Additional file 5: Tables S5 and S10). Notably, the normal MMI-network (1738 nodes and 32375 edges) is marked by a clear segregation into two internally well connected components: a larger one (1354 nodes and 31417 edges) mainly dominated by the mir-200 family and a smaller one (378 nodes and 954 edges) mainly controlled by mir-452. In particular, we observed an out-standing prevalence of the mir-200 family in the whole normal-MMI-network. In fact, it mediates the most of the communications (72%) between the majority of the lncR-NAs (68%) and their counterpart mRlncR-NAs (60%) in the network. Interestingly, the mir-200 family members are well-known to be involved in cancer metastasis and are believed to play an essential role in tumor suppression by inhibiting epithelial-to-mesenchymal transition (EMT), the initiating step of metastasis [32-34]. Moreover, the mir-200 family members have recently been associated to human breast cancer [35-39] and their overexpression was shown to promote the mesenchymal-to-epithelial transi-tion [40]. Here, our analysis suggests that these relevant cancer-associated miRNAs hold the reins of communica-tion through the whole MMI-network in normal breast samples.
Seeking to functionally explore the two sub-networks evidenced by the above analysis, the lists of protein-coding nodes populating each of them were analyzed for biological functional annotations using the GOrilla web tool (http://cbl-gorilla.cs.technion.ac.il/). Interestingly,
Figure 4Normal MMI-network.The normal MMI-network built from expression data of normal breast tissues. Nodes in this network represent both mRNAs and lncRNAs; edges represent miRNAs. Each pair of linked nodes fulfills two requirements: i.S>0.3 and ii. one or more shared MREs, for each miRNA linking them.
the observed topological disjunction seems mirrored by strong enrichment in distinct biological functionalities. Specifically, the larger sub-network is enriched in cell-cell adhesion function (Additional file 6: Figure S1-A and Additional file 7: Table S6), whereas the smaller one is enriched in cellular metabolic processes (Additional file 6: Figure S1-B and Additional file 8: Table S7). Both these biological processes characterize the normal breast epithelium and their proper regulation is essential to maintain tissue integrity.
As for the similarly constructed cancer MMI-network (415 nodes and 1103 edges), we observed a clear segre-gation into two components (Additional file 9: Figure S2), yet markedly less populated compared to the normal case. Indeed, the larger sub-network here is composed by 383 nodes and 1070 edges whereas the smaller one is com-posed by only 20 nodes and 26 edges (Additional file 10: Table S8). Similarly to the normal case, we assigned a weight to each mRNA/lncRNA sponge interaction on the basis of the number of the shared miRNAs (Additional file 11: Table S9).
In the prevalent component of the cancer MMI-network, mir-150 exhibits a leading role by mediating most of the mRNA/lncRNA connections. We found that two lncRNAs -MEG3(Maternally Expressed Gene 3) and
KIAA0125- compete for the role of the first hub and reg-ulate the expression of the almost totality of the mRNAs in the cancer-MMI-network, by antagonizing mir-379 and mir-150, respectively (Additional file 5: Tables S5 and S10). Of note, MEG3 was recently suggested to play a significant role as a novel tumor suppressor lncRNA in several human cancers and evidence of its association with tumorigenesis is growing every day [41-43]. Functional annotation enrichment analysis of nodes in this larger sub-network clearly points to immune system-related functions (Additional file 12: Figure S3 and Additional file 13: Table S11). Indeed, inflammation is a hallmark of cancer and different immune cells are known to be involved with either pro- or anti-tumor activity in tumor development [44].
Overall, our results indicate that the observed decoy mechanism seems to “switch on” or “off” its agents accord-ing to the physiological or pathological condition. Pre-cisely, the framework of miRNA-mediated interactions appears completely altered in BRCA samples compared to normal. Particularly, ceRNA mechanisms orchestrated by the mir-200 family, which is preponderant in the normal breast scenario, disappear in the BRCA network, where other sponges appear to be activated.
Discussion
Modes of action in the normal MMI-network
As a case study, we propose two prototypes of pure sponge (Figure 5A) and mixed TF-sponge (Figure 6A)
modules, extracted from the normal breast analysis: the first employs PTENP1, a growth-suppressive lncRNA already identified as ceRNA [22,25]; the second engages
PVT1as a competitor of CDH1for binding to the mir-200 family andZEB1as both a transcriptional repressor of
CDH1and a target of the mir-200 family.
In both cases, the high correlation bridging the mRNA/miRNA/lncRNA actors, which is attained in nor-mal breast (Figures 5B and 6B), appears completely abol-ished in breast cancer (Figures 5C and 6C). We speculate that the disappearance of the lncRNA-mRNA crosstalk noticed in cancer may occur because the miRNA stops functioning as a mediator of their interaction, with a con-sequent break-up in the ceRNA relationship. In fact, the Pearson correlation betweenCDH1andPVT1is very high in normal breast (r=0.8), but strongly dependent on the miRNA, as witnessed by the drastic drop in the correla-tion after the computacorrela-tional removal of the miRNA (e.g. r=0.01 when subtracting mir-200b effect).
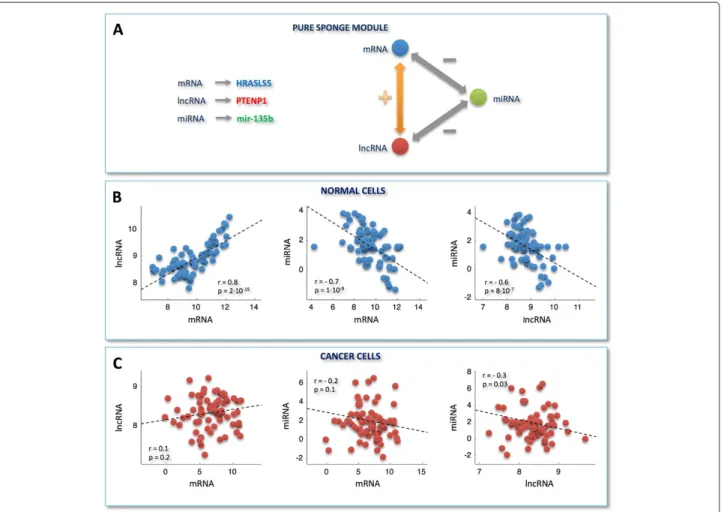
In the example of pure sponge module (Figure 5A),
PTENP1appears to regulate the expression ofHRASLS5, a member of the HRAS-like suppressor family, via antag-onizing mir-135b in normal breast tissue. In humans, HRAS, together with KRAS and NRAS, constitutes the Ras protein superfamily that controls proliferation, differ-entiation and cell cycle via the mitogen-activating kinase (MAPK) signaling cascade [45]. Consistently, we observed this pure sponge module within the smaller sub-network of the normal-MMI-network (Figure 4), which results functionally enriched in the oxidation-reduction process, angiogenesis and regulation of MAPK cascade (Additional file 6: Figure S1-B). These biological processes are closely related. In fact, the uncontrolled cell growth and divi-sion characterizing tumor cells are hampered by a lack of oxygen and other essential nutrients. To overcome this obstacle, malignant cells acquired the specific ability to induce blood vessel growth (angiogenesis), by secreting various growth factors. Recently, reactive oxygen species have also been proposed as essential triggers for angiogenesis [46]. In this light, our observation of a deactivation -in breast cancer - of the sponge mechanism -involv-ing
PTENP1- together with the previously reported growth-suppressive role of PTENP1 [22,25] - corroborates the importance of miRNA-mediated PTENP1 regulation in cancer [22,25].
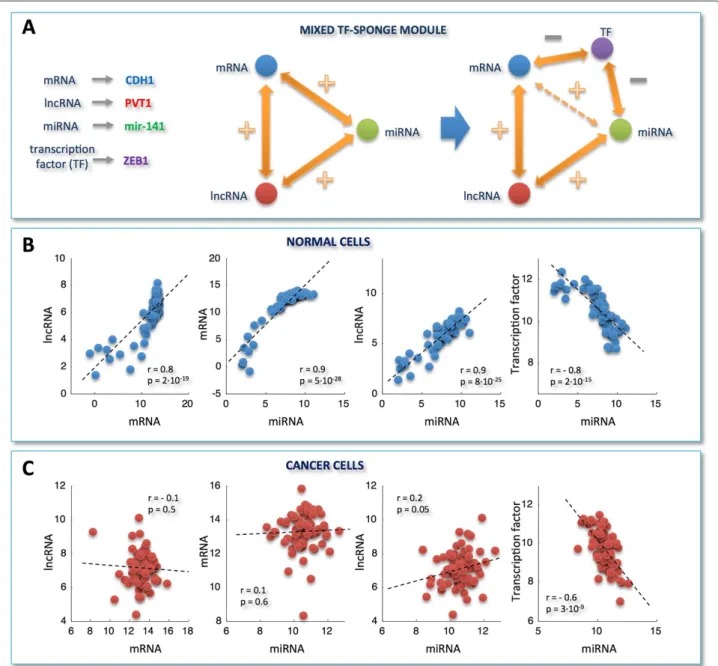
With respect to the mixed TF-sponge module (Figure 6A), it is worth noting that the only remaining interaction - found in cancer cells (Figure 6C) - is the anti-correlation between mir-141 and its validated target
ZEB1[32,33]. Moreover, the relationship betweenZEB1
andCDH1, hypothesized by our analysis, has been exper-imentally validated [33,47], corroborating the relevance of our findings. Specifically,ZEB1results downregulated in our breast cancer dataset compared to normal samples,
Figure 5Example of a pure sponge module.A)A prototype of pure sponge module extracted from the normal MMI-network.B-C)Scatter plots of expression profiles in normal and cancer dataset, respectively. Plots are shown for, from left to right:PTENP1versusHRASL5, mir-135b versus HRASL5, mir-135b versusPTENP1. y- and x-axis: normalized read counts from TCGA (log2-scale); r = Pearson correlation coefficient, p = p-values. Correlations and p-values are computed by using the routinecorrof MATLAB. Each p-value is the probability of getting a correlation as large as the observed value by random chance, when the true correlation is zero.
while both the mir-200 family members and CDH1are overexpressed. This is suggestive of an epithelial-like phenotype maintained by high levels of the mir-200 fam-ily members, which inhibit ZEB1 and, hence, increases the expression of ZEB-repressed epithelial genes, such as CDH1(also known as E-cadherin) [33,47]. However, it has been shown that ZEB1triggers a double negative feedforward loop, by downregulating its own inhibitors (i.e., the mir-200 family members) [47,48]. Thus, depend-ing on the ZEB1 levels in cancer cells, this loop could stabilize either mesenchymal or epithelial differentiation, accounting for the phenotypic heterogeneity viewed in tumors and metastases. In particular, the switch to a mesenchymal state can be induced by the transforming growth factor TGFβ, which increasesZEB1, while ectopic expression of the mir-200 family members, which reduces
ZEB1, seems either to prevent TGFβ-induced EMT or to initiate epithelial-like reversion in mesenchymal cells [33].
PVT1is the main ceRNA regulator in normal breast
PVT1is a lncRNA that appears to be strongly conserved between mouse and human [49] and amplification of its locus is one of the most frequent events in breast cancer [50]. Moreover, its overexpression has been recently sug-gested to contribute to breast pathogenesis by inhibiting apoptosis [50].
We found that PVT1 acts as ceRNA in the normal-MMI-network, but not in cancer. Moreover, it reveals a net binding preference towards the mir-200 family (Figure 7A), which it antagonizes to regulate the expres-sion of hundreds of mRNAs in the normal case. In terms of topological properties, PVT1 switches from being the first of the hubs in the normal-MMI-network to fall outside the list of nodes of the cancer net-work. Interestingly, recent studies suggested a role for
PVT1in the pathophysiology of breast cancer by virtue of PVT1-mediated inhibition of apoptosis, when over-expressed [50].
Figure 6Example of a mixed TF-sponge module.A)As in Figure 5A, this time for a prototype of mixed TF-sponge module.B)-C)As in Figure 5B-C, this time for:PVT1versusCDH1,CDH1versus mir-141,PVT1versus mir-141, andZEB1versus mir-141. y- and x-axis: normalized read counts from TCGA (log2-scale); r = Pearson correlation coefficient, p = p-values. Correlations and p-values are computed by using the routinecorrof MATLAB. Each p-value is the probability of getting a correlation as large as the observed value by random chance, when the true correlation is zero.
AmongPVT1nearest-neighbors in the normal-MMI-network, we emphasize some important regulators of breast tissue morphogenesis and development, such as: the aforementioned CDH1; all three members of the extended p53 family (i.e., TP53, TP63 and TP73); two members of the mammalian RUNX family (i.e.,RUNX1
and RUNX3) and GATA3 (Figure 7B). TP53 is the most extensively studied tumor suppressor and acts in response to diverse forms of cellular stresses to induce cell cycle arrest, apoptosis and senescence [51,52]. The two identified homologues, TP63and TP73, have also been
related to apoptosis, and a possible role as tumor sup-pressors has been suggested [51].RUNX1is the predom-inant RUNX family member expressed in human breast epithelial cells and there is a growing body of evidence suggesting its possible role as a breast cancer suppressor [53-56].RUNX3 has been recently reviewed as a tumor suppressor, specifically in human BRCA, with decreas-ing expression associated to disease progression [54,57]. Finally, GATA3 has been linked to mammary gland morphogenesis, mammary tumor differentiation and metastasis [58].
Figure 7ThePVT1sub-network.A)Percentage of the miRNAs sponged byPVT1in the normal-MMI-network.B)Schematic diagram of selected nearest-neighbors ofPVT1in the normal-MMI-network, that are important regulators of breast tissue morphogenesis and development.C)Sketch of thePVT1locus as it appears in the UCSC genome browser (http://genome.ucsc.edu/), illustrating thePVT1alternative isoforms (Iso). Boxes represent exons while black lines represent introns. Colored boxes correspond to exons where the seed-complementary sites - for mir-200a/mir-141 (red), and for mir-200b/mir-200c (purple) - occur. Note that two isoforms (Iso 11 and 12) lack seed matches for the mir-200 family.
In sum: i. the PVT1 neighborhood in the normal-MMI-network encompasses cancer related genes as well as genes involved in mammary gland development and cell morphogenesis; and ii. the sponge program orches-trated by PVT1 results completely abolished in can-cer. Taken together these findings may be indicative of a possible PVT1 surveillance role aimed to preserve cell-cell adhesion. Indeed, mammary gland morphogen-esis results from the coordination of diverse cellular processes involving cell-cell adhesion, migration, prolif-eration and apoptosis. Thus, PVT1 controlling circuit may provide further insight in solving this complicated puzzle.
ThePVT1sponge program is turned off in breast cancer The specific conditions required for a ceRNA network to occur are still far from being determined. The impor-tance of the relative concentration of the ceRNAs, and their related miRNAs, has been recently emphasized
[27]. In fact, in their study, Salmena et al. [27], sug-gest that large changes in the ceRNA expression lev-els either overcome, or relieve, the miRNA repression on competing ceRNAs; similarly, a very large miRNA overexpression may abolish competition. Along this line, the mir-200 family members appear highly upregulated in the cancer dataset that we analyzed (from 4- to 8-fold). This may explain the observed annihilation of the sponge interactions that they mediate. However, this model may be undermined by the evidence thatPVT1 -the main sponge regulator of -the mir-200 family in -the normal network - also results upregulated (∼2-fold) in cancer.
Examination of the PVT1 genomic locus showed the existence of multiple isoforms, whose sequence analysis prompted us to formulate an alternative hypothesis. In particular, members of the mir-200 family can be grouped in two clusters based on the seed sequence (i.e., the mir-200b/c/429 and mir-200a/141 clusters), differing by one
nucleotide. Despite most of thePVT1alternative isoforms harboring seed matches for both clusters (Figure 7C), two isoforms lack the putative MREs for the mir-200 family. This is the result of alternative splicing events as well as the presence of alternative transcription start sites that cause skipping of the exons where the MREs reside. Hence, the observed withdrawal in cancer of thePVT1
sponge activity may be due to preferential expression of these two isoforms, independently from the abundance of
PVT1.
Comparison between MMI-network and correlation network
We compared the MMI-networks with their cog-nate correlation networks (Additional file 14: Figure S4), composed by highly correlated mRNA/lncRNA pairs (i.e., correlation of linked nodes >0.7). Interest-ingly, we noticed that the shape of both normal and cancer-MMI-networks is reminiscent of their ances-tor correlation networks. In particular, the two com-ponents, which characterize the normal-MMI-network (Figure 4), emerge as already separated, when mapped onto the corresponding correlation network (blue points in Additional file 14: Figure S4-A). In fact, the correla-tion network itself appears to be weakly connected and a tendency to split into two sub-regions is already con-ceivable (Additional file 14: Figure S4-A). On the other hand, the cancer correlation network is clearly com-posed by a giant highly tangled component (Additional file 14: Figure S4-B) that mirrors the single prevalent sub-network dominating the cancer-MMI-network, disre-garding the limited residual component (Additional file 9: Figure S2). Taken together, the analyses of the correla-tion and MMI-networks strengthen the hypothesis that the normal breast is marked by a more structured organi-zation as opposed to the disordered malignant picture. Conclusions
We propose a novel computational approach suitable to exploring the potential role of lncRNAs as ceRNAs. We applied our method to a large dataset of BRCA obtained from TCGA and built two networks of ceRNA interac-tions in normal and cancerous state. Overall, we noticed a dramatic difference between the physiological and patho-logical condition concerning the identification and the amount of activated sponges. The drastic change observed in the sponge program is suggestive of a marked ceRNA rewiring that characterizes the cancer state. The main actor of this “system-reset” isPVT1. Despite its upregu-lation, it stops working as ceRNA in the cancerous state. We speculate that the withdrawal in cancer of thePVT1
ceRNA activity can be due to the preferential expression of the two isoforms missing the binding sites for the mir-200 family.
Methods
Algorithm and implementation
The pipeline of our algorithm encompasses the following four steps: i. data collection and processing; ii. statistical analysis; iii. seed match analysis; iv. network building.
i. Data collection and processing
Level 3 IlluminaHiSeq gene and miRNA expression datasets of human BRCA were obtained from TCGA (dowloaded on May 28th, 2012; http://cancergenome. nih.gov/). The analysis was restricted to 72
individuals for which the complete sets of tumor and matched normal (i.e., normal tissue taken from the same patient) profiles were available for RNA sequencing assays of both small RNAs and long RNAs (Additional file 15: Table S12). We filtered out entries with more than10%of missing values and separated coding versus non-coding RNAs based on entrez gene identifiers and human annotation obtained from NCBI (ftp://ftp.ncbi.nih.gov/gene/DATA/GENE_ INFO/Mammalia/Homo_sapiens.gene_info.gz). We limited the analysis to those mRNAs with an available 3’UTR sequence at least equal to 500 nt in the curated UTRdb database [59]. All together, we analyzed a total of: 10492 mRNAs, 311 miRNAs and 833 lncRNAs. ii. Statistical analysis
We selected the top-correlated mRNA/lncRNA pairs in normal and cancer datasets by setting in both cases the correlation threshold to the99thpercentile of the corresponding overall correlation distribution. We chose this threshold in order to reduce both the computation burden in the evaluation of the sponge interactions and the number of false positives. This threshold yielded selection of Pearson correlation values greater than 0.7 and 0.4 for the normal and cancer expression data, respectively. The number of selected pairs is 87398. Then, we built up two regression models: i. the expression profile of the mRNA is the dependent variableXand the expression profile of the miRNA is the explanatory variableZ; ii. the expression profile of the lncRNA is the dependent variableYand the expression profile of the miRNA is the explanatory variableZ. To infer the role ofZin mediating X-Y correlation, we computed partial correlation defined as:
ρXY|Z= ρXY−ρXZρZY 1−ρXZ2
1−ρZY2
whereρXYis the Pearson correlation betweenXand
Y,ρXZis the Pearson correlation betweenXandZ
andρZY is the Pearson correlation betweenYandZ.
remains of the correlation betweenXandYafter the computational removal ofZ. This is mathematically achieved by subtracting from theρXY value the
independent contributions of the Pearson correlation ofZwithXand ofZwithY. If any ofXandYdoes not correlate withZ(i.e.,ρXZ=0and/orρZY =0),
the partial correlation is equal to their Pearson correlation (ρXY|Z=ρXY). This scenario suggests
that the correlation betweenXandYis direct. Otherwise, if bothXandYcorrelate withZ(i.e., ρXZ=0andρZY =0, with concordant sign of the
correlation), the partial correlation is lower than the Pearson correlation. This scenario suggests that the correlation betweenXandYis not direct but rather mediated to some extend byZ. As an extreme case of the latter, a null partial correlation value (i.e., ρXY =ρXZρZY) would suggest that the correlation
betweenXandYis entirely given by the independent Pearson correlations ofZwithXand ofZwithY. In this case, the observed Pearson correlation between
XandYappears spurious and possibly entirely due to
Z. In other words, if we were able to remove Z from the data, no correlation betweenXandYwould be expected.
To establish if the Pearson correlation betweenXand
Yis direct orZ-mediated, we defined a new metrics, that we calledsensitivity correlationS:
S=ρXY−ρXY|Z
and selected XYZ triplets withS>0.3. This threshold corresponds to the99thof the distribution of theS-values (Additional file 16: Figure S5). This choice allowed us to reduce the number of the false positives and to have greater confidence in the obtained data. The X and Y variables correspond to the top-correlated mRNA/lncRNA pairs.
iii. Seed match analysis
A perfect match to positions 2 to 7 at the 5’-end of the mature miRNA sequence (6mer miRNA seed) is the minimal pairing requirement considered predictive for miRNA target recognition [60]. The miRNA seed sequences were obtained by mapping TCGA miRNA identifiers to miRBase
(www.miRBase.org, release_18). Complementary DNA (cDNA) sequences (i.e., without introns) for lncRNAs were obtained querying the Ensembl (http://www.ensembl.org/) data portal through its R/Bioconductor (http://www.bioconductor.org) interface provided by packagebiomaRt and by using Entrez gene identifiers (http://www.ncbi.nlm.nih. gov/gene). For each 3’UTR sequence included in our dataset, we recorded all the occurrences matching the reverse-complement of the 6-mer seed for the miRNAs analyzed. For each lncRNA included in our
dataset, we similarly recorded all the occurrences of short sites matching the reverse-complement of a miRNA seed in the entire transcript sequence. Recently, miRNA MREs have also been reported to occur in the 5’UTR and coding sequences. However, we decided to restrict our seed match analysis to the 3’UTR of mRNAs based on current experimental evidence showing that MREs residing in the 3’UTR yield the highest effect on mRNA destabilization [61]. The lists of coding and non-coding RNA identifiers used to retrieve corresponding sequences were built based on gene annotations obtained from the NCBI (“Homo_sapiens.gene_info.gz” from NCBI ftp site: ftp://ftp.ncbi.nih.gov/gene/).
The seed match analysis constitutes a refinement criterium downstream to the already stringent selection steps. In fact, the stringent selection steps i. and ii. greatly narrowed the space of sequences of lncRNAs and mRNAs to be searched for MRE occurrences. This allowed us to relax the stringency of the seed match requirements to having at least a 6mer seed match. In fact, it has been reported that this seed type has the highest sensitivity in recalling functional miRNA MREs [62]. However, the high rate of spurious occurrences of 6mers on a genome-wide analysis forces the majority of predictions algorithms to mainly focusing on conserved and/or longer seed matches (e.g.: 7-8mer seeds) to restrict the number of false positives. This approach allowed us to do not miss potentially relevant species-specific interactions in our MM1-networks. Nevertheless, we annotated miRNA/mRNA interactions populating our normal breast and cancer networks to target predictions provided by TargetScan (http://www.targetscan.org/) and to experimentally validated miRNA targets reported in miRTarbase (http://mirtarbase.mbc.nctu. edu.tw/). This information could be of interest to prioritize further investigation of selected sublists of interactions taken from the MMI-networks
(Additional file 17: Table S13 and Additional file 18: Table S14).
Finally, we used the seed match analysis to restrict the above selected triplets (step ii.) to those where both the lncRNA and mRNA have at least one perfect 6mer seed match for the shared miRNA.
iv. Network building
Integrating the results of statistical analysis and seed match analysis, we built the MMI-network both in normal and cancer tissues. Nodes in the networks represent mRNAs and lnRNAs with highly correlated expression profiles while edges represent miRNAs mediating their interactions. Concretely, linked nodes are required to meet three conditions: i. matching high values of the Pearson correlation
between their expression profiles; ii. matching high values of the sensitivity correlation; iii. sharing binding sites for miRNAs.
Algorithm validation
Our algorithm identifies high correlated mRNA/lncRNA pairs in which the correlation is due to the presence of one or more miRNAs. These pairs correspond to a high value of the sensitivity correlation, i.e., the correlation between these pairs shows a drastic decrease after the removal of the miRNAs mediating their interaction. The seed match analysis (step iii.) showed that these pairs were enriched for the presence of binding sites for the miRNAs medi-ating their interactions (hypergeometric test p-value < 0.01).
Very few lncRNAs has been characterized and exper-imentally validated thus far. Among them, the first dis-covered competing endogenous RNA in humans was the pseudogenePTENP1[22]. We foundPTENP1in the nor-mal MMI-network and its important sponge interactions are discussed in details in theDiscussionsection.
Additional files
Additional file 1: Table S1 — Pearson correlations between mRNA and miRNA expression profiles in normal breast tissues.The table lists the Pearson correlation coefficients computed for each pair of mRNA and miRNA expression profiles across our dataset of normal breast samples. Additional file 2: Table S2 — Pearson correlations between mRNA and miRNA expression profiles in breast cancer tissues.The table lists the Pearson correlation coefficients computed for each pair of mRNA and miRNA expression profiles across our dataset of breast cancer samples. Additional file 3: Table S3 — MMI-network built in normal breast tissues.The table lists the normal MMI-network in formatabc(i.e., node1, node2, interaction) with additional information on nodes (lncRNAs, mRNAs) and edges (miRNAs).
Additional file 4: Table S4 — Weights of the sponge interactions in the normal MMI-network.The table lists the weight assigned to each mRNA/lncRNA sponge interaction in the normal MMI-network based on the number of the shared miRNAs.
Additional file 5: Tables S5 and S10 — The top lncRNAs functioning as ceRNAs in normal and breast tissues, respectively.The tables list features of the top ranking hubs, corresponding to the 8% of the total lncRNAs, in the normal and cancer MMI-network, respectively.
Additional file 6: Figure S1 — Functional enrichment analysis in the normal MMI-network.This figure shows the results of functional enrichment analysis for genes participating in the two-components of the MMI-network built from expression data of normal breast tissues. The enrichment test p-values, obtained by running the GOrilla web tool (http:// cbl-gorilla.cs.technion.ac.il), shown in the picture are adjusted p-values for multiple testing using the Benjamini and Hochberg method.
Additional file 7: Table S6 — Functional enrichment analysis for the large sub-network in the normal MMI-network.The table is produced by the GOrilla web tool and lists the results of the enrichment analysis of biological processes (GO terms) for genes participating in the large sub-network of the normal MMI-network.
Additional file 8: Table S7 — Functional enrichment analysis for the small sub-network in the normal MMI-network.The table is produced by the GOrilla web tool and lists the results of the enrichment analysis of biological processes (GO terms) for genes participating in the small sub-network of the normal MMI-network.
Additional file 9: Figure S2 — MMI-network built in breast cancer. This figure shows the MMI-network built from expression data of breast cancer tissues. Nodes in this network represent both mRNAs and lncRNAs; edges represent miRNAs mediating their interactions.
Additional file 10: Table S8 — MMI-network built in breast cancer tissues.The table lists the cancer MMI-network in formatabc(i.e., node1, node2, interaction) with additional information on nodes (lncRNAs, mRNAs) and edges (miRNAs).
Additional file 11: Table S9 — Weights of the sponge interactions in the cancer MMI-network.The table lists the weight assigned to each mRNA/lncRNA sponge interaction in the cancer MMI-network based on the number of the shared miRNAs.
Additional file 12: Figure S3 — Functional enrichment analysis in the cancer MMI-networkThis figure shows the results of the functional enrichment analysis for genes participating in the largest component of the MMI-network built from expression data of breast cancer tissues. The enrichment test p-values, obtained by running the GOrilla web tool (http:// cbl-gorilla.cs.technion.ac.il), shown in the picture are adjusted p-values for multiple testing using the Benjamini and Hochberg method.
Additional file 13: Table S11 — Functional enrichment analysis for the large sub-network in the cancer MMI-network.The table is produced by the GOrilla web tool and lists the results of the enrichment analysis of biological processes (GO terms) for genes participating in the large sub-network of the cancer MMI-network.
Additional file 14: Figure S4 — Correlation networks for normal and cancer tissues.This figure shows the correlation networks of highly correlated mRNA/lncRNA pairs for normal breast (A) and breast cancer (B) tissues. Nodes are mRNAs and lncRNAs and a link is present if the connected nodes (mRNA/lncRNA pairs) are highly correlated (i.e., their correlation exceeds the 99thpercentile of the overall correlation distribution). Additional file 15: Table S12 — List of the TCGA data sample identifiers.The table lists TCGA data sample identifiers for the 72 individuals included in our analysis.
Additional file 16: Figure S5 — Distribution of the sensitivity correlation values.The figure shows the distribution of the sensitivity correlation values and the threshold chosen to select sponge interactions. Additional file 17: Table S13 — Annotation of miRNA/mRNA interactions from the normal breast MMI-network to predicted and validated miRNA targets.The table provides annotations of
miRNA/mRNA interactions extracted from the normal breast MMI-network to miRNA target predictions from TargetScan and experimentally validated miRNA targets from miRTarbase.
Additional file 18: Table S14 — Annotation of miRNA/mRNA interactions from the breast cancer MMI-network to predicted and validated miRNA targets.The table provides annotations of
miRNA/mRNA interactions extracted from the breast cancer MMI-network to miRNA target predictions from TargetScan and experimentally validated miRNA targets from miRTarbase.
Competing interests
The authors declare that they have no competing interests.
Authors’ contributions
PP conceived and designed the research. PP and LF performed computational data analysis. TC performed bioinformatic analysis. PP analyzed the data. PP and TC wrote the paper. PP and LF made the figures. All authors read and approved the final manuscript.
Acknowledgments
The authors thank CINECA for the computational support, Prof. G. Macino for encouragement and fresh biological insights and Dr. A. Giuliani for inspiring discussions on the statistical analysis.
This work was supported by SysBioNet, Italian Roadmap Research Infrastructures 2012 and from The Epigenomics Flagship Project (Progetto Bandiera Epigenomica) EPIGEN funded by the Italian Ministry of Education, University and Research (MIUR) and the National Research Council (CNR).
Author details
1Institute for System Analysis and Computer Science “Antonio Ruberti”,
National Research Council, Viale Manzoni 30, 00185 Rome, Italy.2Institute for
Computing Applications “Mauro Picone”, National Research Council, Via dei Taurini 19, 00185 Rome, Italy.3Department of Computer, Control and
Management Engineering, “Sapienza” University of Rome, Via Ariosto 25, 00185 Rome, Italy.
Received: 9 March 2014 Accepted: 24 June 2014 Published: 17 July 2014
References
1. Costa FF:Non-coding rnas, epigenetics and complexity.Gene2008, 410(1):9–17.
2. Mattick JS:The genetic signatures of noncoding rnas.Plos Genet2009, 5(4):10–1371.
3. Filipowicz W, Bhattacharyya SN, Sonenberg N:Mechanisms of post-transcriptional regulation by micrornas: are the answers in sight?Nat Rev Genet2008,9(2):102–114.
4. Bartel DP:Micrornas: target recognition and regulatory functions.
Cell2009,136(2):215–233.
5. Mercer TR, Dinger ME, Mattick JS:Long non-coding rnas: insights into functions.Nat Rev Genet2009,10(3):155–159.
6. Koziol MJ, Rinn JL:Rna traffic control of chromatin complexes.
Curr Opin Genet Dev2010,20(2):142–148.
7. Lee RC, Feinbaum RL, Ambros V:The c. elegans heterochronic gene lin-4 encodes small rnas with antisense complementarity to lin-14.
Cell1993,75(5):843–854.
8. Brennecke J, Hipfner DR, Stark A, Russell RB, Cohen SM:bantam encodes a developmentally regulated microrna that controls cell
proliferation and regulates the proapoptotic gene hid in drosophila.Cell2003,113(1):25–36.
9. Garzon R, Calin GA, Croce CM:Micrornas in cancer.Annu Rev Med2009, 60:167–179.
10. Iorio MV, Visone R, Di Leva G, Donati V, Petrocca F, Casalini P, Taccioli C, Volinia S, Liu C-G, Alder H, Calin GA, Ménard S, Croce CM:Microrna signatures in human ovarian cancer.Cancer Res2007, 67(18):8699–8707.
11. Spizzo R, Nicoloso MS, Croce CM, Calin GA:Snapshot: micrornas in cancer.Cell2009,137(3):586–5861.
12. Gaur A, Jewell DA, Liang Y, Ridzon D, Moore JH, Chen C, Ambros VR, Israel MA:Characterization of microrna expression levels and their biological correlates in human cancer cell lines.Cancer Res2007, 67(6):2456–2468.
13. Lu J, Getz G, Miska EA, Alvarez-Saavedra E, Lamb J, Peck D,
Sweet-Cordero A, Ebert BL, Mak RH, Ferrando AA, Downing JR, Jacks T, Horvitz HR, Golub TR:Microrna expression profiles classify human cancers.Nature2005,435(7043):834–838.
14. Ma L, Teruya-Feldstein J, Weinberg RA:Tumour invasion and metastasis initiated by microrna-10b in breast cancer.Nature2007, 449(7163):682–688.
15. He L, Thomson JM, Hemann MT, Hernando-Monge E, Mu D, Goodson S, Powers S, Cordon-Cardo C, Lowe SW, Hannon GJ, Hammond SM:A microrna polycistron as a potential human oncogene.Nature2005, 435(7043):828–833.
16. Calin GA, Dumitru CD, Shimizu M, Bichi R, Zupo S, Noch E, Aldler H, Rattan S, Keating M, Rai K, Rassenti L, Kipps T, Negrini M, Bullrich F, Croce CM:Frequent deletions and down-regulation of micro- rna genes mir15 and mir16 at 13q14 in chronic lymphocytic leukemia.
Proc Natl Acad Sci USA2002,99(24):15524–15529.
17. Lujambio A, Ropero S, Ballestar E, Fraga MF, Cerrato C, Setién F, Casado S, Suarez-Gauthier A, Sanchez-Cespedes M, Git A, Gitt A, Spiteri I, Das PP, Caldas C, Miska E, Esteller M:Genetic unmasking of an epigenetically silenced microrna in human cancer cells.Cancer Res2007, 67(4):1424–1429.
18. Saito Y, Liang G, Egger G, Friedman JM, Chuang JC, Coetzee GA, Jones PA: Specific activation of microrna-127 with downregulation of the proto-oncogene bcl6 by chromatin-modifying drugs in human cancer cells.Cancer Cell2006,9(6):435–443.
19. Cesana M, Cacchiarelli D, Legnini I, Santini T, Sthandier O, Chinappi M, Tramontano A, Bozzoni I:A long noncoding rna controls muscle
differentiation by functioning as a competing endogenous {RNA}.
Cell2011,147(2):358–369.
20. Franco-Zorrilla JM, Valli A, Todesco M, Mateos I, Puga MI, Rubio-Somoza I, Leyva A, Weigel D, García JA, Paz-Ares J:Target mimicry provides a new mechanism for regulation of microrna activity.Nat Genet2007, 39(8):1033–1037.
21. Ebert MS, Neilson JR, Sharp PA:Microrna sponges: competitive inhibitors of small rnas in mammalian cells.Nat Methods2007, 4(9):721–726.
22. Poliseno L, Salmena L, Zhang J, Carver B, Haveman WJ, Pandolfi PP:A coding-independent function of gene and pseudogene mrnas regulates tumour biology.Nature2010,465(7301):1033–1038. 23. Hansen TB, Jensen TI, Clausen BH, Bramsen JB, Finsen B, Damgaard CK,
Kjems J:Natural rna circles function as efficient microrna sponges.
Nature2013,495(7441):384–388.
24. Memczak S, Jens M, Elefsinioti A, Torti F, Krueger J, Rybak A, Maier L, Mackowiak SD, Gregersen LH, Munschauer M, Loewer A, Ziebold U, Landthaler M, Kocks C, le Noble F, Rajewsky N:Circular rnas are a large class of animal rnas with regulatory potency.Nature2013, 495(7441):333–338.
25. Sumazin P, Yang X, Chiu H-S, Chung W-J, Iyer A, Llobet-Navas D, Rajbhandari P, Bansal M, Guarnieri P, Silva J, Califano A:An extensive microrna-mediated network of rna-rna interactions regulates established oncogenic pathways in glioblastoma.Cell2011, 147(2):370–381.
26. Ponting CP, Oliver PL, Reik W:Evolution and functions of long noncoding rnas.Cell2009,136(4):629–641.
27. Salmena L, Poliseno L, Tay Y, Kats L, Pandolfi PP:A cerna hypothesis: the rosetta stone of a hidden rna language?Cell2011,146(3):353–358. 28. Beroukhim R, Mermel CH, Porter D, Wei G, Raychaudhuri S, Donovan J,
Barretina J, Boehm JS, Dobson J, Urashima M, Mc Henry KT, Pinchback RM, Ligon AH, Cho Y-J, Haery L, Greulich H, Reich M, Winckler W, Lawrence MS, Weir BA, Tanaka KE, Chiang DY, Bass AJ, Loo A, Hoffman C, Prensner J, Liefeld T, Gao Q, Yecies D, Signoretti S,et al.:The landscape of somatic copy-number alteration across human cancers.Nature2010, 463(7283):899–905.
29. Futreal PA, Coin L, Marshall M, Down T, Hubbard T, Wooster R, Rahman N, Stratton MR:A census of human cancer genes.Nat Rev Cancer2004, 4(3):177–183.
30. Stratton MR, Campbell PJ, Futreal PA:The cancer genome.Nature2009, 458(7239):719–724.
31. Nagano T, Fraser P:No-nonsense functions for long noncoding rnas.
Cell2011,145(2):178–181.
32. Korpal M, Lee ES, Hu G, Kang Y:The mir-200 family inhibits epithelial-mesenchymal transition and cancer cell migration by direct targeting of e-cadherin transcriptional repressors zeb1 and zeb2.J Biol Chem2008,283(22):14910–14914.
33. Gregory PA, Bert AG, Paterson EL, Barry SC, Tsykin A, Farshid G, Vadas MA, Khew-Goodall Y, Goodall GJ:The mir-200 family and mir-205 regulate epithelial to mesenchymal transition by targeting zeb1 and sip1.
Nat Cell Biol2008,10(5):593–601.
34. Polytarchoua, C SK, Iliopoulos D:An integrated transcriptional regulatory circuit that reinforces the breast cancer stem cell state.
PNAS2012,109(36):14470–14475.
35. Manavalan TT, Teng Y, Litchfield LM, Muluhngwi P, Al-Rayyan N, Klinge CM:Reduced expression of mir-200 family members contributes to antiestrogen resistance in ly2 human breast cancer cells.PLoS One
2013,8(4):62334.
36. Yao C-X, Wei Q-X, Zhang Y-Y, Wang W-P, Xue L-X, Yang F, Zhang S-F, Xiong C-J, Li W-Y, Wei Z-R, Zou Y, Zang M-X:mir-200b targets gata-4 during cell growth and differentiation.RNA Biol2013,10(4): 465–800.
37. Lim Y, Wright JA, Attema JL, Gregory PA, Bert AG, Smith E, Thomas D, Drew PA, Khew-Goodall Y, Goodall GJ:Epigenetic modulation of the mir-200 family is associated with transition to a breast cancer stem cell-like state.J Cell Sci2013,126:2256–2266. doi:10.1242/jcs.122275. 38. Yu Y, Wu J, Guan L, Qi L, Tang Y, Ma B, Zhan J, Wang Y, Fang W, Zhang H:
Kindlin 2 promotes breast cancer invasion via epigenetic silencing of the microrna200 gene family.Int J Cancer2013,133(6):1368–13679. 39. Castilla MÁ, Díaz-Martín J, Sarrió D, Romero-Pérez L, López-García MÁ,
Microrna-200 family modulation in distinct breast cancer phenotypes.PLoS One2012,7(10):47709.
40. Wang G, Guo X, Hong W, Liu Q, Wei T, Lu C, Gao L, Ye D, Zhou Y, Chen J, Wang J, Wu M, Liu H, Kang J:Critical regulation of mir-200/zeb2 pathway in oct4/sox2-induced mesenchymal-to-epithelial transition and induced pluripotent stem cell generation.Proc Natl Acad Sci U S A2013,110(8):2858–2863.
41. Balik V, Srovnal J, Sulla I, Kalita O, Foltanova T, Vaverka M, Hrabalek L, Hajduch M:Meg3: a novel long noncoding potentially tumour-suppressing rna in meningiomas.J Neurooncol2013, 112(1):1–8.
42. Braconi C, Kogure T, Valeri N, Huang N, Nuovo G, Costinean S, Negrini M, Miotto E, Croce CM, Patel T:microrna-29 can regulate expression of the long non-coding rna gene meg3 in hepatocellular cancer.
Oncogene2011,30(47):4750–4756.
43. Wang P, Ren Z, Sun P:Overexpression of the long non-coding rna meg3 impairs in vitro glioma cell proliferation.J Cell Biochem2012, 113(6):1868–1874.
44. Hanahan D, Coussens LM:Accessories to the crime: functions of cells recruited to the tumor microenvironment.Cancer Cell2012, 21(3):309–322.
45. Yamano Y, Asano A, Ohyama K, Ohta M, Nishio R, Morishima I:Expression of the ha-ras suppressor family member 5 gene in the maturing rat testis.Biosci Biotechnol Biochem2008,72(5):1360–1363.
46. Arbiser JL, Petros J, Klafter R, Govindajaran B, McLaughlin ER, Brown LF, Cohen C, Moses M, Kilroy S, Arnold RS, Lambeth JD:Reactive oxygen generated by nox1 triggers the angiogenic switch.Proc Natl Acad Sci U S A2002,99(2):715–720.
47. Bracken CP, Gregory PA, Kolesnikoff N, Bert AG, Wang J, Shannon MF, Goodall GJ:A double-negative feedback loop between zeb1-sip1 and the microrna-200 family regulates epithelial-mesenchymal transition.Cancer Res2008,68(19):7846–7854.
48. Burk U, Schubert J, Wellner U, Schmalhofer O, Vincan E, Spaderna S, Brabletz T:A reciprocal repression between zeb1 and members of the mir-200 family promotes emt and invasion in cancer cells.EMBO Rep2008,9(6):582–589.
49. Hodgson G, Hager JH, Volik S, Hariono S, Wernick M, Moore D, Nowak N, Albertson DG, Pinkel D, Collins C, Hanahan D, Gray JW:Genome scanning with array cgh delineates regional alterations in mouse islet carcinomas.Nat Genet2001,29(4):459–464.
50. Guan Y, Kuo W-L, Stilwell JL, Takano H, Lapuk AV, Fridlyand J, Mao J-H, Yu M, Miller MA, Santos JL, Kalloger SE, Carlson JW, Ginzinger DG, Celniker SE, Mills GB, Huntsman DG, Gray JW:Amplification of pvt1 contributes to the pathophysiology of ovarian and breast cancer.Clin Cancer Res
2007,13(19):5745–5755.
51. Fridman JS, Lowe SW:Control of apoptosis by p53.Oncogene2003, 22(56):9030–9040.
52. Liang Y, Liu J, Feng Z:The regulation of cellular metabolism by tumor suppressor p53.Cell Biosci2013,3(1):9.
53. Chimge N-O, Frenkel B:The runx family in breast cancer: relationships with estrogen signaling.Oncogene2012,32(17):2121–2130.
54. Blyth K, Cameron ER, Neil JC:The runx genes: gain or loss of function in cancer.Nat Rev Cancer2005,5(5):376–387.
55. Janes KA:Runx1 and its understudied role in breast cancer.Cell Cycle
2011,10(20):3461–3465.
56. Liu Y-N, Lee W-W, Wang C-Y, Chao T-H, Chen Y, Chen JH:Regulatory mechanisms controlling human e-cadherin gene expression.
Oncogene2005,24(56):8277–8290.
57. Chen L-F:Tumor suppressor function of runx3 in breast cancer.J Cell Biochem2012,113(5):1470–1477.
58. Asselin-Labat M-L, Sutherland KD, Vaillant F, Gyorki DE, Wu D, Holroyd S, Breslin K, Ward T, Shi W, Bath ML, Deb S, Fox SB, Smyth GK, Lindeman GJ, Visvader JE:Gata-3 negatively regulates the tumor-initiating capacity of mammary luminal progenitor cells and targets the putative tumor suppressor caspase-14.Mol Cell Biol2011,31(22): 4609–4622.
59. Grillo G, Turi A, Licciulli F, Mignone F, Liuni S, Banfi S, Gennarino VA, Horner DS, Pavesi G, Picardi E, Pesole G:Utrdb and utrsite (release 2010): a collection of sequences and regulatory motifs of the untranslated regions of eukaryotic mrnas.Nucleic Acids Res2010,38(suppl 1): 75–80.
60. Lewis BP, Burge CB, Bartel DP:Conserved seed pairing, often flanked by adenosines, indicates that thousands of human genes are microrna targets.Cell2005,120(1):15–20.
61. Grimson A, Farh KK-H, Johnston WK, Garrett-Engele P, Lim LP, Bartel DP: Microrna targeting specificity in mammals: determinants beyond seed pairing.Mol Cell2007,27(1):91–105.
62. Ellwanger DC, Büttner FA, Mewes H-W, Stümpflen V:The sufficient minimal set of mirna seed types.Bioinformatics2011,
27(10):1346–1350. doi:10.1186/1752-0509-8-83
Cite this article as:Paciet al.:Computational analysis identifies a sponge interaction network between long non-coding RNAs and messenger RNAs in human breast cancer.BMC Systems Biology20148:83.
Submit your next manuscript to BioMed Central and take full advantage of:
• Convenient online submission • Thorough peer review
• No space constraints or color figure charges • Immediate publication on acceptance
• Inclusion in PubMed, CAS, Scopus and Google Scholar • Research which is freely available for redistribution
Submit your manuscript at www.biomedcentral.com/submit