ISSN: 2089-3272, DOI: 10.11591/ijeei.v6i2.382 172
Target Network Selection Algorithm based on Required Dwell
Time Estimation
Jyoti Verma, Sunanda Gupta, Pratima Manhas, Vasudha Arora Manav Rachna International Institute of Research and Studies India, India
Article Info ABSTRACT
Article history: Received Jan 3, 2018 Revised Jan 22, 2018 Accepted May 2, 2018
In wireless communication of fourth generation the expectation to integrate a diverse heterogeneous wireless network leads to a worldwide seamless mobility. For seamless mobility in heterogenous wireless networks, selection of best target network from available network is primary goal for handovers. To achieve this goal, we devise a target network selection algorithm to enhance the user satisfaction level.The method relies on a dwell time and prediction of received signal strength. By observing the Predicted received signal strength for a specified dwell time duration, a mobile node is able to decide whether to tigger the handoff process or not. Once the handoff process is triggered. Target network is selected depending upon a cost function. The Simulated results shows that, the proposed algorithm improves the handover performance by measuring the received signal strength accurately. It also selects the optimum target network quantitatively. Therefore, results obtained through our proposed algorithm are more accurate as compared to existing handover algorithms.
Keyword:
Next Generation Wireless Networks (NGWN) Received Signal Ssrength (RSS)
Predicted Received Signal Strength (PRSS)
Wireless Local Area Network
(WLAN) Copyright © 2018 Institute of Advanced Engineering and Science. All rights reserved.
Corresponding Author: Jyoti Verma
Manav Rachna International Institute of Research and Studies
Delhi Suraj Kund Road, Sector 43, Faridabad, Haryana 121004, India
Email: [email protected]
1. INTRODUCTION
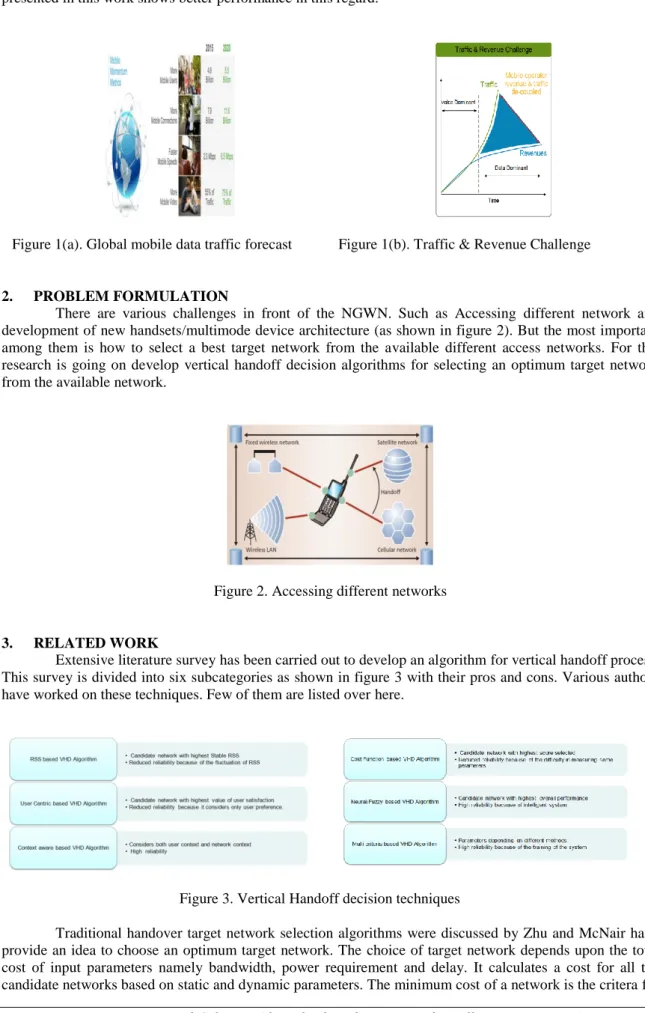
Global Mobile Data Traffic Forecast by Cisco as shown in figure 1(a) predicts that mobile data traffic will grow nearly 10-fold by 2020 from 2015. In which around 75% of all mobile data traffic will be of video by 2019, it is currently 55%. Gadgets with speeds higher than 5G speeds will have approximately 80% of all mobile traffic by 2020. Emerging applications including video conferencing, telemedicine, interactive gaming and mobile education systems will also demand high bandwidth. It means there will be a high rise in mobile data traffic in near future.
Figure 1(b) shows, as the network traffic is increasing day by day network operators cannot afford to support such high demand with limited data resources. Scarcity of resources with increased demand creates a problem of Data Crises. To resolve the problem of data crises, Next Generation Wireless Networks (NGWN) are being evolved i.e. today’s Cellular Networks, are becoming heterogeneous in terms of applications, devices and infrastructure.
The heterogeneous architecture of NGWN wireless networks offers variable coverage, continuous internet facility and QoS to mobile user. But this heterogenity give rise to a problem of handoff failure and selection of desired network. A handoff failure can degrade the quality of service and can also interrupt the ongoing communication. So it is essential that the handover process should be executed seamlessly and accurately to improve the quality of service. The multimedia applications like video streaming, VOIP, web browsing requires good quality of service. Therefore it is mandatory to provide the good quality of a network performance with best network. In the vertical handover, quality can be define as reduction in handoff failue by triggering the handoff process at an appropriate time, reduction in interruption in the ongoing call during
handover and enhancing the user satisfaction level by selecting the best target network [1, 2].The scheme presented in this work shows better performance in this regard.
Figure 1(a). Global mobile data traffic forecast Figure 1(b). Traffic & Revenue Challenge
2. PROBLEM FORMULATION
There are various challenges in front of the NGWN. Such as Accessing different network and development of new handsets/multimode device architecture (as shown in figure 2). But the most important among them is how to select a best target network from the available different access networks. For this research is going on develop vertical handoff decision algorithms for selecting an optimum target network from the available network.
Figure 2. Accessing different networks
3. RELATED WORK
Extensive literature survey has been carried out to develop an algorithm for vertical handoff process. This survey is divided into six subcategories as shown in figure 3 with their pros and cons. Various authors have worked on these techniques. Few of them are listed over here.
Figure 3. Vertical Handoff decision techniques
Traditional handover target network selection algorithms were discussed by Zhu and McNair have provide an idea to choose an optimum target network. The choice of target network depends upon the total cost of input parameters namely bandwidth, power requirement and delay. It calculates a cost for all the candidate networks based on static and dynamic parameters. The minimum cost of a network is the critera for
selecting the best target network. The simulated results shows the improvement gain in call blocking probability. However, this approach lacks in assigning the weights and normalizing the QoS parameters [3-5].
After that in 2013, Kunarak and Suleesathira proposed a Fuzzy and Mamdani based algorithm to to provide good connectivity with different network, reduction in call dropping and good quality of service. Depending upon the type of application, policies are designed to trigger the handoff process.The algorithm avoids the unnecessary handoff and maximize the utilization of WLAN network for real time application [6].
4. METHODOLOGY
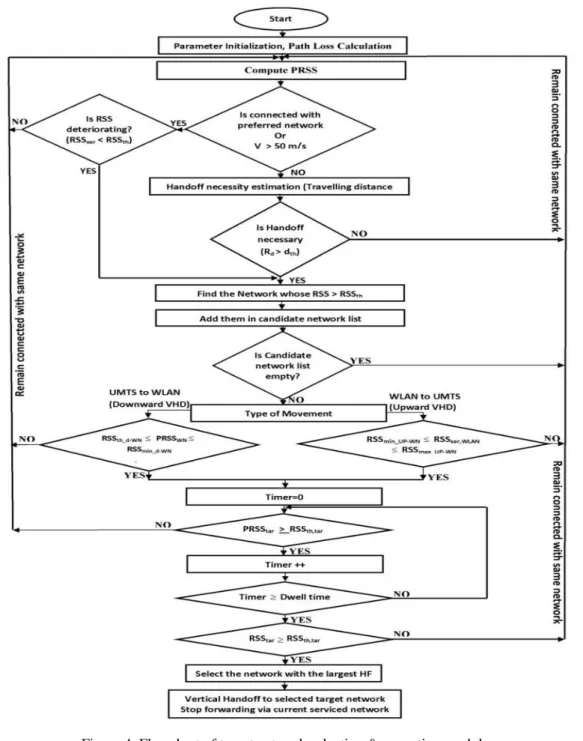
In this section, target network selection algorithm based on predicted received signal strength, dwell time and cost function (PTD) is presented. The presented handoff process comprises of three algorithms namely Handoff Necessity Estimation, Handoff Triggering Approach and Target Network Selection Algorithm. The flow chart and work flow of proposed algorithm is shown in figure 4 and figure 5.
Figure 5. Work Flow of Proposed vertical Handoff Decision Algorithm
4.1. Handoff Necessity Estimation
This algorithm determines whether the handoff is required or not. It compares the predicted RSS of current serviced network and with the threshold RSS of a network. If PRSS decreases, handoff is required. Otherwise, no need to handoff. The condition for estimating the necessity of handoff and use of Levenberg-Marquardt Algorithm for predicting the RSS is given below.
4.1.1. Received Signal Strength Prediction Using Levenberg-Marquardt Algorithm
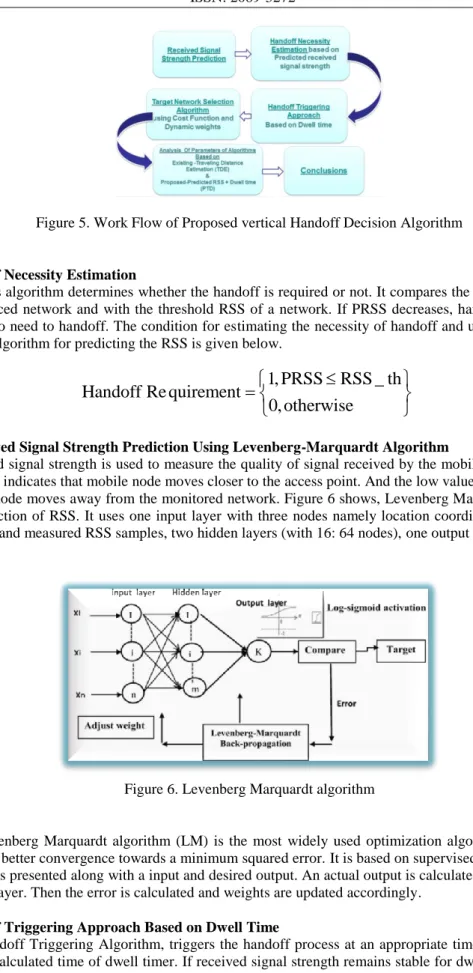
The Received signal strength is used to measure the quality of signal received by the mobile node. The high value of RSS indicates that mobile node moves closer to the access point. And the low value of RSS indicates that mobile node moves away from the monitored network. Figure 6 shows, Levenberg Marquardt algorithm for the prediction of RSS. It uses one input layer with three nodes namely location coordinates, velocity of mobile node and measured RSS samples, two hidden layers (with 16: 64 nodes), one output node [7].
Figure 6.Levenberg Marquardt algorithm
Levenberg Marquardt algorithm (LM) is the most widely used optimization algorithm. It is faster and provides better convergence towards a minimum squared error. It is based on supervised Learning, that is the network is presented along with a input and desired output. An actual output is calculated for each neuron of the input layer. Then the error is calculated and weights are updated accordingly.
4.2. Handoff Triggering Approach Based on Dwell Time
Handoff Triggering Algorithm, triggers the handoff process at an appropriate time. It observes the PRSS for a calculated time of dwell timer. If received signal strength remains stable for dwell time duration, then only handoff algorithm is triggered [8].
The right time to trigger the handoff process helps to improve the handoff performance because too early or too late initiated handoff process degrades the QoS drastically.
1, PRSS
RSS _ th
Handoff Re quirement
0, otherwise
4.2.1. Handoff Triggering Policies -- Inclusion of Dwell time
In Existing RSS with hysteresis margin handoff decision algorithms, handoff occurs whenever the RSS of neighboring network exceeds the received signal strength of serving base station by a hysteresis margin. Therefore they suffers from serious ping-pong effect due to fluctuation in RSS.
For reducing the ping-pong effect, handoff should be performed only when RSS remains constant for a specified time. Therefore, concept of dwell timer is introduced in our algorithm to obtain stable RSS.
Proposed PRSS, Dwell time and cost function based vertical handoff decision (PTD) algorithm
In our proposed algorithm, the RSS of a neighbor network and the RSS of serving network are compared for a specific duration of dwell time. If RSS of a neighbor network remains high till the dwell time duration than only handoff process is triggered .
For i = 1 to dwell timer value
end
4.2.2. Dwell time Estimation
Dwell time holds a specific value of time depending upon the velocity of mobile node. It is inversely proportional to the velocity. For our algorithm dwell time ranges in between 0 to 10 sec. Its value is 8 to10 sec for slow velocity user, 4 to 7 for medium velocity user and 0 to 3 for high velocity user.
4.2.3. Velocity Estimation
Velocity is measured through accelerometer embedded in the mobile node itself. 4.3. Target Network Selection Using Cost Function
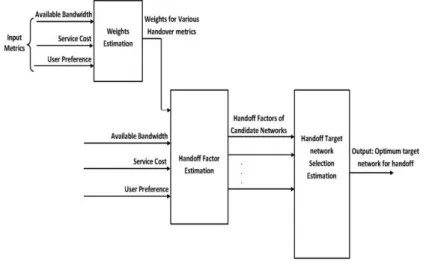
Handoff Target Network Selection algorithm using Cost function is used to select the best target network from the available networks. In this, all available networks are analyzed in terms of bandwidth, cost, and user preference. Figure 7 shows the block diagram of Target Network Selection Module. It includes Weight Estimation unit to calculate the weights of input decision parameters. And Handoff Factor Estimation unit to calculate the cost of all available networks. The Handoff Factor is a function of available bandwidth (BW), usage cost of the network (CO), and user preference (UP). The Handoff Factor is a score function, which takes a final decision of selecting a best target network from a set of available networks. The network, which has the highest value of “Handoff Factor (HF)” is selected as the best interface for handoff and all the current information of the current network are transported to the newly selected target network.
Figure 7. Block diagram of Handoff target network selection module
4.3.1.Weights Estimation Unit
The Weights Estimation unit takes available bandwidth, service cost and user preference as input decision parameters, and generates weight factors for these handover decision parameters as outputs. Weight
nn Serving
factors of handover decision parameters shows the importance (weightage) levels for the user. Let us assume, if calculated weights of bandwidth is 0.6, user preference is 0.3, and usage cost is 0.1. Than it shows that user wants to give more weightage to bandwidth while choosing the best target network from available network.
Weight Estimation unit calculates weight factors of input parameters using a method described below. The method assumes that the weight factors of the network parameters, available bandwidth, monetary cost, and user preference, are WBW, WCO, WUP, respectively. The values of these weights are
fraction and the summation of all weights can be up to one. Where WBW + WCO + WUP = 1.
To add the different units normalization of input parameters is necessary [9 -10]. The normalized value of input parameters (Bandwidth, Cost, and User preference) can be calculated as
l min l max min BW BW N(BW ) BW BW (1) l min l max min CO CO N(CO ) CO CO (2) l min l max min UP UP N(UP ) UP UP (3)
Where BWmax and BWmin are the maximum and minimum bandwidth. Cmax and Cmin are the maximum and
minimum service cost offered by network l. The user preference (UP) range is from 0 to 10. User preference is high, when a user prefers to select WLAN, otherwise it is low. For D candidate networks Mean and Standard Deviation of bandwidth, cost, and user preference can be calculated as
D BW t t 1
1
m
N(BW )
D
(4) D CO t t 11
m
N(CO )
D
(5) D UP t t 11
m
N(UP )
D
(6) D BW t BW t 11
(
)
(D(BW ) m
)
D 1
(7) D co t co t 11
(
)
(D(co ) m )
D 1
(8) D UP t UP t 11
(
)
(D(UP ) m )
D 1
(9)The smaller mean shows, the more important the factor is. The larger the standard deviation is, the larger the weight should be assigned [10]. It leads to adjust the weights dynamically by
BW
exp( m
BW BW)
(10)CO
exp( m
CO CO)
UP
exp( m
UP UP)
(12)Letting
BW
CO
UP, the dynamic weights are defined asDynamic weight for Bandwidth
(W
BW)
BW
(13)Dynamic weight for Cost
(W )
CO
CO
(14)Dynamic weight for User preference
(W )
UP
UP
(15)Through equation 13 to 15, the mobile node is able to assign weights to the network parameters dynamically. 4.3.2 Handoff Factor Estimation
The Handoff Factor (HF) is used to evaluates the cost of available networks. It is a function of input parameters and their weights. The Handoff Factor (HF) of a certain network M, is calculated using the following equation [10, 12, 13].
BW M
co
M
UP
M
M M D M D M D W BW W 1 / CO W UP HF max BW ,... BW 1 1 max UP ,... UP max ,... CO CO (16)Where BWM, COM, UPM stands for available bandwidth, service cost, and user preference.
Lastly, the network with a Handoff Factor (HF) of max (HF1 ; : : : ;HFD) is selected as the handover
target network. Where D is the total number of available networks.
5.
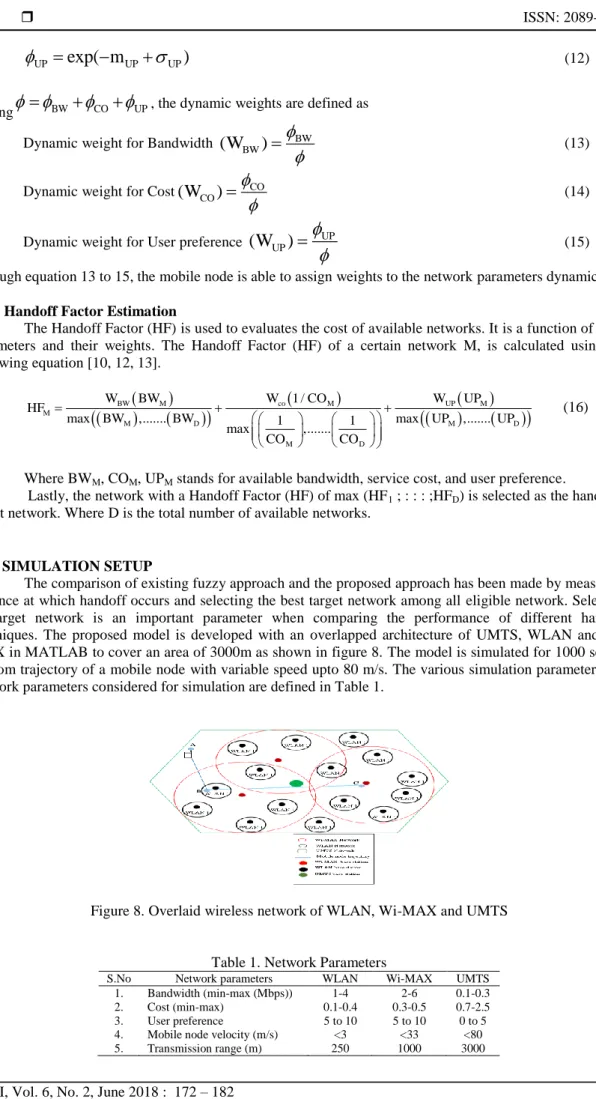
SIMULATION SETUPThe comparison of existing fuzzy approach and the proposed approach has been made by measuring distance at which handoff occurs and selecting the best target network among all eligible network. Selection of target network is an important parameter when comparing the performance of different handoff techniques. The proposed model is developed with an overlapped architecture of UMTS, WLAN and Wi-MAX in MATLAB to cover an area of 3000m as shown in figure 8. The model is simulated for 1000 sets of random trajectory of a mobile node with variable speed upto 80 m/s. The various simulation parameters and network parameters considered for simulation are defined in Table 1.
Figure 8. Overlaid wireless network of WLAN, Wi-MAX and UMTS
Table 1. Network Parameters
S.No Network parameters WLAN Wi-MAX UMTS 1. Bandwidth (min-max (Mbps)) 1-4 2-6 0.1-0.3 2. Cost (min-max) 0.1-0.4 0.3-0.5 0.7-2.5 3. User preference 5 to 10 5 to 10 0 to 5 4. Mobile node velocity (m/s) <3 <33 <80 5. Transmission range (m) 250 1000 3000
6. RESULTS AND ANALYSIS
The proposed model estimates the requirement of making a handoff and triggers the handoff process at an appropriate time to selects an optimum target network at each point which has the highest value of Handoff Factor during its movement. The results of our proposed algorithm based on Predicted Received Signal Strength and Dwell Time (PTD) are compared with the Existing Travelling Distance Algorithm based on Fuzzy and Mamdani (TDE) [6].
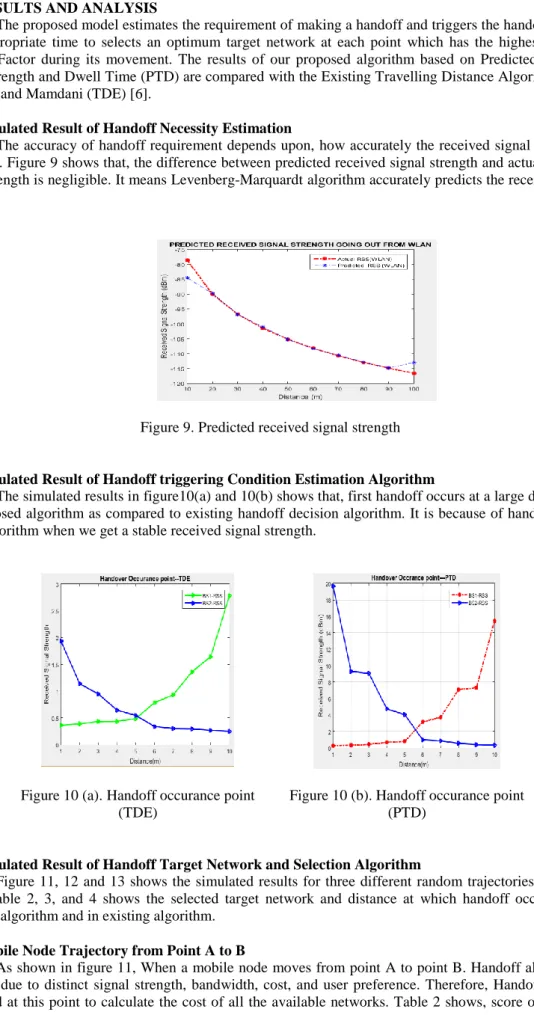
a. Simulated Result of Handoff Necessity Estimation
The accuracy of handoff requirement depends upon, how accurately the received signal strength is measured. Figure 9 shows that, the difference between predicted received signal strength and actual received signal strength is negligible. It means Levenberg-Marquardt algorithm accurately predicts the received signal strength.
Figure 9. Predicted received signal strength
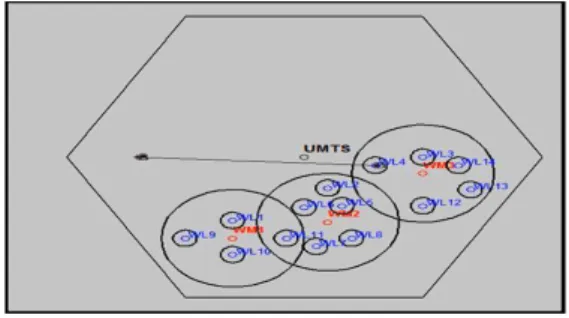
b. Simulated Result of Handoff triggering Condition Estimation Algorithm
The simulated results in figure10(a) and 10(b) shows that, first handoff occurs at a large distance for our proposed algorithm as compared to existing handoff decision algorithm. It is because of handoff occurs in our algorithm when we get a stable received signal strength.
Figure 10 (a). Handoff occurance point (TDE)
Figure 10 (b). Handoff occurance point (PTD)
c. Simulated Result of Handoff Target Network and Selection Algorithm
Figure 11, 12 and 13 shows the simulated results for three different random trajectories of mobile nodes. Table 2, 3, and 4 shows the selected target network and distance at which handoff occurs in our proposed algorithm and in existing algorithm.
1) Mobile Node Trajectory from Point A to B
As shown in figure 11, When a mobile node moves from point A to point B. Handoff algorithm is triggered due to distinct signal strength, bandwidth, cost, and user preference. Therefore, Handoff factor is calculated at this point to calculate the cost of all the available networks. Table 2 shows, score obtained by
eligible networks, distance at which handoff occurs through our presented algorithm and qualitative selection of preferred network through existing algorithm.
Figure 11. Mobile node movement from point A to B
Table 2. Preferred Network (Mobile Node Movement from Point A to B) Mobile node Location Candidate Network Handoff Factor (PTD) Handoff Factor (TDE) Preferred Network (PTD) Preferred Network (TDE) Distance at which Handoff Occur (PTD) Distance at which Handoff Occur (PTD B Wi-MAX 2 0.01 Low WLAN 4 Wi-MAX 3 1000, 50 900,45
Wi-MAX 3 1.41 High WLAN 3 WLAN 3 1.45 High WLAN 4
WLAN 4 1.50 High WLAN 14
WLAN 8 1.34 Medium WLAN 12 0.93 Medium WLAN 13 0.95 Medium WLAN 14 1.43 High
2) Mobile Node Trajectory from Point B to C
As shown in figure 12, when mobile node moves from point B to point C. The Handoff Factor of Wi-Max is high as compared to other candidate network. Therefore, it is selected as preferred network through our algorithm. On the other hand, handoff factor given by existing technique is in terms of low and high signal strength value. As the signal strength of Wi-MAX 2, WLAN 5, and WLAN 6 is high. Therefore, they are selected as preferred network as shown in table 3.
Table 3. Preferred Network (Mobile Node Movement from Point B to C) Mobile node Location Candidate Network Handoff Factor (PTD) Handoff Factor (TDE) Preferred Network (PTD) Preferred Network (TDE) Distance at which Handoff Occur (PTD) Distance at which Handoff Occur (TDE)
C Wi-MAX 2 1.81 High Wi-MAX2 Wi-MAX 2 200, 350 110,298
Wi-MAX 3 0.37 Medium WLAN 5 Wi-MAX 1 1.15 Medium WLAN 6
WLAN 2 1.18 Medium WLAN 5 1.89 High WLAN 6 1.78 High WLAN 7 0.45 Medium WLAN 8 0.84 Medium WLAN 11 0.08 Medium
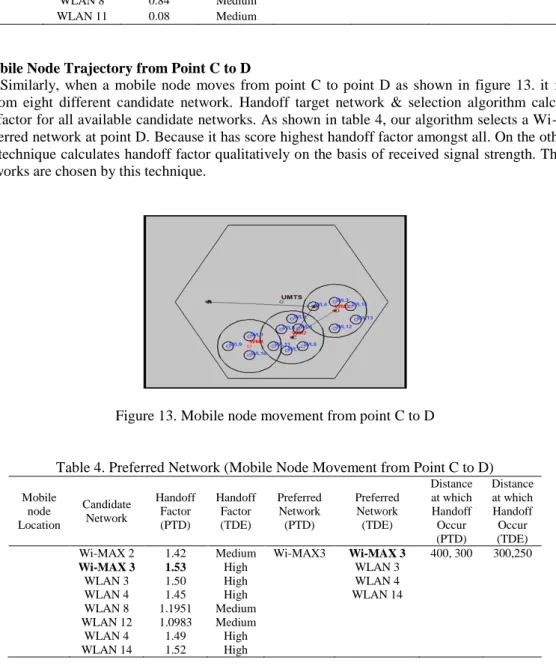
3) Mobile Node Trajectory from Point C to D
Similarly, when a mobile node moves from point C to point D as shown in figure 13. it receives signal from eight different candidate network. Handoff target network & selection algorithm calculates a handoff factor for all available candidate networks. As shown in table 4, our algorithm selects a Wi-MAX 3 as a preferred network at point D. Because it has score highest handoff factor amongst all. On the other hand existing technique calculates handoff factor qualitatively on the basis of received signal strength. Therefore, four networks are chosen by this technique.
Figure 13. Mobile node movement from point C to D
Table 4. Preferred Network (Mobile Node Movement from Point C to D) Mobile node Location Candidate Network Handoff Factor (PTD) Handoff Factor (TDE) Preferred Network (PTD) Preferred Network (TDE) Distance at which Handoff Occur (PTD) Distance at which Handoff Occur (TDE) Wi-MAX 2 1.42 Medium Wi-MAX3 Wi-MAX 3 400, 300 300,250
Wi-MAX 3 1.53 High WLAN 3
WLAN 3 1.50 High WLAN 4 WLAN 4 1.45 High WLAN 14 WLAN 8 1.1951 Medium
WLAN 12 1.0983 Medium WLAN 4 1.49 High WLAN 14 1.52 High
7.
CONCLUSIONIn this paper, three algorithms are proposed to enhance the performance of vertical handoff decision algorithm. The prediction method provides the future values of received signal strength received by the mobile node. It enables the mobile node to accurately determine the necessity of handoff requirement. The inclusion of dwell time in triggering algorithm, alleviate unnecessary handoff and triggers the handoff process at an appropriate time. A handoff Factor based target network selection algorithm improves accuracy of decision method. Our presented algorithm selects an optimum target network on the basis of quantitative
value of handoff factor. On the other hand, existing technique selects two to three target network on the basis of qualitative value of received signal strength. Therefore, our method is more accurate as compared to existing algorithm.
REFERENCES
[1] Gazis V, Alonistioti N, Merakos L. Toward a generic" always best connected" capability in integrated
WLAN/UMTS cellular mobile networks (and beyond). IEEE Wireless Communications. 2005 Jun;12(3):20-9. [2] Dutta A, Das S, Famolari D, Ohba Y, Taniuchi K, Fajardo V, Lopez RM, Kodama T, Schulzrinne H. Seamless
proactive handover across heterogeneous access networks. Wireless Personal Communications. 2007 Nov 1;43(3):837-55.
[3] Wang HJ, Katz RH, Giese J. Policy-enabled handoffs across heterogeneous wireless networks. Proceedings of Second IEEE Workshop on Mobile Computing Systems and Applications (WMCSA'99),1999 Feb 25: 51-60, IEEE. [4] Zhu F, McNair J. Optimizations for vertical handoff decision algorithms. In IEEE Conference on Wireless
Communications and Networking (WCNC). 2004 Mar 21; 2: 867-872.
[5] Zhu F, McNair J. Multiservice vertical handoff decision algorithms. EURASIP Journal on wireless communications and networking. 2006 Dec 1; 2006(1): 025861.
[6] Kunarak S, Suleesathira R. Algorithmic vertical handoff decision and merit network selection across heterogeneous wireless networks. WSEAS Transactions on Communications. 2013 Jan;12(1):1-3.
[7] Madaan J, Kashyap I. A Novel Handoff Necessity Estimation Approach Based on Travelling Distance. I.J. Intelligent Systems and Applications. 2018, 10(1): 46-57.
[8] Madaan J, Kashyap I. Travelling Distance Estimation Based Approach to Minimize Unnecessary Handovers.
Recent Advances in Electrical & Electronic Engineering (Formerly Recent Patents on Electrical & Electronic Engineering). 2017 Aug 1;10(2):110-20.
[9] Lee W, Kim E, Kim J, Lee I, Lee C. Movement-aware vertical handoff of WLAN and mobile WiMAX for seamless ubiquitous access. IEEE Transactions on Consumer Electronics. 2007 Nov;53(4).
[10] He D, Chi C, Chan S, Chen C, Bu J, Yin M. A simple and robust vertical handoff algorithm for heterogeneous wireless mobile networks. Wireless Personal Communications. 2011 Jul 1;59(2):361-73.
[11] Xia L, Ling-ge J, Chen H, Hong-Wei L. An intelligent vertical handoff algorithm in heterogeneous wireless networks. In IEEE International Conference on Neural Networks and Signal Processing. 2008 Jun 7 : 550-555. [12] Nasser N, Hasswa A, Hassanein H. Handoffs in fourth generation heterogeneous networks. IEEE Communications
Magazine. 2006 Oct;44(10):96-103.
[13] Midya S, Majumder K, Roy A, De D. Vertical Handoff Mechanisms in VANET: A Survey. InProceedings of the Second International Conference on Information and Communication Technology for Competitive Strategies. 2016 Mar 4 : 129, ACM.