Gloaguen, Yoann (2017)
Supporting analysis, visualisation and biological
interpretation of metabolomics datasets.
PhD thesis.
http://theses.gla.ac.uk/8433/
Copyright and moral rights for this work are retained by the author
A copy can be downloaded for personal non-commercial research or study, without prior permission or charge
This work cannot be reproduced or quoted extensively from without first obtaining permission in writing from the author
The content must not be changed in any way or sold commercially in any format or medium without the formal permission of the author
When referring to this work, full bibliographic details including the author, title, awarding institution and date of the thesis must be given
Enlighten:Theses
http://theses.gla.ac.uk/
S
UPPORTING ANALYSIS
,
VISUALISATION
AND BIOLOGICAL INTERPRETATION OF
METABOLOMICS DATASETS
Y
OANN
G
LOAGUEN
SUBMITTED IN FULFILMENT OF THE REQUIREMENTS FOR THE DEGREE OF
Doctor of Philosophy
I
NSTITUTE OF
I
NFECTION
, I
MMUNITY AND
I
NFLAMMATION
C
OLLEGE OFM
EDICAL, V
ETERINARY ANDL
IFES
CIENCESU
NIVERSITY OFG
LASGOWMARCH2017
Abstract
Over the past decades, the emerging omics technologies have enabled scientists to take a step further in the investigation of biological systems. From food safety to stratified medicine, omics technologies are now an essential and powerful means to study biological processes. Omics technologies are however at different stages of maturity, and the most recent field of the omics family, metabolomics, is still in its infancy. Metabolomics attempts to catalogue, characterise and quantify all small molecules constitutive of a biological system. Liquid Chromatography - Mass Spectrometry (LCMS) is now the most commonly used technique to generate metabolomics data. The method allows the detection of hundreds of metabolites from a single sample and can provide a rapid assignment of formulae to detected masses using high accuracy mass spectrometers. While analytical methods are well developed, sup-port for linking metabolites to detected features and interpreting the results of a data analysis in a biological context is still poorly developed. Significant challenges also arise from the additional steps required to export the data to third party environments to create a biolog-ical context. The study of integrated omics datasets as a single system has also shown to provide greater inferences than the study of each omics separately. Methods to integrate the different omics layers of biological systems are, however, at an early stage of development and no standard approach currently exists to provide a holistic view of organisms systems organisation.
The objective of this thesis is to formalise, standardise and unify the data analysis of the metabolomics field, by providing to biologists the tools to support them from planning to analysis to biological impact reporting. The work presented here focuses particularly on untargeted LC-MS metabolomics approaches and attempts to assist non-expert users in per-forming their own analysis of metabolomics datasets. The project also aims to enable sys-tematic biological interpretation of metabolomics datasets. The first part of the thesis focuses on creating the foundation of a unified environment for LC-MS metabolomics data analysis. Subsequently, the created environment will be expanded to integrate and support the latest technological advances in the field and provide better support for both designing studies and
interpreting analysis results in a biological context. Finally, the last part of this thesis con-centrates on integrating metabolomics data with other omics datasets in an attempt to provide a holistic view of a biological system.
3
Table of Contents
1 Introduction 14 1.1 Omics technologies . . . 14 1.1.1 Omics layers . . . 14 1.1.2 Omics interactions . . . 16 1.2 Metabolomics . . . 161.2.1 Mass spectrometry metabolomics workflow . . . 17
1.3 LCMS Metabolomics . . . 18
1.3.1 Measurement and separation technologies . . . 18
1.3.2 Data format . . . 19
1.3.3 Data processing . . . 21
1.3.4 Data analysis platforms . . . 26
1.4 Programming languages, libraries and frameworks . . . 30
1.5 Biological networks . . . 31
1.6 Related work . . . 33
2 Materials and methods 34 2.1 Software engineering . . . 34
2.2 Data format . . . 35
2.3 Data analysis pipeline . . . 35
2.4 Web framework . . . 36
3 A semi-automated pipeline for untargeted metabolomics 37
3.1 Introduction . . . 37
3.2 Related work . . . 38
3.3 Integrated metabolomics workflow . . . 40
3.3.1 Data analysis workflow . . . 40
3.4 Untargeted metabolomics pipeline . . . 41
3.4.1 Data structure . . . 41
3.4.2 Context-sensitive visualisation . . . 47
3.4.3 Module based pipeline . . . 53
3.4.4 Data analysis . . . 56
3.4.5 Data exchange and data sharing . . . 58
3.4.6 Data interpretation . . . 59
3.5 Discussion . . . 68
3.6 Conclusion . . . 71
4 Extended metabolomics workflow for biological sciences 72 4.1 Introduction . . . 72
4.2 Related work . . . 73
4.3 Supporting study documentation . . . 75
4.3.1 Project management system . . . 76
4.3.2 Biochemical library . . . 80
4.4 Fragmentation data analysis . . . 85
4.4.1 Annotation tool and library . . . 86
4.4.2 FrAnK architecture and design . . . 87
4.4.3 Data capture and visualisation . . . 87
4.4.4 PiMP-FrAnK integration . . . 87
4.5 Biological network analysis . . . 92
4.5.1 Network reconstruction . . . 93
4.5.2 Network visualisation . . . 94
4.6 Discussion . . . 97
4.7 Conclusion . . . 100
5 Integrative analysis of omics datasets using a network approach 101
5.1 Introduction . . . 101
5.2 Related work . . . 102
5.3 Study design . . . 103
5.4 Data acquisition . . . 104
5.5 Metabolomics data analysis . . . 106
5.5.1 Quality control . . . 106
5.5.2 Time course analysis . . . 110
5.5.3 Biological class analysis . . . 111
5.5.4 Standard compounds analysis . . . 113
5.6 RNA-seq data analysis . . . 113
5.6.1 Data acquisition and analysis pipeline . . . 114
5.6.2 Gene networks . . . 115
5.7 Integrative analysis . . . 117
5.7.1 Multi omics network reconstruction . . . 117
5.8 Discussion . . . 120
5.9 Conclusion . . . 124
6 General discussion 125 A PiMP libraries 130 A.1 R libraries . . . 130
A.2 Python libraries . . . 132
A.3 JavaScript libraries . . . 133
B List of Standard compounds 134
C Integrated network pathway list 139
D List of metabolites mapped to the metabolic network 141
Bibliography 143
6
List of Tables
3.1 Typical metabolomics results table . . . 53
3.2 Support comparison of non-commercial metabolomics data processing pipelines 70 5.1 LC elution gradient . . . 105
5.2 Experiment design . . . 106
5.3 List of standard compounds significantly changing . . . 109
B.1 List of metabolite identified against standard compounds. . . 138
C.1 List of pathways covered by the network reconstructed from the differen-tially expressed genes. . . 140
D.1 List of metabolites found to be in the human metabolic network reconstructed from the RNA-seq data. . . 142
7
List of Figures
1.1 Omics layers organisation . . . 15
1.2 Triple quadrupole diagram . . . 19
1.3 Liquid Chromatography - Mass Spectrometry system . . . 20
1.4 LCMS 3-dimensional chromatogram . . . 21
1.5 Single mass spectrum selected from an LCMS data file . . . 22
1.6 LCMS 3-dimensional chromatogram - Extracted ion chromatogram . . . . 23
1.7 Ideom result page . . . 27
1.8 XCMS online interactive cloud plot . . . 28
1.9 Semantic enrichment of protein-protein interaction network . . . 32
1.10 Genome-scale reconstruction of the human metabolic network . . . 32
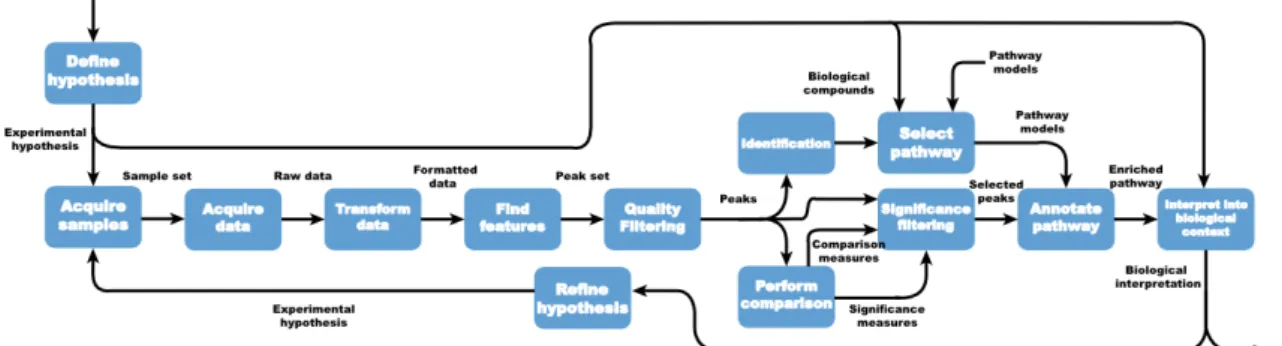
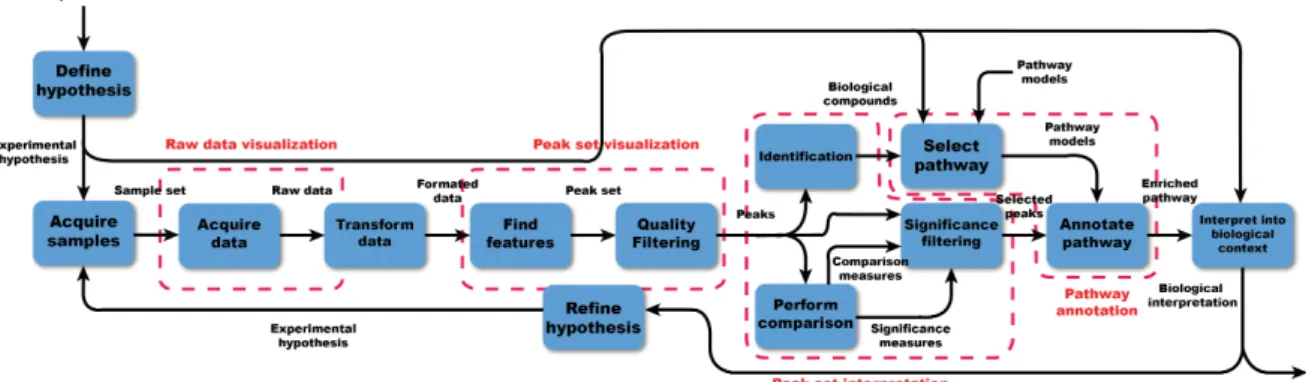
3.1 Model of an integrated metabolomics workflow from hypothesis generation to biological interpretation. . . 40
3.2 Area of limitation in a standard untargeted metabolomics workflow . . . 41
3.3 PiMP database structure . . . 43
3.4 Detailed structure of the Projects module . . . 44
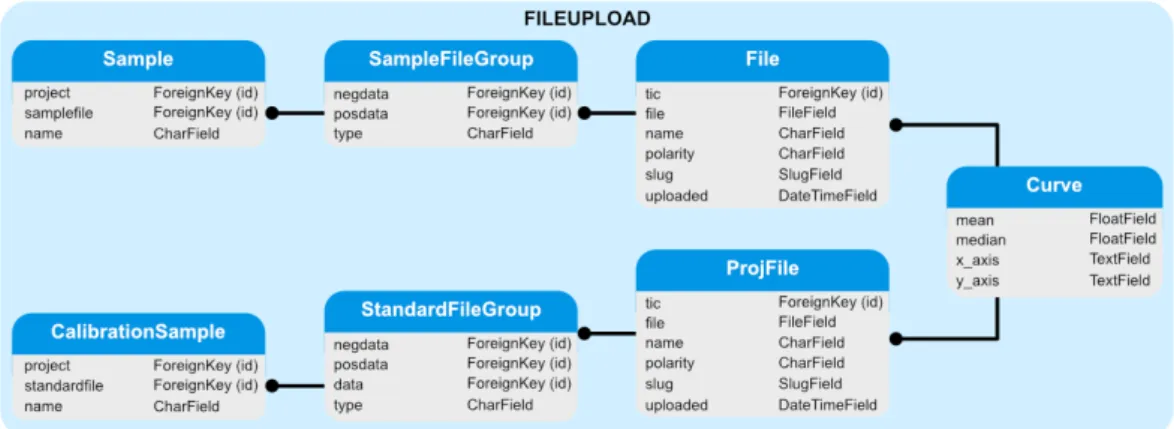
3.5 Detailed structure of the Fileupload module . . . 44
3.6 Detailed structure of the Groups module . . . 44
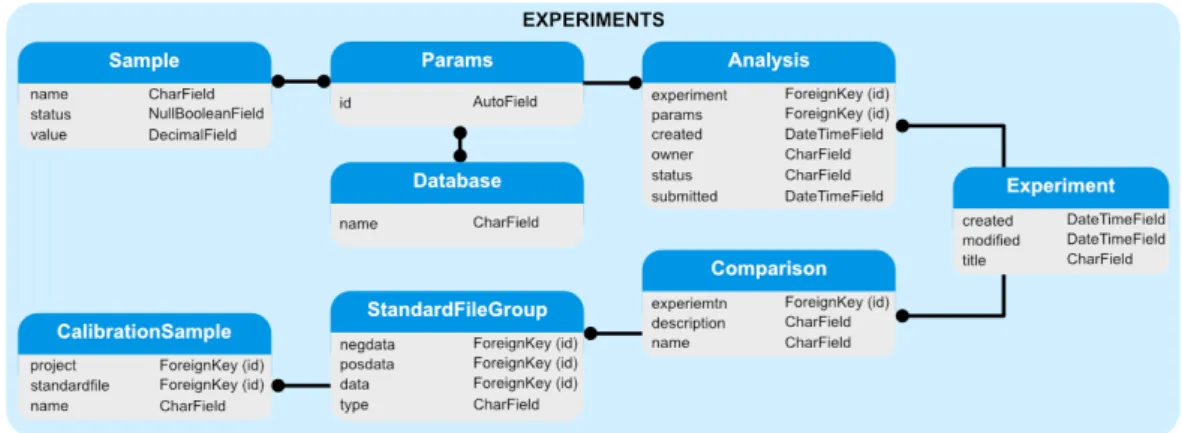
3.7 Detailed structure of the Experiments module . . . 45
3.8 Detailed structure of the Data module . . . 45
3.9 Detailed structure of the Compound module . . . 46
3.10 Metabolomics workflow activities that need support by context-sensitive data visualisation. . . 48
3.12 Total Ion Current visualisation . . . 48
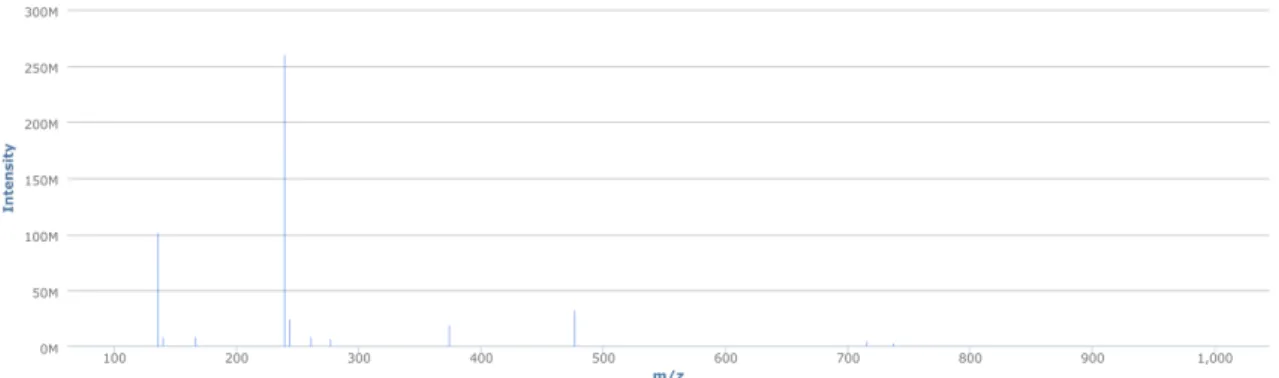
3.13 Mass spectra visualisation . . . 49
3.14 Total Ion Current of the positive ionisation of biological replicates . . . 50
3.15 Mean and median Total Ion Current . . . 50
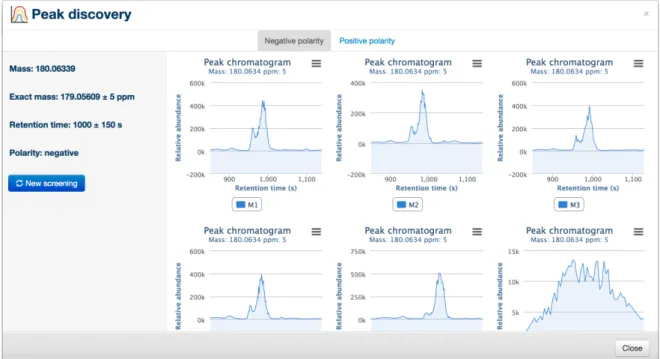
3.16 Peak discovery tool . . . 51
3.17 Peak discovery tool - results . . . 51
3.18 Peak set visualisation . . . 52
3.19 PiMP modular organisation . . . 54
3.20 PiMP data capture unit . . . 56
3.21 PiMP data processing unit . . . 57
3.22 Principal Component Analysis visualisation . . . 60
3.23 Volcano plot visualisation . . . 61
3.24 Evidence panel figures . . . 62
3.25 PiMP comparison table . . . 62
3.26 PiMP pathway visualisation tool . . . 63
3.27 PiMP metabolites tab . . . 65
3.28 PiMP compound card . . . 66
3.29 PiMP evidence cards organisation . . . 67
3.30 PiMP metabolites tab search tools . . . 67
4.1 Area of limitation of a standard untargeted metabolmics workflow . . . 75
4.2 Management system database strcuture . . . 77
4.3 Management system user interface . . . 79
4.4 Chemical library and network database communication protocol . . . 81
4.5 Glasgow Polyomics standard library table . . . 83
4.6 MetExplore metabolite table . . . 83
4.7 MetExplore pathway table . . . 83
4.8 MetExplore visualisation of a reconstructed network . . . 84
4.9 Tandem MS spectra . . . 85
4.10 Metabolomics workflow improvement area using fragmention data . . . 86
4.11 FrAnK fragment spectrum visualisation . . . 88
4.12 FrAnK annotation page . . . 88
4.13 PiMP - FrAnK database join at the project level . . . 89
4.14 PiMP - FrAnK database join at the peak level . . . 89
4.15 Comparison of MS1peak between MS and MS/MS acquisition . . . . 90
4.16 PiMP chained pipeline . . . 91
4.17 Fragmentation data in PiMP results environment . . . 91
4.18 Fragmentation data in peak card . . . 92
4.19 Integrated network analysis form . . . 93
4.20 PiMP - MetExplore communication . . . 94
4.21 Network visualsisation and filter tools . . . 95
4.22 PiMP integrated network visualisation . . . 96
5.1 Quality control of TICs . . . 107
5.2 Principal component analysis plot . . . 108
5.3 Volcano plot for control group time course analysis . . . 110
5.4 Volcano plots for PHA-activated group time course analysis . . . 111
5.5 Average intensities of the 4 identified metabolites significantly changing over time. . . 112
5.6 Volcano plots showing the differences found between the control and PHA-activated group at each respective time point. . . 112
5.7 Average intensities of the two metabolites significantly different in the two biological groups. . . 113
5.8 Extracted ion chromatograms . . . 114
5.9 Average base call accuracy . . . 115
5.10 Gene association integrated netowrk . . . 116
5.11 Reconstructed metabolic network from gene expression data . . . 118
5.12 Integrated multi-omics metabolic network . . . 119
5.13 Average intensities of metabolites found in the first cluster identified in the network. . . 122
5.14 Average intensities of amino acids . . . 123
Acknowledgements
Over the past four years, I have received support and encouragement from many individuals. Karl Burgess, my supervisor, has been incredibly helpful, regularly giving me valuable and insightful advice, and always being supportive and positive which made this experience a thoughtful and rewarding journey. I would like to thank Mike Barrett who led me during the first year and has been very supportive throughout these four years. I have also benefited from the support of many bioinformaticians and software developers within Glasgow University, Fraser Morton, David Wilson, Gavin Blackburn, Ronan Daly, Joe Wandy, Ross Gurden, Graham Hamilton, Simon Rogers, Manikhandan Mudaliar. I also like to thank Isabel Vincent and Justin van der Hooft amongst many people who tested over and over my software always giving meaningful feedback. Glasgow Polyomics provided me with a dynamic environment, and I would like to thank Glasgow Polyomics staff for the many insightful discussions we had over the past years. I also benefited from a four-year collaboration with Fabien Jourdan who is always welcoming and creative in his approaches to solving problems and surrounded by a great team of bioinformaticians. Finally, I would like to thank my family and Geraldine Camus who have been incredibly supportive for the past four years.
Author’s declaration
I declare that, except where explicit reference is made to the contribution of others, that this dissertation is the result of my own work and has not been submitted for any other degree at the University of Glasgow or any other institution.
Printed Name: YOANN GLOAGUEN Signature:
List of Abbreviations
↵7nAChR Oral keratinocyte alpha 7 nicotinic receptor
AJAX Asynchronous JavaScript and XML CODA Component detection algorithm
COSMOS COordination Of Standards In MetabOlomicS COW Correlation optimal warping
CPM Continuous profile mode CRP C-reactive protein
DDA Data dependent acquisition DIA Data-independent acquisition DTW Dynamic time warping EIC Extracted-ion chromatogram FrAnK Fragmentation annotation kit
GCMS Gas chromatography - mass spectrometry GP Glasgow Polyomics
HILIC Hydrophilic interaction liquid chromatography HPLC High-performance liquid chromatography JSON Javascript object notation
LCMS Liquid chromatography - mass spectrometry LIMS Laboratory information management systems MS Mass spectrometry
MSI Metabolomics Standard Initiative MS/MS Tandem mass spectrometry MVT Model view template
m/z Mass-to-charge ratio
NIST National Institute of Science and Technology NMR Nuclear magnetic resonance
OBI-Warp Ordered bijective interpolated warping ORM Object-relational mapping
PCA Principal component analysis
PiMP Polyomics Metabolomics integrated Pipeline PTMS Post-translational modification
PTW Parametric time warping TIC Total ion chromatogram ToF Time of flight
14
Chapter 1
Introduction
This chapter presents the necessary background to understand the organisation of biologi-cal systems into omics layers with an emphasis on liquid-chromatography mass spectrome-try metabolomics (LCMS). Measurement technologies, data formats and data processing of LCMS metabolomics are discussed, highlighting the challenges that the field is facing. The representation of omics data into biological networks is also introduced and reviewed in this section.
1.1 Omics technologies
Omics technologies attempt to characterise, quantify and help understanding relationships between all molecules constitutive of an organism. Over the past decades, the collection and interpretation of large-scale datasets have been powering new discoveries across all disci-plines in biomedical sciences. The recent advances in high-throughput omics technologies such as genomics, transcriptomics, proteomics and metabolomics and improvement in bioin-formatics have enabled the investigation of thousands of genes, proteins and metabolites si-multaneously. Omics technologies have now an essential role in many fields of biological research: toxicology [1] and environmental health [2], biomarker discovery [3] and cancer diagnostics [4], food safety [5] and nutrition [6] are some examples of the disciplines that now make systematic use of omics technologies to drive their research.
1.1.1 Omics layers
Omics technologies are divided into four main disciplines, each of them allowing the inves-tigation of four different parts of an organism or biological systems.
1.1. Omics technologies 15 Genomics focuses on the large-scale study of the genes and how they interact with one an-other by sequencing DNA molecules to determine the order of nucleotides. This technology enabled the Human Genome Project [7] whose aim was to determine the sequence of nu-cleotides that make human DNA. Transcriptomics is the study of messenger RNA (mRNA). The identification and quantification of these molecules provide a way to understand the ex-pression of genes better. The technology has evolved to allow the investigation of all species of transcripts such as small RNAs, non-coding RNAs as well as mRNAs [8]. Proteomics aspires to the large-scale identification and quantitation of the entire set of proteins present in an organism [9, 10]. Proteins are the reflection of gene expression through transcription and play a major role in the regulation of cell processes. Finally, the latest technology of the omics family, metabolomics, is the largescale study of the metabolites small molecules -present in an organism [11].
The complexity of omics technologies is however not linear. As illustrated in Figure 1.1, the complexity increases as the omics get closer to the phenotype. This is due to the growing number of arrangements the building blocks of each omics can take. Similarly, the number of molecules constitutive of each layer is not linear either. A single gene can indeed en-code for hundreds of protein isoforms (due to post-translational modification (PTMS) and alternative splicing) [12] which makes the system incredibly intricate to study as a whole. Moreover, mRNA transcript levels do not always correlate with respective protein expres-sion levels [13]. Omics technologies also attempt to explain the modification mechanisms that happen at different layers in the cells such as DNA methylation [14] which plays a significant role in gene expression, alternative splicing [15] and RNA editing [16], or post-translational modification of proteins [17].
1.2. Metabolomics 16
1.1.2 Omics interactions
While individual omics datasets are informative, and combined analysis of genomics, tran-scriptomics, proteomics and metabolomics data has been found to be useful for a deeper un-derstanding of fundamental biological processes, greater inferences can be obtained by inte-grating those datasets that are collected at different levels of biological organisation. Indeed, the first approach to multi-omics experiment has been to analyse them separately, in isolation of one another, and use the results as informative means to interpret another layer [18]. This combined analysis approach is an iterative process consisting of using information from one layer to focus the analysis of an another layer on a specific and narrow part. It, however, does not allow the study of omics layers as one system like integrative analyses. Indeed, integra-tive approcahes attempt to bring the datasets together in deifferent ways to interpret them as a whole. Various correlation-based approaches have been explored in an attempt to integrate multiple omics layers and extract meaningful information [19, 20]. Similarly, methods and software have been developed to assist and automate these approaches [21, 22, 23]. These methods have been successful in many cases, but all face the same challenge of connecting the different layers in a biological context, representing the interaction and process happen-ing between and within layers. Although progress is made towards that goal [24], standard methods to integrate multiple omics datasets in a biological context is yet to be developed to unleash the full potential of omics technologies [25].
1.2 Metabolomics
Metabolomics aims to provide a snapshot, at a specific point in time, of all chemical activities occurring in a cell, tissue or organism, allowing the study of the biological processes in place in response to a stress. The metabolome, however, unlike the genome, is not static, it reflects the changes happening at every level of a biological system and can be influenced by environmental factors. Two cells of the same organism can indeed reveal an entirely different set of small molecules while sharing the same genome. Thus, metabolomics is often seen as the layer linking genotypes and phenotypes [26].
Two leading measurement technologies are currently used in metabolomics, Nuclear Mag-netic Resonance (NMR) and Mass Spectrometry (MS). These two types of analysis offer dif-ferent views of the metabolome and are used for varying purposes. NMR, a non-destructive technology, is highly reproducible, provides structural information and absolute quantitation of the compounds observed. Mass spectrometry, in comparison, is a destructive technology, and requires isotopically labeled standards to provide anything other than relative abundance. However, MS offers higher sensitivity than NMR which allows the detection of many more metabolites. The choice of the technology usually depends on the design of the study and
1.2. Metabolomics 17 the question addressed. NMR can be used for studies requiring the absolute quantitation of a definite set of metabolites while mass spectrometry is preferred for the exploration of the metabolome in a more untargeted approach.
1.2.1 Mass spectrometry metabolomics workflow
Over the past decade, many MS approaches based on different instrumentations have been implemented to study the metabolism. LCMS is often used for untargeted approaches due to the diverse range of separation available, its large sample capacity, and straightforward sam-ple preparation methods. Gas chromatography - mass spectrometry (GCMS) is generally for targeted approaches as it offers absolute quantification for known compounds, a very high retention time reproducibility, but requires a derivatization step to make compounds volatile. Other analytical methods are available such as capillary electrophoresis - mass spectrome-try (CEMS) which offers high separation power but poor retention time reproducibility, or direct infusion - mass spectrometry which offers rapid analysis but no separation. These different type of approaches can be coupled with tandem mass spectrometry to provide a better structural elucidation of the compounds analysed. Tandem MS can be performed fol-lowing different protocol, Data dependent acquisition (DDA) allow the fragmentation and elucidation of the structure of a set predefined compounds, while data independent acquisi-tion (DIA) proceed to the fragmentaacquisi-tion of all ions present in the matrix. The measurement technologies, separation techniques and fragmentation procedures are introduced in more detailed in section 1.3 of this introduction.
Metabolomics laboratories and core facilities across the world use very similar overall work-flows in term of data handling. The raw data acquired on the MS instrument is generally stored in in-house servers and archived, the vendor formatted files are then duplicated and converted to an open format for processing purposes. Two types of processing workflows have been adopted by different laboratories, one uses commercial software such as Com-pound Discoverer (Thermo Fisher Scientific) or Progenesis QI (Nonlinear Dynamics - Wa-ters), the other makes use of freely available tools. Amongst the laboratories that use the free option, some use end to end data processing pipelines, other prefer to build their own pipeline using different tools for each step of the analysis. The different data analysis tools and plat-forms are discussed in section 1.3.4. Although there is a wide range of tools available, they all follow the same data processing steps. The analysis pipeline generally consist in 6 main steps: peak detection, peak alignment, data filtering, peak grouping, peak identification and statistical analysis. The order of these steps can slightly differ from one tool to another and several quality control steps can be introduced at a different stages of the pipeline. Those steps are detailed in section 1.3.3 of this introduction.
1.3. LCMS Metabolomics 18 not yet standardised in LCMS. Laboratories use different ways to capture data and document studies which can go from electronic lab books to internal Laboratory Information Manage-ment Systems (LIMS). No tool or LIMS is however used across metabolomics community as they are often very specific to the need of laboratory which implemented it. This creates disparity in the way studies are documented. The Metabolomics Standard Initiative (MSI) is however attempting to standardise the reporting of studies by providing rules and best prac-tices guidelines. Data repositories such as MetaboLights also now provides strict guidelines regarding the type of data that need to be captured to properly document a metabolomic study.
1.3 LCMS Metabolomics
1.3.1 Measurement and separation technologies
Mass spectrometry is an analytical technique that separates ionised chemical compounds by their mass-to-charge ratio (m/z) [27]. A mass spectrometer is constituted of 3 principal components with different purposes: the ion source imparts a charge to a molecule, the mass analyser separates ions, and the detector records ion signals. Several types of ionisation tech-niques are available, they are however not all appropriate for LCMS. Electron ionisation, for example, which produces a high degree of fragmentation is ordinarily coupled to gas chro-matography as it cannot be used at atmospheric pressure and require the entire system to be under high vacuum [28]. Electrospray ionisation [29] is the most widely used ion source for LCMS metabolomics and produces soft ionisation (which reduces fragmentation). Al-ternatively, matrix-assisted laser desorption/ionisation (MALDI) [30] is used for imaging, to inform on the spatial distribution profiles of metabolites in tissues [31]. Many mass analysers exist with different characteristics; however, modern instruments used in LCMS share high mass resolving power. The mass resolving power is the ability of the mass spectrometer to separate ions with closem/zand evaluated using mass accuracy. Mass accuracy is measured in parts per million by calculating the ratio of the m/z measurement error to the real m/z. Three types of mass analysers are widely used for LCMS: time of flight (ToF), quadrupoles, and ion traps. ToF analysers create an electric field to accelerate the ions and measure the time ions take to reach the detector. Quadrupole analysers use oscillating electrical fields and a changing potential allowing only ions in a particular range ofm/zto reach the detector at a given time scanning a wide mass range in a short period. Several types of ion traps exist; three-dimensional quadrupole ion traps, linear quadrupole ion traps and Orbitraps are examples.
1.3. LCMS Metabolomics 19 of at least two rounds of mass spectrometry separated by fragmentation. Fragmentation data can inform on the structure of the molecule analysed and is, therefore, a valuable resource in metabolomics to help with the identification of metabolites. Two types of fragmentation can be performed, fragmentation in time and fragmentation in space. Fragmentation in space can be done by using three quadrupoles (Triple Quadrupole) as seen in Figure 1.2; the first mass analyser isolates an ion, the second analyser acts as a collision cell to fragment the ion, the third analyser isolates a fragment ion. This means a signal will only occur if a characteristic molecular mass is detected, followed by a diagnostic fragment ion [32]. Fragmentation in time is done using one ion trap mass analyser over time such as quadrupole ion trap, and typically involves trapping the ions, selecting an ion of interest by manipulating the electrostatic field in the trap, then collisionally dissociating the analytes using a neutral gas.
Figure 1.2: Representation of a triple quadrupole performing fragmentation in space. The precursor ion is isolated by the first quadrupole, then fragmented in a collision cell, and the fragments are separated by the third mass analyser. Simpler mass spectrometer only have one mass analyser.
Liquid chromatography adds another dimension to the compound separation (Figure 1.3). In LCMS, this separation is made using High-Performance Liquid Chromatography (HPLC). The sample to be analysed is injected into the stream of mobile phase and passes through the stationary phase, part of the chromatographic column. Analytes are infused into the mass spectrometer for mass separation as they elute from the column. Diverse columns with differ-ent stationary phase properties are used. Hydrophilic interaction liquid chromatography [33] (HILIC) columns are used in LCMS metabolomics and separate compounds by increasing polarity. Alternatively, Reversed-phase chromatography methods, which uses a hydrophobic stationary phase is also often used to separate non-polar compounds [34].
1.3.2 Data format
The data produced by mass spectrometers during an LCMS experiment can be very large. The different mass spectrometer manufacturers have developed their own proprietary data format to store and process the data. However, these data formats are not adequate for an
1.3. LCMS Metabolomics 20
Figure 1.3: Liquid Chromatography - Mass Spectrometry system
academic research environment as they are binary, which make them difficult to read with-out dedicated software provided by their respective manufacturers. However, several open source data formats have been created over the years in an attempt to provide a unified stan-dard format for MS. Over the past 15 years, two open formats were concurrently developed by the Proteomics Standard Initiative and Seattle Proteome Center, respectively called mz-Data and mzXML [35, 36]. A joint effort has however emerged since to create a unified open format, mzML [37], which integrates and extend mzData and mzXML data formats. Instrument manufacturers now all provide software libraries to access the data within the binary files and convert it to an open format. This task can be handled by the tool MSCon-vert [38, 39], part of ProteoWizard Software.
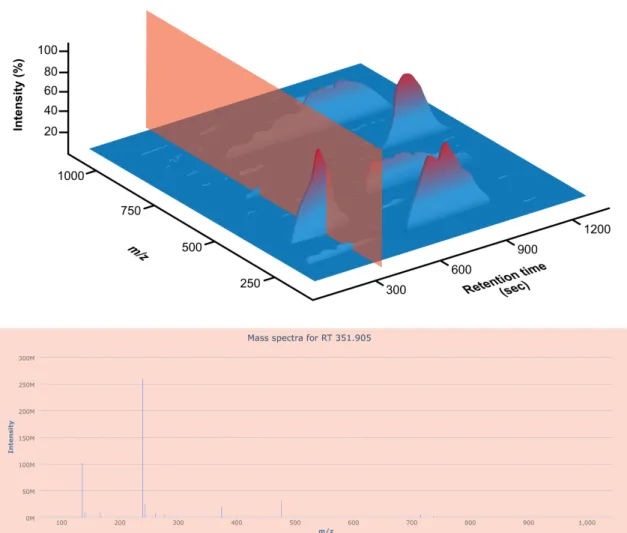
While some specifications such as metadata information change between the different open formats, the LCMS data itself is stored in a similar manner and can be described as a 3-dimensional chromatogram. Figure 1.4 illustrates this data by plotting m/z versus the re-tention time in y and x-axes respectively. The z-axis represents the intensity of the signal corresponding to ion counts, the highest signal being set at 100%. This data represents one polarity only. Two of these data structures are, therefore, present if the instrument is operated in polarity switching mode. Alternatively, positive and negative polarity data can be stored in two separate files.
This complex data structure allows to approaching the data in two different manners. Fig-ure 1.5 illustrates a mass spectrum and the information it contains in the context of LCMS data structure. For each of the time points there is a corresponding mass spectrum contain-ing MS peaks. Those peaks in a mass spectrum represent the molecules that eluted from the column at a specific retention time. Mass spectra become more complex as the number of compounds eluting from the column at the same retention time.
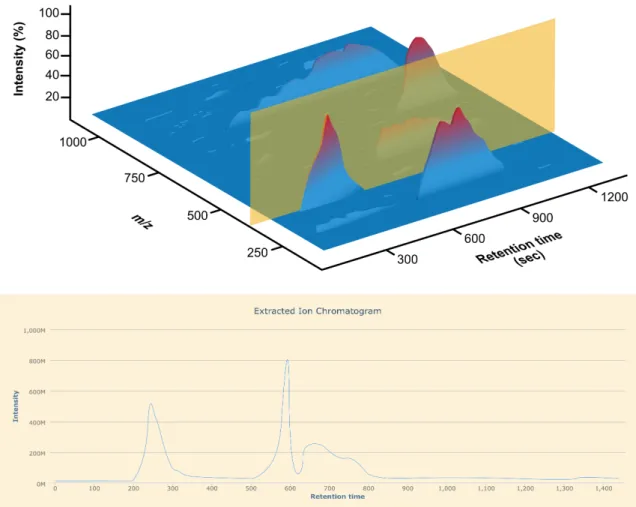
The data can also be approached in a transversal manner from mass spectra in order to look at a single ion (m/z) over time. Chromatographic peaks observed in extracted ion chro-matograms as shown in Figure 1.6 show the elution of a single ion through the
chromato-1.3. LCMS Metabolomics 21
Figure 1.4: Representation of a 3-dimensional chromatogram produced by LCMS data ac-quisition. The x axis represent the elution time in the chromatographic column (retention time), the y axis represent them/zmeasured by the mass spectrometer, and the z axis repre-sent the intensity of the detected ions.
graphic column. It can, therefore, show the separation of two species of the same mass but different affinity with the column.
1.3.3 Data processing
Many tools have been developed to support LCMS data processing, while they do not always provide the same features, a common data processing pipeline is conserved across those different tools. The user interface can, however, vary from command lines to a dedicated graphical user interface for stand-alone tools. In the recent years, web-based data processing pipelines have also emerged, providing a graphical user interface through web browsers such as Galaxy based pipelines [40] and overcoming any installation requirements. This section below describes the different steps of LCMS data processing although some tools can provide some variations of this general pipeline.
Peak detection
The peak detection is applied to LCMS data as it reduces considerably the size of the data to handle. During this step, the data structure previously presented is converted to a list of peaks, each entry being characterised by its m/z, retention time and intensity. Peak de-tection is complex, and many tools tend to use the same algorithm to perform this task. CentWave [41], the most widely used peak detection algorithm is implemented as part of XCMS [42] and is based on centroid mode spectra. Other peak detection algorithms are
1.3. LCMS Metabolomics 22
Figure 1.5: Single mass spectrum selected from an LCMS data file. This figure plots the intensity of ions against them/z
available such as MetAlign [43] or CentroidPicker in MZmine [44], but cannot be used by third party tools as they are part of stand-alone software. These algorithms treat each sam-ple spectrum independently and rely on manually defined parameters that have a significant impact on the quality of the peak detection. Some of these parameters are in direct relation to specifications of the instrument used for the data acquisition such as the mass deviation parameter in CentWave which requires knowing the mass accuracy of the instrument. These algorithms are therefore aimed to be used by experienced users for optimal results.
Peak alignment
The vast majority of metabolomics experiments are based on the assumption that differences will be observed between two different experimental group of samples, defined by either bio-logical or technical replicates. This assumption implies that metabolite levels are comparable within and across experimental groups. As the peak detection is performed independently for each replicate sample (LCMS run), matching peaks across LCMS runs corresponding to
1.3. LCMS Metabolomics 23
Figure 1.6: Extracted ion chromatogram of a LCMS file. This figure plots the intensity of one ion against the retention time.
the same molecular ion is essential for the downstream analysis. However, analytical plat-forms used in LCMS can produce data with large, non-linear retention time drift between LCMS runs. The peak alignment step addresses this issue and has been implemented using different methods. It produces as an output a list of peaksetscontaining the aligned peaks from each LCMS run.
Different warping-based alignment methods are widely used for LCMS data processing. These methods attempt to model the retention time drift between runs to correct it. Two main types of warping based alignment have been implemented and are based either on the total ion current (TIC) or the extracted peaks themselves. TIC-based algorithms such as Dynamic Time Warping (DTW) [45], Parametric Time Warping (PTW) [46, 47], Correlation Optimal Warping (COW) [48] and Continuous Profile Mode (CPM) [49] are not used by modern software as they take a reductive approach by using TICs only and ignoring the complex information of LCMS data. These methods were found to be inadequate for LCMS data as they often fail to align overlapping peaks (co-eluting compounds). An improvement of the
1.3. LCMS Metabolomics 24 COW methods which combine it to a component detection algorithm (CODA) was however developed and showed a higher alignment quality [50]. The same type of approach was taken to improve PTW and DTW algorithms for LCMS data by combining it with CODA [51]. An extension of DTW termed Ordered Bijective Interpolated Warping (OBI-Warp) [52], available in XCMS, shows improved alignment results and is now commonly used.
Alternative alignment methods can also be used such as Direct Matching which compares peaks across LCMS runs based on similarities without warping. Many implementations of this method have been proposed using different similarities measures [53, 54, 55] and are available in various LCMS data analysis tools such as Join Aligner in MZmine [44].
Finally, a simpler labelled LCMS data alignment can also be used; it, however, requires the injection of internal standards in the experimental samples, which increases the complexity of sample preparation.
While several algorithms can suit the task of LCMS peak alignment, it is hard to assess what algorithm provides the best solution. This is in great part due to the lack of comparative evaluation at the time of publication as outlined by R. Smith, et al. [56]. The choice of an alignment algorithm can, however, be made by using recent comparative reviews [57, 58].
Data filtering
Many data filters can be used to remove undesired signal [59]. For example, Reproducibility Standard Deviation filter [60] available in mzMatch [61] helps to eliminate signal that is too variable between replicates. More common filters are available in the different data process-ing tools such as blank filter, noise filter or a minimum number of detection. The blank filter discards any peak that is higher in the blank samples (generally extraction solvent) than the experimental samples as they can be considered as contaminants. The minimum detection number allow discarding peaks that are present in a limited number of samples, which often correspond to noise signals.
Gap filling
In some cases, peaks can be missing from a peakset due to a misalignment or rejection during peak detection because of a poor shape or high background signal. The gap filling step aims to recover this missing signal directly from the raw files. This step gives better insurance on the true absence of a peak.
1.3. LCMS Metabolomics 25
Peak grouping
Undesired in-source fragmentation often happens during the ionisation process which results in the production of multiple peaks per metabolite. Similarly, the sample preparation can cause the formation of adducts formed by the adduction of an ionic species such as different salts to a molecule. Beyond the ion suppression resulting from these formations [62], it also results on the production of multiple peaks for a single molecule. Finally, naturally occurring isotopes such as13C can produce several peaks that follow the isotopic distribution
of the element. The signal generated by these products of the precursor ion caused by those different mechanisms are commonly called related peaks.
The peak grouping step attempts to identify these related peaks and group them together with the precursor ion. Different methods often based on known chemical relationships can be used to create these peak groups. For example, mzMatch uses a clustering method based on intensity and peak shapes while CAMERA [63] groups related peaks using multiple integrated methods reconstructing a similarity graph.
This grouping step can be applied to the data at different stages of the pipeline but results in a consistent reduction in the number of relevant peaks which facilitate the peak identification stage.
Peak identification
Peak identification is crucial in order give a biological meaning the data generated. This process attempts to match peaks from a given LC-MC dataset to molecular formulas and compound identities. It is however not a trivial task due to a high number of possible as-sociations between a peak and metabolites. The Chemical Analysis Working Group as part of the Metabolomics Standard Initiative (MSI) created a 4 level scheme to help to report metabolite identification and annotation in a uniformed manner between studies [64]. The first level, considered as highest ranked identification, necessitate a match of a minimum of two independent and orthogonal data relative to an authentic compound analysed under iden-tical experimental conditions such retention time and accurate mass. Authentic compounds data is acquired by running authentic standards mix on the instrument. The second level of identification is based upon spectral similarity with a public spectral library. The level 3 cor-responds to putatively characterised compound classes, and the level 4 designate unknown compounds.
In standard untargeted approaches, a finite set of authentic standard compounds is run, which limits the number of peaks that can be annotated as level 1 identification. The majority of the other peaks are identified using accurate mass from public databases, KEGG [65], Pub-Chem [66], HMDB [67] and LIPID MAPS [68] are some examples amongst many available.
1.3. LCMS Metabolomics 26 However, mass accuracy is often not enough for unambiguous identification [69].
While in silico retention time prediction can help with the identification process [70], the most promising avenue for addressing this issue is the use of fragmentation data acquired by tandem MS (MS/MS). Fragmentation data can indeed offer structural information about compounds and therefore provide better support for peak identification. The same approach can be used for the identification process, matching fragmentation spectra against publicly available libraries. Many libraries are available with different degree of curation, matching options, and a varying number of spectra. MassBank [71] and ChemSpider [72] figure among the most widely used spectral databases.
Peak identification process is improving every day as spectral libraries cover an increasing number of compounds, it remains, however, one of the biggest challenges the metabolomics community has to overcome to lead to a better data interpretation in biological context.
Statistical analysis
A normalisation step is often required proceeding to the differential analysis of the dataset. The complexity of this task is highly dependent upon the size and the property of the dataset. Over a certain number of samples analysed, the data collection needs to be performed in separate batches before being merged into one large dataset. This procedure results in biased dataset values due to the variation of LCMS platforms over time. Solutions proposed are still in their infancy although the problem has been addressed many times over the past few years [73, 74]. Several methods for single batch data normalisation use different approaches that can be divided into two main approaches [75]. Methods-driven approaches use internal standard material references to base the normalisation upon. The standard used as reference rarely cover all metabolite classes present in the samples which limit the normalisation effi-ciency. This method is also not cost effective as the stable isotopes used as internal standards are expensive. Data-driven approaches are the most widely used normalisation methods and are based on the assumption that most metabolites produce a constant signal across samples, these methods have the benefit not to require to know the identity of the metabolites.
Once normalised, statistical analysis such as ANOVA, t-test, false discovery rate [76] and principal component analysis can be performed.
1.3.4 Data analysis platforms
Data generated by LCMS experiments is very complex, and its visualisation is essential at many steps of the analysis pipeline. Visualisation of the overall signal or raw files produced by the instruments is well supported by proprietary software provided by manufacturers.
1.3. LCMS Metabolomics 27 This software also provides search and curation tools to explore the data and revealed to be technical. They are therefore aimed at trained users which are expert in the field. Similarly, some software also offers visualisation tools for open source raw data formats [77, 44]. Most software, however, provides visualisation tools corresponding to the specific analysis tasks they support. For instance, mzMatch supports the visualisation of extracted peaks with PeakML Viewer, and XCMS allow the visualisation of peaks before and after alignment. There is, however, no standard when it comes to visualisation of data analysis results of metabolomics experiments. The typical representation of the data being a matrix where each row corresponds to a metabolite or an unannotated peak and each column a biological sample, and each matrix entry the intensity value of a metabolite in a sample. This very crude data representation is very limiting for the interpretation and omits major biological and statistical related information. Many attempts have been made to organise the results in a coherent manner to highlight the different type of information connected to the metabolites. These efforts are specifically made in end-to-end data analysis software which integrates all processing steps. IDEOM [78] proposes an organisation into tabs in an excel spreadsheet (Figure 1.7), with one of them summarising the metabolites found in the dataset along with t-test p-values and biological pathway information.
Figure 1.7: Comparison tab showing the results of LCMS data analysis in IDEOM. The columns A and B display the Mass and retention time of the peaks. Columns C to I show information about the identity of the compound corresponding to the peak such as the for-mula, the metabolite name or its pathway. Columns J to O show the fold changes between the different experimental conditions. The other columns give statistical information. Other standalone applications propose similar approaches such as MAVEN [79] which give information about the biological compound under investigation in its pathway view.
1.3. LCMS Metabolomics 28 installation requirements for the user. This very accessible software has attracted consider-able interest from the biological research community and helps disseminate and systematise the use of metabolomics in biological science. Some of these programs support the entire data analysis such as XCMS Online [80] or Workflow4Metabolomics [81], others tend to focus particularly on a particular task. MetaboAnalyst [82] for example, offer extensive statistical tools for metabolomics data. XCMS Online is the first end-to-end data analysis software which attempts to allow non-experts to perform their own data analysis [83]. It was in part achieved by introducing simplified parametrisation and interactive visualisation (Figure 1.8). Other software such as OpenMS [84] which was first developed for proteomics provides now support for metabolomics data analysis.
Figure 1.8: Innovative interactive visualisation tool available in XCMS Online. In this figure,m/zis plotted against retention time. Each bubble correspond to a feature, the colour is indicative of the directionality of the fold change between two experimental conditions, and the size is indicative to the extent of the fold change. The intensity of the color correspond to the statistical significance.
Shortcoming of current data analysis platforms
This section presents the shortcoming of the current software attempting to support end-to-end LCMS metabolomics data analysis, from raw data to biological interpretation.
The first common limitation of the tools presented in the previous section is the level of understanding required for the user to perform an analysis. Indeed, many settings needing an in-depth knowledge of LCMS technology has to be manually entered by the user. Mass and retention time window for feature detection, alignment parameters, are some of many
1.3. LCMS Metabolomics 29 examples. This requirement currently limits the usage of these tools to mature audience forcing inexperienced users such as biologists or clinicians to outsource their metabolomics analyses to bioinformaticians.
The second limitation shared by most tools is the static and fragmented structure of the applications. While modular designs can be useful to expand the feature set that software has to offer responsively and can provide the user with many analysis options, the lack of connectivity between these modules results in a fragmented overall architecture. Two ma-jor problems arise from this approach. First, tools such as MetaboAnalyst present the data analysis pipeline in the form of functional modules that the user has to choose from, which implies some level of understanding from the user in order to run modules in a coherent, se-quential manner. Other tools such as IDEOM present the workflow as an integrated pipeline. However, user intervention is still required at each step of the pipeline which limits the turn-around time for a complete analysis of the data considerably. Finally, Galaxy based software also necessitates basic understanding on how to organise a data analysis pipeline.
The same static approach is often taken with regards to data visualisation. While most soft-ware provide features to generate figures such as Principal component analysis (PCA) or volcano plots which can be interpreted on their own without surrounding information, the same method is often taken to present extracted-ion chromatograms (EICs) or mass spectra. This approach of generating static pictures to display specific information isolates the data from the general context of the analysis which makes it harder to interpret. XCMS Online started addressing these issues by organising the analysis pipelines into jobs and creating dy-namic and interactive visualisation tools which can help users in better understanding their data.
Currently, available tools can be divided into two main groups, stand-alone software and web-based applications. Stand-alone applications necessitate the local installation of the software and its library dependencies on personal computers. This task is often difficult for users with no fundamental skills in computer science. Collaborative work within such environments can also become a challenge as it requires every party involved to have access to the same version of the same tool. Moreover, sharing large metabolomics datasets is not a trivial task due to the size of the raw and processed data. Web-based applications do not suffer from these limitations as they usually offer sharing features and direct access to the data through a web browser.
One of the key components to enable users to extract meaningful biological insight from metabolomics datasets is the biological context under which the results are investigated. While the fragmented structure previously discussed substantially limits this interpretation process, some tools are beginning to integrate pathway enrichment and analysis tools. How-ever, many still require the use of third-party software to replace metabolomics data into
1.4. Programming languages, libraries and frameworks 30 a larger biological context. Manual export, formatting, and import of the data is required whether these applications are web-based [85, 86, 87, 88], stand-alone [89] or Cytoscape plugins [90, 91], which creates yet another barrier for inexperienced users to interpret their data entirely.
1.4 Programming languages, libraries and frameworks
Many programming languages are available for developing bioinformatics tools. The choice of a programming language can depend on many parameters such as the performance re-quired (i.e. computation time, hardware requirement), the development time and the aim of the tool developed. However, Perl and Python have been the two languages of choice for bioinformaticians as they need fewer lines of code than other languages such as C, C++ or Java. They, therefore, enable faster development. Those two languages benefit now from a wide range of biology-oriented libraries which provide many commonly used algorithms in the field. Python presents, however, advantages over Perl due to a syntax more straightfor-ward and less permissive, which facilitate the development of reusable scripts and collabo-rative work. All languages are, however, used in bioinformatics, and the choice depends on the aims and requirements of the tool or script being developed [92].Statistical languages are also commonly used in bioinformatics, MATLAB (matrix labora-tory) [93] and R [94] are the two most popular languages. MATLAB presents the disadvan-tage of being a proprietary language which makes it expensive. For this reason, R, which is open source, can reach a wider audience than Matlab and is often preferred by bioinformati-cians.
Nowadays, web technologies are also commonly in bioinformatics as they enable the straight-forward development of user interface available through web browsers. Frameworks have been developed over the past decades to standardise and ease the development of web appli-cations. Like the programming languages, the choice of a web framework is made according to the project, its aim and its target audience. For example, Shiny [95], an R web framework, allow the rapid development of a web interface around an R script. However, larger appli-cations tend to use frameworks such as Ruby on Rails [96] or Django [97] which provide a more structured environment and enable scalability.
The choice of languages is always closely related to the objective of the tool being developed and the available libraries and frameworks. In-house scripts aimed to be used by a bioinfor-matics laboratory will not necessarily need a user interface; applications with an audience of biologists, however, require streamlining and interfacing to facilitate their use.
1.5. Biological networks 31
1.5 Biological networks
High throughput omics technologies allow the large-scale study of the systems organisation of organisms. Each omics technology attempts to describe the state of a particular layer of a system and the interaction between their constitutive components. Representing these interactions using networks helps to understand the different relationships between omics components. Thus, biological networks are often used to understand the process occurring in a system. Each omics layer can be represented by a different network to inform on var-ious interactions. Gene-gene interaction networks, for example, are often used to attempt to understand the different relationship between genes [98]. In transcriptomics, gene co-expression networks are widely used to understand the processes regulating the co-expression of genes [99]. Other types of networks are commonly used to explore genomics and tran-scriptomics data such as co-localization or gene regulatory networks [100].
While these networks offer comprehensive support to study the interactions occurring in a biological system, they need to be processed to extract meaningful biological information. For example, as illustrated in Figure 1.9 a protein-protein interaction network can be formed of thousands of nodes highly connected with one another, which limits the amount of in-formation that can be extracted from it. Reducing the size of the network can, for instance, be done by a semantic enrichment using Gene Ontology annotations [101]. The resulting network would highlight proteins sharing particular biological processes, molecular func-tions or found in the same cellular component; and interacting with one another, conveying a greater biological meaning than the initial network.
At the metabolome level, genome-scale reconstructions of metabolic networks [102, 103] can be used for studying the flux of metabolites within a system using flux balance analysis [104]. This type of network is also used to make different predictions on biological systems using
in silicoconstraints-based approaches [105]. Figure 1.10 illustrates the genome-scale recon-struction of the human metabolic network [106].
1.5. Biological networks 32
Figure 1.9: Example of a Gene Ontology semantic enrichment of protein-protein interac-tion network. On the left, a three degrees separainterac-tion protein-protein interacinterac-tion network was reconstructed from one seed protein (in red, in yellow are proteins with one degree sepa-ration, in blue two degrees, in green three degrees). On the right, the same network was reconstructed using a Gene ontology semantic enrichment to keep only proteins involved in the same molecular processes. The network was reconstructed for illustration purposes, the seed protein and ontologies were selected randomly. The network was reconstructed using a python script developed by the author and visualised using Cytoscape.
Figure 1.10: Genome-scale reconstruction of the human metabolic network using MetEx-plore. The network as such is not informative but can serve as a support to study flux data
1.6. Related work 33
1.6 Related work
The work presented in the following chapters aims to better support researchers in their LCMS metabolomics experiments. From data capture to result interpretation, the tools im-plemented and presented here provide platforms using state-of-the-art technology to facili-tate the LCMS data capture, data analysis and interpretation. Every result chapter focuses on a different stage of the LCMS metabolomics workflow, the specific aims and objectives are defined in the related work section of each chapters.
34
Chapter 2
Materials and methods
The research discussed in this document mainly involve the development of new approaches to analyse, visualise and interpret metabolomics and to some extent omics data. These ap-proaches are based on the development of new tools to support the different operations to perform on the data. The section below, therefore, outlines the programming languages, the programming libraries, the existing tools that were used for the development of the different part of the software and the data analysis presented in Chapter 3, Chapter 4 and Chapter 5.
2.1 Software engineering
The software presented in this document was developed following the agile software devel-opment method. Requirements were initially captured through extensive interaction with collaborators of Glasgow Polyomics (GP) metabolomics facility, and gathering feedback from Glasgow Polyomics data analysts. Agile development method was put in place once the first working prototype was developed. A pool of 10 test users with different background were given an early access to the tool to analyse their own LCMS data and to provide feed-back on the features and report issues encountered.
Acceptance testing was performed in the form of a one day workshop, gathering test users as well as new users. Two acceptance tests were organised during the development of the software presented in this document, they allowed to refine different part of the project from the data structure to the user interface.
All software developed as part of this work were put under version control using Git and a private GitLab repository hosted on GP servers. A production environment and several development environments were created for each tools, every features newly developed was tested before being deployed on the publicly available production server.
2.2. Data format 35 Besides being under version control, the tools were encapsulated into docker containers to facilitate their deployment. This encapsulation was not carried out by the author and will, therefore, not be discussed in this document.
Unless specified in the text, the work presented below has been carried out by the author.
2.2 Data format
Several data formats were used for different purposes. The metabolomics data file format that the developed software uses is “mzXML” format. All instruments used for Liquid-Chromatography Mass-Spectrometry data acquisition produce result files in a different type of proprietary format. This files can be converted to the “mzXML” open file format by using the freely available tool ProteoWizard [38]. mzML format [99] was used for fragmentation data.
Web transactions involving data transfer use Javascript Object Notation [100] (JSON) which is a data-interchange format commonly used for web data exchange as it is language inde-pendent. This format is used for client-server asynchronous communication.
The data analysis pipeline used in Chapter 3 creates intermediary “PeakML” [61] files that contain pre-processed data of “mzXML” or “mzML” files.
One XML [107] based exchange format was also created as an intermediary data format between the software developed and the data analysis pipeline, and explained in Chapter 3. The exact purpose of the file format (pimpxml) is detailed in section 3.4.5.
2.3 Data analysis pipeline
The data analysis pipeline of the software described in chapter 3 is implemented in R [108, 94] and based around XCMS [42] for feature detection and mzMatch.R [61] for metabolomics data pre-processing tasks. mzMatch.R uses backend functions implemented in Java through the rJava library. The analysis pipeline also uses a collection of other R libraries; the full list is available in Appendix A.1. Extra pipeline functions are implemented in R.
The data analysis pipeline is run asynchronously by the implemented software using Cel-ery [109]. CelCel-ery is an asynchronous task queue allowing both scheduling and concurrent tasks to run on several worker nodes. RabbitMQ [110] is used as the message broker for Cel-ery. Reversed communication from the pipeline to the program is done through a dedicated “XML” format.
2.4. Web framework 36
2.4 Web framework
The software and tools presented in Chapter 3 and 4 are developed in Python 2.7 [111] using Django (version 1.7) [97] web framework. Django is an open source web framework written in Python, which follows the Model View Template (MVT) architectural pattern. It is developed and maintained by the independent Django Project Foundation as a 501(c)(3) non-profit. Django consists of an object-relational mapper that mediates between data models and a relational database, a web templating system with a HTTP requests processor, and a regular-expression-based URL dispatcher. A MySQL [112] relational database is used to store data in production environments and SQLite on development environments. Nginx web server [113] is used in conjunction with Django in production environments, interfaced by Gunicorn [114], a Python Web Server Gateway Interface HTTP server written in Python. As mentioned in the previous section, long running asynchronous tasks and queueing systems are handled by Celery.
Mathematical operations are performed on the server side (in Django) using NumPy [115], SciPy [116] and Scikit-learn [117] Python libraries. NumPy extends Python support to large multidimensional arrays and matrices, and high-level mathematical functions. SciPy is built on NumPy array objects and expand the mathematical and scientific functions. Scikit-learn implements visualisation, preprocessing, cross-validation and machine learning algorithms. Communication between Python and R is performed using rpy2 [118] to enable the use of XCMS functions in Python. Rpy2 is a python library interfacing Python with R using NumPy array objects.
The full list of Python libraries and Django plugins used for the implementation of the pro-gram and tools presented in Chapter 3 and 4 are available in Appendix A.2.
2.5 Data visualisation
The user interface of the tools presented in the different Chapter 3 and 4 are developed using common web standards such as HTML and CSS. The user interface represents the template layer of Django web framework. An extra layer developed using JavaScript programming language to create an interactive user interface. This layer is based on the jQuery JavaScript library and uses AJAX (Asynchronous JavaScript and XML) web development techniques to improve perceived response time and create a dynamic user interface. Charts and plots are designed using Highcharts and D3.js libraries to allow interactions such as zooming and download features. The tables are based on DataTables library for interaction purposes. The full list of JavaScript used is available in appendix A.3
37
Chapter 3
A semi-automated pipeline for
untargeted metabolomics
3.1 Introduction
Metabolomics is a relatively new field which requires the combination of different scientific disciplines. From analytical chemistry to systems biology, metabolomics combines complex analytical applications to advanced bioinformatics and biochemistry expertise. This interdis-ciplinary breadth of metabolomics creates tremendous challenges in making it approachable to the scientific community as very few people are experts in all of those fields. Performing adequate and well-designed experiments to obtain good quality data that can be taken for-ward for analysis and interpretation becomes, therefore, an obstacle for non-experts. Indeed, the high complexity of Liquid Chromatography Mass Spectrometry data compared to other ’omics’ data necessitates expert knowledge in the field to plan an experiment to be able to process the data post acquisition. This concept of post-acquisition data analysis to reduce noise or filter unprocessed raw data is also poorly understood by biologists who need to be guided through the design of their experiment as well as through the different data analysis steps. The biggest challenge, however, lies in the data analysis and interpretation of the re-sults [119, 120]. Indeed, due to data complexity and currently available tools, the analysis of metabolomics data is usually performed by expert bioinformaticians or data analysts with a strong knowledge of the data structure, format and analysis process as well as advanced computer skills. These challenges can, however, be addressed by creating a tool to accom-pany and guide biologists from designing their experiments to interpreting their data. In order to overcome these issues, the tool needs to streamline the data analysis process into a semi automated tool reducing the necessary user interventions; presenting a simple ’step by step’ pipeline to allow users them to proceed to their own analysis, but also assist them in the data interpretation. The second point can be achieved using data visualisation techniques to
3.2. Related work 38 provide the user with contextual information and create a self-learning environment.
Metabolomics is a rapidly evolving field, analytical tools and algorithm need therefore to adapt to meet new requirements continuously. This is usually achieved in two different manners, existing algorithms and tools can be modified to meet the new requirements and provide an alternative data analysis, or for entirely new approaches, new modules need to be created and incorporated into an existing pipeline. For this to happen, however, the tool needs to be developed in a structured and highly scalable manner. This can be achieved by creating modular software in which the modification of one module would not affect the rest of the software; such orthogonal design would allow an easy addition or removal of modules from the pipeline to adapt to new requirements in a responsive way.
3.2 Related work
At the commencement of this project several metabolomics data analysis pipelines necessi-tating different levels of understanding of the metabolomics and bioinformatics fields were available. XCMS [42] introduced in 2006 as an R package allows the analysis of untar-geted metabolomics. While the tool provides all features necessary for full data processing from peak detection to statistical analysis, it requires prior knowledge in programming and is therefore limited to the use of bioinformaticians. mzMatch [61], a Java and R library pro-vide a collection of small tools that enrich the features available in XCMS. The tool propro-vides filters in order to improve data processing such as Relative Standard Deviation filter during peak grouping. mzMatch also provides a peak annotation tool which allows basic biological interpretation of the dataset. IDEOM [78] was the first tool introducing more extended bio-logical interpretation feature. IDEOM is a wrapper around XCMS and mzMatch presented in the form of an Excel spreadsheet. A collection of macros allows data processing from peak detection to biological interpretation through calls to XCMS, mzMatch and indepen-dent algorithms. IDEOM displays the results of the data processing as tables within Excel; it provides pathway information and export functionalities to analyse the results further using external software. MZmine [44], an alternative to XCMS was first released in 2006 as a stand alone application for Mass Spectrometry data analysis. MZmine is written in Java and pre-sented to the user in a dedicated user interface; it allows users to analyse MS data from peak detection to statistical analysis without the requirements of prior knowledge in programming once installed. Results can be exported for further analysis such as data interpretation using external tools.
The first and shared limitation of these tools is the installation requirement. The instal-lation process of these tools requires advanced knowledge in informatics systems and can present significant challenges to biologist without skills in computer science. MZmine and
3.2. Related work 39 IDEOM give the advantage of providing a dedicated user interface to interact with the soft-ware once installed. However, analysing LCMS data using these programs still requires extensive knowledge of the underlying data to process it from end to end. All the tools also require user interventions at each and every step of the data processing to progress in the analysis pipeline; this limits the time efficiency of the analysis considerably. Other limi-tations related to stand-alone software such as specific hardware requirements for running intensive processing task also arise from these types of tools. Another major limitation for biologists to use the presented software is the basic capabilities they offer for assisting the user in their data interpretation and providing biological context. This critical step of trans-forming LCMS data into valuable biological insight currently necessitate third party software and the intervention of biochemistry experts to provide the biological context in which the data should be interpreted. Finally, as metabolomics data is extremely complex, the size of raw data files and analysis results present a barrier to collaborative projects. Although tools exist to transfer big data files, collaborating on a metabolomics data analysis project requires every party involved to have the same software installed on their personal computers to make collaborative approaches to metabolomics studies possible.
The work presented in this chapter will, therefore, try to answer these research questions:
• Can bioinformatics tools support non-expert users in the analysis and interpretation of
metabolomics datasets?
• Can software solutions be scalable enough to support the rapid expansion of the
metab-olomics field and its ever growing requirements?
• Can software solutions overcome issues related to big data and enable world-wide collaboration in the field of metabolomics?
Five main project aims have been drawn to attempt answering these questions: 1. Support end users in their metabolomics data capture and analysis.
Objective 1: Develop an installation free tool with user friendly UI to allow re-searchers with no computing skills to set up their own metabolomics data analysis. 2. Streamline the data analysis pipeline to limit or eliminate the need for user interaction
after initial data capture.
Objective 2: Create a wrapper and data exchange format to enable the encapsulation of data analysis pipeline within the developed tool.
3. Develop a modular tool to allow responsive feature integration.
Objective 3: Decouple the various part of the tool using object oriented and model-view-controller design pattern to enable module integration.