The Equity Risk Premium
Niki Saabye, Market OperationsINTRODUCTION AND SUMMARY
The topic of this article is the equity risk premium, defined as the higher expected yield on stocks in relation to the risk-free yield. The risk pre-mium is key to the proportion of savings individual investors can be ex-pected to place in stocks. The challenge presented by the equity risk premium is that it is not a value which can be directly observed in the market, and must therefore be estimated. This can be done in several ways, and consequently the current level of the risk premium is subject to much dispute.
The methods used to estimate the risk premium can be divided into three categories: 1) historic, retrospective, 2) theoretical, forward-looking and 3) enquiry. Each has its advantages and drawbacks, but a common trait is that none of them can unequivocally determine the true value of the risk premium beyond any doubt.
Estimation of the historical risk premium is highly sensitive to the period selected, since the realised differences in yields fluctuate greatly from year to year. For the period 1970-2002, the historical risk premium on Danish stocks is estimated at approximately 5 per cent p.a.1
The historical risk premium on Danish stocks is generally below the level observed in the USA.
In theory the risk premium is influenced by a number of economic variables (e.g. economic growth, inflation, corporate profits and invest-ors' risk aversion), and changes in these variables can therefore affect the risk premium. The terrorist attacks on the USA on 11 September 2001 immediately drove down stock prices. One interpretation is that the expected risk premium was higher in the ensuing period as a result of increased risk aversion among investors.
This article is divided into two main sections: 1) a short discussion of the concept of risk premium from a theoretical viewpoint, and 2) a
sec-1
Danmarks Nationalbank has gained access to a database (Global Financial Data, Inc.), which inter alia
contains a historical total-yield index (i.e. an index including dividend payments, which gives a more true picture on estimating the risk premium than a price index alone) for the Danish stock market. This data is used to estimate the historical risk premium for Danish stocks.
tion illuminating the risk premium on Danish stocks in current and his-torical perspectives.
WHAT IS THE EQUITY RISK PREMIUM?
This section describes the concept of risk premium, the factors influen-cing it, and the degree to which the equity risk premium can be estimated/measured.
Definition of the equity risk premium
The risk premium is the higher yield in relation to the risk-free yield that an investor expects to achieve from an investment where the outcome is not known for certain. The risk premium is thus an expression of the cir-cumstance that high-risk investments are expected to yield higher re-turns than secure investments, since otherwise no investor would risk its capital. In other words the equity risk premium1
is – as the term indicates – payment for the risk related to an investment in stocks2
. This can be expressed as:
(1) E
[ ]
RP =E[
Ystocks]
−iwhere E[RP] is the expected equity risk premium (RP is the risk premium and E[] expresses an expectation). E[Ystocks] is the expected yield on stocks3
, and i is the risk-free interest. Since the yield on stocks is not known beforehand, the risk premium may be viewed as either a histor-ical (ex post) premium or a future (ex ante) premium. The above equa-tion expresses the investors' expected ex ante risk premium E[RP], and it is important to emphasise that it may well deviate from the subsequent realised RP. In other words, the risk premium estimated on the basis of historical observations is not necessarily in accordance with the expecta-tions which the investors held beforehand, or their expected future risk premium.
Which circumstances affect the risk premium?
As the expression indicates, the expected risk premium is affected by two circumstances: the expected yield on stocks, and the risk-free yield. If the risk-free yield is assumed to be constant and known, which is a
1
In the following "equity risk premium" and "risk premium" will be used as synonyms. 2
The yield on stocks fluctuates greatly and in some periods may be highly negative, e.g. in 2001 and 2002.
3
In this context "stocks" represents the entire market – i.e. Ystocks expresses the expected yield on a
portfolio consisting of all stocks in the market. In practice this is approximated using a representative stock index.
sufficient condition for being free of risk, only changes in the expected stock yields will affect the expected risk premium. Circumstances affect-ing the expected stock yields will thus also affect the expected risk pre-mium.
The expected yield on a stock in the near future can be expressed as:
(2) t t t 1 t t P ] E[div ) P ] (E[P E[Y] = + − +
where Pt is the price of the stock at time t, E[Pt+1] is the expected price of
the stock at time t+1, and E[divt] are the expected dividends payable in
the period from t to t+1. The expected yield1
thus comprises an expected capital gain (E[Pt+1] – Pt ), and the expected dividend payments, E[divt].
Assuming that the investor keeps the stock for ever, the yield will solely comprise the regular divided payments, since no capital gains will ever be realised. In theory the price of a stock will therefore be identical with the current value of the future dividends. Mathematically, this can be expressed as follows: (3)
(
)
∑ ∏ + = ∞ =1 = t tt1 t t 0 d 1 ] E[div Pwhere dt is the investors' required yield in the period t – i.e. the yield which investors require for holding a stock in the period t. The above model is known as the Discounted Dividend Model, DDM. DDM shows that the price of a stock depends on two circumstances: 1) expectations of future dividends and 2) investors' yield requirement.
Future dividends may be affected by a number of factors. For instance, changes in the company's future revenue will be reflected directly in the dividend payments if the company pays out a fixed percentage of its profit as dividend to shareholders. The company's revenue is affected by both macroeconomic factors (e.g. economic growth and the rate of in-flation) and company-specific factors (e.g. competition and manage-ment).
The size of the investors' yield requirement depends, inter alia, on al-ternative placement opportunities (government bonds, cash, real prop-erty, etc.), i.e. the other yield/risk combinations available. In addition, the yield requirement depends on the investors' degree of risk aversion.
1
In theory the expected yield will always be positive, since investors must as a starting point expect their risk to pay off, cf. the definition of risk premium. The yield comprises two elements: a capital gain and a dividend payment. Since the total yield is expected to be positive, a situation can be ima-gined where there is a capital loss, but this is more than offset by the dividend payment.
The higher the investor's risk aversion, the higher the required expected yield, i.e. dt is high and – all other things being equal – the investor will pay a lower price. Investors' risk aversion is not necessarily constant, but may be influenced by e.g. shocks in the economy. Investors' assets also affect their risk aversion. It is often assumed that fewer assets mean higher risk aversion and vice versa. Investors' risk aversion involves a considerable psychological aspect, so it is difficult to give a complete list of the factors governing it.
Finally, factors such as companies' life cycles and investors' investment horizon may influence the yield requirement.
To summarise the above, the risk premium is affected by the circum-stances determining the size of future dividends and investors' yield re-quirement1
.
The equity risk premium is a key factor in the financial markets since it has a vital impact on an investor's optimum portfolio choice. However, it is problematic that the risk premium is not a directly observable entity, and must be estimated.
How is the risk premium estimated?
Basically, there are three different approaches to estimating the risk premium: 1) the historical approach, 2) the forward-looking theoretical approach, and 3) the enquiry approach.
In the historical approach, the risk premium for a given period is cal-culated on the basis of historical yields on stocks and the risk-free yield. In practice the risk-free yield – like the equity risk premium – cannot be observed directly, so that an approximation is applied2
. The historically calculated risk premium is therefore identical to the aver-age additional yield on an investment in stocks over a selected period compared to the return on a given government bond3
. The yield on stocks is usually calculated on the basis of a broad stock index, e.g. S&P500 for the USA or the Copenhagen Stock Exchange's total index for Denmark.
The historical approach is widely used in spite of the problems related to the method. Firstly, the estimated risk premium is affected by the period selected. Secondly, the approximation for the risk-free yield is in actual fact not entirely risk-free (e.g. because investors cannot be sure that their current yields can be reinvested at the same rate of interest).
1
By entering the expression for the theoretical stock price (3) in the formula for the yield on a stock (2) and then entering this expression in the equation for the expected risk premium (1), it can be seen that the same variables determine the size of the future dividends and the investors' yield re-quirement, and the size of the risk premium.
2
In the financial literature the risk-free yield is often approximated using the interest rate (or the yield) on a 10-year government bond or a 3-month money-market interest rate.
3
Finally, there is a general problem in relation to the historical risk pre-mium, in that it does not necessarily give a good picture of the expected future scenario, unless history repeats itself.
The forward-looking theoretical approach is based on a given model, e.g. a variant of DDM, cf. the next section, where the risk premium is estimated on the basis of the current market prices and future expecta-tions. The advantage of this method over the historical approach is that it gives an estimate of the current expectation of the risk premium in the market. The drawback of the method is that it depends on the model applied, and thus on the underlying assumptions and prerequi-sites.
The enquiry approach consists of a panel of market participants – chosen at random or selectively – giving their view of the current risk premium, after which a consensus estimate is calculated. This method is highly subjective and is best used as a supplement to the other two methods. The enquiry approach will not be discussed further in this art-icle.
The risk premium can therefore be estimated in several ways, and con-sequently opinions differ greatly as to the size of the risk premium.
RISK PREMIUM AND THEORETICAL PRICE OF A STOCK
In the above section the general version of DDM was introduced. One problem in relation to this method is that all future dividends must be estimated in order to determine the stock price. The longer the time horizon, the greater the uncertainty as to the dividends payable. In con-nection with the estimation of the theoretical stock price the Gordon model1
is often applied. This is a simplified version of the general DDM. In the Gordon model it is assumed that dividend payments grow at a constant rate during each period and that investors' yield requirement is the same in each period. These simple assumptions make it possible to reduce the expression of the stock price to:
(4)
(
)
g d g 1 div P 0 0 − + ⋅ =where g is the constant growth rate for dividends, d is the investors' yield requirement in each period, and div0 is the dividend payable today (period 0). On the basis of equation (4) it is possible to illustrate how a shift in the risk premium affects stock prices. After a few changes, cf. Box 1, the result is equation (5).
1
(5)
(
)
g i E[RP] g 1 div P 0 0 − + + ⋅ =This version of the Gordon model shows a negative correlation between the size of the expected risk premium and the stock prices. An increase in the expected risk premium leads to a fall in the stock price, and vice versa if the risk premium decreases. The model may also be used to es-timate the expected risk premium on the basis of the stock price, the risk-free yield, the constant growth rate in dividends, and the dividend payment in the period 0, since the expression can be rewritten as:
(6) g i P g) (1 div E[RP] 0 0⋅ + + − =
The strength of the model is also its weakness since its very restrictive assumptions make the results sensitive to changes in these assump-tions. The next section considers how the results of estimation of the risk premium are affected when the assumptions are changed.
REWRITING THE GORDON MODEL Box 1
The expected yield on a stock investment E[Ystocks] must necessarily be equivalent to the
investors' yield requirement d, if there is to be a market for stock investments. If the expected stock yield is lower than the investors' yield requirement, investors will be unwilling to buy stocks. This will exert downward pressure on stock prices until the expected yield again matches the investors' yield requirement. Conversely, prices will be pushed upwards if the expected yield is higher than the investors' yield require-ments. The risk premium can be expressed as:
E[RP] = E[Ystocks] - i
If E[Ystocks] is replaced by d, the expression is as follows:
d = E[RP] + i
It can now be seen that the investors' yield requirement is equal to the expected risk premium plus the risk-free interest. If this is substituted into the Gordon model (4), the rewritten version appears:
(
)
g i E[RP] g 1 div P 0 0 − + + ⋅ =RISK PREMIUM IN A CURRENT AND A HISTORICAL PERSPECTIVE
This section outlines the development in the historical risk premium for Danish stocks against the background of historical stock yields for the period 1970-2002. These results are then compared with a number of other surveys. Finally, the effect on the risk premium of changes in in-vestors' risk aversion will be examined.
The risk premium on Danish stocks
The following calculations of the risk premium on Danish stocks are based on the historical approach, cf. above. The starting point is to cal-culate the annual yield on a broad-based stock index, less the risk-free yield. As stated above, the yield on a stock comprises a capital gain (or loss) and a dividend payment. So it is important that the stock index used to estimate the yields takes the dividend payments into account since the stock yields (and thereby also the historical risk premium) would otherwise be underestimated. In this article the annual stock yields are therefore calculated on the basis of a total-yield index which includes the annual dividend payments1.
In the calculations below fiscal and inflationary circumstances are disregarded, and the risk premium is therefore calculated on the basis of nominal pre-tax stock yields and bond interest.
Chart 1 illustrates the development in the accumulated yield on an in-vestment of kr. 100 at end-December 1969 for the MSCI total-yield index (incl. dividend payments) and the Copenhagen Stock Exchange total in-dex (excl. dividend payments)2
.
As Chart 1 shows, the accumulated yield is reduced significantly if divi-dend payments are excluded. Kr. 100 had thus grown to kr. 4,166 at end-December 2002 on the basis of the MSCI total-yield index, against kr. 1,345 on the basis of the CSE total index. This difference is attribut-able to the average dividend yield of 3.2 per cent per annum3
in the pe-riod under review.
The risk-free interest is approximated using the interest rate on a 10-year Danish government bond. The historical risk premium for Denmark in the year t is calculated as:
(7) RPt=Yt−it
1
Using the MSCI total-yield index for Denmark prepared by Morgan Stanley. 2
The two indexes are not fully comparable, since more stocks are included in the CSE total index than in the MSCI total-yield index.
3
In the period 1970-1982 the average dividend yield was 5.3 per cent per annum against 1.8 per cent per annum for the period 1983-2002.
where RPt is the historical risk premium in the year t, Yt is the yield on stocks in the year t, and it is the average interest rate on a 10-year Dan-ish government bond in the year t. Note that the historical risk premium may be negative since these are realised, not expected, yields.
Normally the historical risk premium is not considered for a single year alone, since the premiums fluctuates considerably from year to year. In-stead, the average risk premium for a given period is considered. Table 1 gives an overview of the average historical risk premium on Danish stocks and related standard deviations for selected periods.
The average historical risk premium for Denmark was 5.2 per cent per annum in the period 1970-2002, cf. Table 1. In other words, Danish stocks have given an average nominal annual additional yield before tax of 5.2 per cent compared to the interest rate on a 10-year Danish gov-DEVELOPMENT IN YIELDS INCLUDING AND EXCLUDING DIVIDEND
PAYMENTS Chart 1
Source: Global Financial Data Inc.
HISTORICAL RISK PREMIUM FOR DENMARK Table 1
Risk premium
Per cent per annum Average Standard deviation
1970-1982 ... 2.1 33.7 1983-2002 ... 7.2 34.4 1970-2002 ... 5.2 33.7
Note: The risk-free yield is approximated using the average interest rate on a 10-year Danish government bond. Source: Global Financial Data Inc. and own calculations.
10 100 1,000 10,000
CSE total index (excluding dividend payments) MSCI total-yield index (including dividend payments) 31 December 1969 = 100
Dec 69
ernment bond. The Table also shows that the risk premium has by no means been constant from year to year, since there is a considerable standard deviation from the average. The considerable fluctuation in the yield spreads realised in the individual years is illustrated clearly by Chart 2.
If the period reviewed is split into two subperiods, it is seen that the risk-premium values for the two periods differ greatly, cf. Table 1. This illustrates one of the weaknesses of the historical approach, i.e. that it does not necessarily give a good forecast of the future risk premium, even for longer periods of time. At the start of 1983 an investor could thus have expected an average annual risk premium of 2.1 per cent on the basis of the historical risk premium for the period 1970-82. For compari-son, the realised risk premium for the subsequent period, 1983-2002, was 7.2 per cent. In addition, the realised historical risk premium for a given period does not necessarily explain investors' actual expectations in the period in question.
In order to examine how the risk premium is affected by the choice of risk-free yield, in Table 2 the risk premium on Danish stocks is calculated using a 12-month interest rate for Danish kroner as a new approxima-tion1. The risk premium is now estimated at 7.6 per cent per annum, which is 0.4 percentage points higher than in the estimate in Table 1. 1
Data for 12-month euro-currency interest rates for Danish kroner are only available for the period 1982-2002.
ANNUAL REALISED RISK PREMIUMS ON DANISH STOCKS Chart 2
Source: Global Financial Data Inc. -60 -40 -20 0 20 40 60 80 100 120 1970 1975 1980 1985 1990 1995 2000 Average = 5.2 per cent
This – relatively small – difference is primarily attributable to the positive slope of the yield curve in the period reviewed (i.e. interest rates in-crease with maturity).
What do other surveys show?
This article's estimated historical risk premium for Denmark, viz. 5.2 per cent, does not deviate significantly from the results of other, similar sur-veys. Risager and Nielsen (2001) thus find that the historical risk pre-mium for Denmark in the period 1924-99 was 4.1 per cent1
, while Eng-sted and Tanggaard (1999) estimate the historical risk premium on Dan-ish stocks at 3.7 per cent for the period 1922-96.2
The Risager and Nielsen survey also confirms that the historical risk premium is greatly affected by the choice of period. They operate with two subperiods, 1924-82 and 1983-99. The risk premium is estimated at 2.1 per cent and 11.2 per cent, respectively, for the two periods. Once again, this fits in well with the estimates in this article3
.
The significant difference in the historical risk premiums for the two periods is especially due to the fact that the period 1983-99 was gener-ally characterised by an almost constantly increasing stock market4
and falling interest rates. The shift in economic policy, e.g. the introduction of the firm fixed-exchange-rate policy, liberalisation of the financial markets and changed taxation rules (introduction of the real-interest tax, which made stocks more attractive than bonds from a taxation point of view) all paved the way for higher stock prices. The opposite was the case in the 1970s when two oil crises, repeated devaluations and higher inflation led to sustained periods of increasing interest rates and declining stock prices.
1
Nielsen & Risager, 2001. Nielsen & Risager operate with a 1-year interest rate as the approximation for the risk-free yield. Their stock yield also includes dividend payments.
2
Up to 1975, Engsted & Tanggaard operate with Danmarks Nationalbank's discount rate as the risk-free yield. After that it is linked to a short-term zero-coupon yield. Their stock yield also includes dividend payments.
3
The significant difference between the Nielsen & Risager estimate for the period 1983-99 and this article's estimate for the period 1983-2002 is attributable to the large negative stock yields in 2001 and 2002.
4
The Copenhagen Stock Exchange total index increased by 701 per cent in the period 1983-99. HISTORICAL RISK PREMIUM FOR DENMARK (1-YEAR INTEREST RATE) Table 2
Risk premium
Per cent per annum Average Standard deviation
1983-2002 ... 7.6 33.8
Note: The risk-free yield is approximated using a 12-month euro-currency interest rate for Danish kroner. The rate of interest for the year is set at the interest at year-end for the preceding year. For instance, the interest rate for 1983 is set as the interest rate at end-December 1982, etc.
The historical risk premium for Denmark is somewhat lower than that observed in the USA. Cornell (1999) thus estimates the historical risk premium in the USA for the period 1926-97 at 7.4 per cent, i.e. almost twice the Danish level, cf. the Risager & Nielsen survey. The estimates in the two surveys are, however, not fully comparable, since Cornell oper-ates with annual yields on a 20-year US government bond as the ap-proximation for the risk-free yield.
Cornell's estimate is somewhat higher than Ilmanen's (2002) survey of the period 1900-2001, which gives a historical risk premium of 4.8 per cent for the USA. Ilmanen's risk premium is negatively affected by the relatively moderate annual stock yields in the period 1900-25 and the plummeting stock prices in the USA in 2000 and 2001. This illus-trates once again how sensitive the estimation of the historical risk premium is to the choice of period.
The period sensitivity of the historical risk premium means that it is not necessarily suitable for predicting investors' expected risk premium, cf. the previous section. In this connection Fama and French (2002) find that the realised historical risk premium in the USA in the period 1951-2000 was significantly above the investors' expected risk premium. They estimate that the realised historical risk premium in the USA for the period 1951-2000 was 7.4 per cent, while the expected risk premium is estimated at 2.6 per cent or 4.3 per cent, depending on the model ap-plied.1
Fama and French state large, unexpected capital gains for share-holders as the primary explanation for this difference between realised and expected risk premiums.
Changes in investors' risk aversion
As the above shows, there are no indications that the risk premium is constant over time. This picture accords well with the fact that the cir-cumstances affecting the risk premium are not constant either. This is not to say that the risk premium cannot have an equilibrium value to-wards which it will move, but that various shocks to the economy may also be reflected in a change in the risk premium.
This section illustrates how the risk premium may be affected by a change in investors' risk aversion. The analysis is based on the period 10-24 September 2001. The terrorist attacks on the USA on 11 September 2001 were totally unexpected, and it seems reasonable to assume that the fear and uncertainty in the wake of these events were reflected in increasing risk aversion among investors.
1
The two models are respectively a variant of DDM (2.6 per cent) and an earnings-growth model (4.3 per cent).
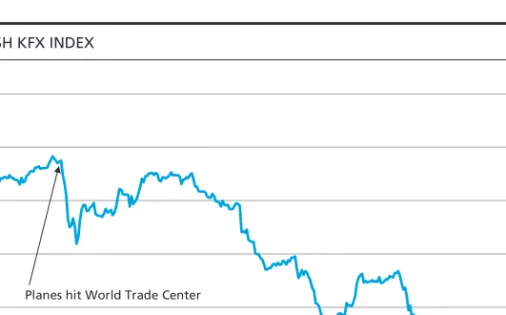
Chart 3 shows the development in the KFX index at 15-minute intervals in the period 10-24 September 2001. The KFX index plummets in the period immediately after 11 September, and falls by a total of 16.3 per cent up to 21 September at 3.00 p.m. when it reaches its lowest level.
If this price development is viewed within the framework of a Gordon model with an unchanged expected yield and risk-free yield, it can be illustrated how the expected risk premium changed as a result of an in-crease in investors' risk aversion.
Table 3 illustrates how the expected risk premium under these circum-stances changed immediately after 11 September. As previously stated, the expected risk premium is calculated as follows according to the Gordon model: (8) g i P g) (1 div E[RP] 0 0⋅ + + − =
It is assumed that only investors' risk aversion is affected by the terrorist attacks during the days immediately after 11 September, while other elements of the economy are assumed to remain unchanged. Conse-quently, the price P0 is the only incoming variable which is changed in the Table. It should be emphasised that this is a strong assumption which means that e.g. the price drops seen in the aviation industry are solely attributed to increased risk aversion. However, the assumption applies to a relatively short period.
THE DANISH KFX INDEX Chart 3
Source: Bloomberg. 230 240 250 260 270 280 290
Planes hit World Trade Center
10-09-0111-09-0112-09-0113-09-01 14-09-0117-09-01 18-09-01 19-09-01 20-09-01 21-09-01 24-09-01 9.00 a.m. 9.00 a.m.9.00 a.m. 9.00 a.m. 9.00 a.m. 9.00 a.m.9.00 a.m. 9.00 a.m. 9.00 a.m. 9.00 a.m. 9.00 a.m.
As can be seen, the Gordon model estimates the expected risk premium in the market at 1.15 per cent immediately prior to the terrorist attacks. Ac-cording to the Gordon model, the initial shock in the market led to an in-crease in the expected risk premium by 0.08 percentage points, cf. Table 2.
The following days saw increasing nervousness and uncertainty among investors, since it was not clear how the global economy would be af-fected by the terrorist attacks. This led to higher risk aversion, with invest-ors preferring more secure assets (e.g. government bonds) at the expense of stocks. In the Gordon model this was reflected in a further increase in the expected risk premium, from 1.15 per cent to 1.47 per cent. The as-sumption is that the entire decrease in the KFX index until 21 September 2001 at 3.00 p.m., when it reached its lowest level in that period, is attrib-utable to increased risk aversion, so that the other variables in the model remained unchanged.
This example illustrates how a change in investors' risk aversion affects the risk premium expected/required by investors holding stocks. When investors' risk aversion increases, stock prices will have to fall if the fu-ture dividend payments are to be in line with the increased risk pre-mium.
It should be emphasised that the Gordon model's estimate of the ex-pected risk premium is highly sensitive to the assumed rate of growth in dividends. An increase in the growth rate of 1 percentage point will thus always be reflected in an increase in the expected risk premium of more than 1 percentage point. If the level of the risk-free yield changes, the expected risk premium is affected on a 1: -1 basis. In other words, an in-crease in the risk-free yield by 1 percentage point will reduce the ex-pected risk premium by 1 percentage point.
Finally, the level of the risk premium is affected by the size of the divi-dend payments, div0. The question is whether it is reasonable to apply the latest dividend payments in the Gordon model, or whether an
esti-SHOCK TO INVESTORS' RISK AVERSION Table 3
11/9 at 2.45 p.m. 11/9 at 4.00 p.m. 21/9 at 3.00 p.m. P0 (price)... kr. 277.51 kr. 265.04 kr. 232.26
div0 (dividend in period 0)... kr. 4.35 kr. 4.35 kr. 4.35
g (growth rate in dividends) ... 4.60% 4.60% 4.60% i (risk-free interest)... 5.09% 5.09% 5.09% E[RP] (expected risk premium) ... 1.15% 1.23% 1.47%
Note: The dividend in period 0 is the total dividend for the period 3rd quarter 2000 to 2nd quarter 2001. The annual growth rate in dividends is set at the average growth rate for Danish GDP in current prices for the period 1990- 2001. The risk-free yield is approximated using the average interest rate on a 10-year Danish government bond in 2001. If surpluses are only partly distributed, the calculation will understate the level of the risk premium.
mated long-term level should be applied instead. In a variant of the Gordon model the dividend payments are replaced by a share of the companies' actual revenue, making the model independent of the com-panies' dividend policy. The latter may be influenced by e.g. fiscal con-siderations.
LITERATURE
Cornell, B. (1999), The Equity Risk Premium – The Long-Run Future of the Stock Market, John Wiley & Sons, Inc.
ECB (2002), The Stock market and monetary policy, Monthly Bulletin – February 2002.
Ejerskov, S. (2000), Stock Prices, Property Prices and Monetary Policy, Danmarks Nationalbank, Monetary Review 4th Quarter 2000.
Engsted, T. & Tangaard, C. (1999), Risikopræmien på danske aktier (The risk premium on Danish stocks), Nationaløkonomisk Tidsskrift 1999, Vo-lume 137.
Fama, E. F. & French, K. R. (2002), The Equity Premium, The Journal of Finance, vol. LVII, No. 2, April 2002.
Gordon, M. J. (1962), The Investment, Financing and Valuation of the Corporation, Irwin.
Ilmanen, A (2002), Stocks Versus Bonds, Schroder Salomon Smith Barney.
Nielsen, S. & Risager, O. (2001), Stock returns and bond yields in Den-mark, 1922-99, Working Paper 3-2001 Department of Economics, Co-penhagen Business School.
Olesen, J. O. & Risager, O. (2000), On the Predictability of the Danish Eq-uity Premium, Working Paper 5-2000 Department of Economics, Copen-hagen Business School.
Panigirtzoglou, N. & Scammell, R. (2002), Analysts' earnings forecast and equity valuations, Bank of England Quarterly Bulletin, Spring 2002.
Wetherilt, A. V. & Weeken, O. (2002), Equity valuation measures: what can they tell us? Bank of England Quarterly Bulletin, Winter 2002.