JULY 2015
Research Report 404
The Relation between Industry
and Services in Terms of
Productivity and Value Creation
Robert Stehrer (wiiw, coordinator), Paul Baker (Ecorys),
Neil Foster-McGregor (wiiw), Johannes Koenen (Ifo),
Sandra Leitner (wiiw), Julia Schricker (Ifo),
Thomas Strobel (Ifo), Hans-Günther Vieweg (Ifo),
Jurgen Vermeulen (Ecorys),
Anastasia Yagafarova (Ecorys)
The Vienna Institute for International Economic Studies Wiener Institut für Internationale Wirtschaftsvergleiche
PAUL BAKER (ECORYS)
NEIL FOSTER-MCGREGOR (WIIW)
JOHANNES KOENEN (IFO)
SANDRA LEITNER (WIIW)
JULIA SCHRICKER (IFO)
THOMAS STROBEL (IFO)
HANS-GÜNTHER VIEWEG (IFO)
JURGEN VERMEULEN (ECORYS)
ANASTASIA YAGAFAROVA (ECORYS)
Robert Stehrer is Deputy Scientific Director of the Vienna Institute for International Economic Studies (wiiw). Sandra Leitner Research Economist at wiiw. Neil Foster is Research Fellow at UNU-Merit in Maastricht/NL and Research Associate at wiiw. Johannes Koenen, Julia Schricker, Thomas Strobel and Hans-Günther Vieweg are researchers at IFO. Juergen Vermeulen and Anastasia Yagafarova are consultants at Ecorys NL. Paul Baker is an independent economic consultant.
This research report is a slightly revised and edited version of a study originally written in 2014 by members of the ECSIP consortium, within the Framework Contract for Industrial Competitiveness and Market Performance – Contract No. ENTR/90/PP/2011/FC for the Directorate-General for Enterprise and Industry (now: DG Growth).
The European Competitiveness and Sustainable Industrial Policy Consortium, ECSIP Consortium for short, is the name chosen by the team of partners, subcontractors and individual experts that have agreed to work as one team for the purpose of the Framework Contract on ‘Industrial Competitiveness and Market Performance’. The Consortium is composed of Ecorys Netherlands (lead partner), Cambridge Econometrics, Danish Technological Institute, Euromonitor, IDEA Consult,IFO Institute and wiiw, together with a group of highly skilled and specialised individuals. The information and views set out in this report are those of the authors and do not necessarily reflect the official opinion of the European Commission.
services in particular – is rising in almost all advanced economies. However, as these industries are mutually dependent in various ways this study focuses on the manufacturing sector as a user of activities provided by the services industries and – in particular – the way the latter contributes to productivity and value creation in the former. To the extent that this is the case, manufacturing industries benefit from a vibrant business-services industry and themselves play an important ‘carrier function’ of services – issues which are addressed by considering manufacturing activities in a value chain approach. As a consequence, EU Member States facing a declining share of manufacturing might still be part of the manufacturing value chain via the provision of services whereas other countries benefit from services provided by other countries. The role of cross-border flows of services and the patterns of outsourcing and offshoring of such activities across Europe is therefore gaining importance. It is argued that a differentiated pattern of specialisation emerged within Europe with a set of countries keeping a stronghold in manufacturing industries and others are specialising in the provision of related services, whereas some countries have faced a decline in their manufacturing shares, but have not succeeded in increasing their specialisation in business services either.
The first four sections of the study present selected quantitative indicators concerning the
“manufacturing value chains”, discuss the relative importance of the manufacturing–services interaction and its cross-border dimensions, and point towards differences across countries, industries and services activities, and the respective changes over time. Further, impacts of these interactions on manufacturing performance are addressed econometrically. The following two sections highlight important dimensions of services use in manufacturing and issues related to services trade and potential barriers in that respect for selected industries and countries, incorporating both quantitative and qualitative insights.
Keywords: manufacturing-service interaction; EU wide specialisation; manufacturing value chains; industry studies
1.1. Manufacturing, services and their interrelatedness ...7
1.2. General framework for exploring manufacturing–services interactions ...10
1.3. Overview of study ...16
2. Performance and interdependence of industries and services ... 17
2.1. Manufacturing and services performance ...17
2.2. Indicators capturing the inter-linkages between manufacturing and services industries ...28
2.3. Summary ...43
3. Assessing the role of business services linkages for manufacturing performance in EU Member States ... 44
3.1. Introduction ...44
3.2. Data and methodology ...44
3.3. Differentiated impact of business services linkages on manufacturing performance ...46
3.4. Summary ...49
4. Services in the manufacturing value chain ... 50
4.1. The value chain perspective ...50
4.2. Manufacturing value chains in EU Member States ...54
4.3. Summary ...57
5. Exploring patterns of manufacturing–services interaction and international linkages for specific country–industry cases ... 58
5.1. Introduction ...58
5.2. Methodology ...58
5.3. General developments in the selected industries ...60
5.4. Qualitative results concerning manufacturing–services interactions ...67
6.3. Barriers and framework conditions in services trade ... 96
6.4. Linking barriers to services trade to the use of imported services by EU manufacturers ... 103
6.5. Summary ... 109
7. Summary of main findings ... 111
7.1. Performance of manufacturing and services and their inter-linkages ... 112
7.2. Manufacturing–services interaction and manufacturing performance ... 115
7.3. Services in the manufacturing value chain ... 115
7.4. A detailed look at manufacturing–services inter-linkages and business services trade ... 116
Table 2.3 / Share of business services according to CPA Rev. 2 in EU-27*, 2010 ...33
Table 3.1 / Selected results of business service linkages and manufacturing performance ...47
Table 4.1 / Value added creation in EU-27 as a percentage of total value added (GDP), 1995 and 2011 ...51
Table 4.2 / Structure of the value creation process in EU-27, 2011 ...52
Table 4.3 / Manufacturing value chain indicators, by Member State ...55
Table 6.1 / Geographical structure of service imports as a percentage of total imports of this service category, 2011 ...96
Table 6.2 / STRI scores ...98
Table 6.3 / PMR indices (2013) ...102
Figure 1.1 / Overview of the categorisation of producer services ...10
Figure 2.1 / Real growth rates of manufacturing and business services as a percentage, 1995–2007 ...19
Figure 2.2 / Percentage point changes in manufacturing and business services shares, 1995–2011 ...20
Figure 2.3 / European manufacturing and business service specialisation dynamics, 1995–2011 ...21
Figure 2.4 / Share of business services according to NACE Rev. 2 in GDP for EU-28, as a percentage of GDP ...22
Figure 2.5 / Share of selected business services according to NACE Rev. 2, as a percentage of GDP, 2011 ...23
Figure 2.6 / Percentage point changes in share of selected business services, 2000–2011 ...24
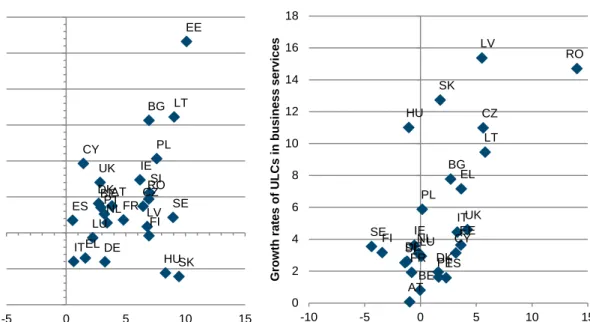
Figure 2.7 / Productivity and unit labour cost developments, growth rates 1995–2007 as a percentage ...26
Figure 2.8 / Performance and specialisation dynamics 1995–2007 ...27
Figure 2.9 / Secondary service production of manufacturing industries, as a percentage of gross output ...29
Figure 2.10 / Cost share of services in manufacturing, as a percentage of gross output ...30
Figure 2.11 / Cost share of services in manufacturing, as a percentage of gross output ...31
Figure 2.12 / Structure of service cost shares as a percentage of gross output, 2011...32
Figure 2.13 / Percentage point changes in service cost shares in manufacturing, 1995–2011...32
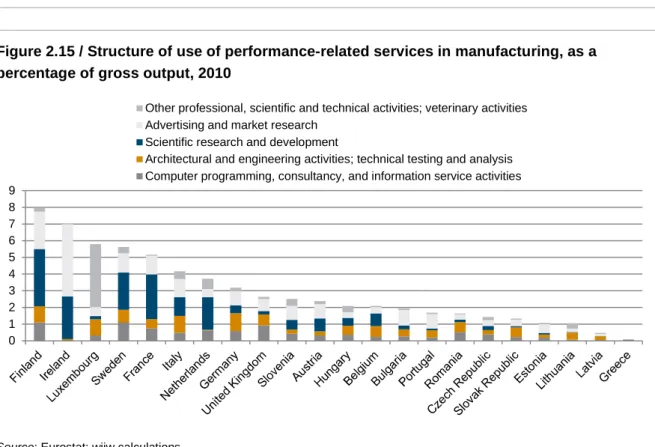
Figure 2.14 / Structure of performance-related services, 2010 ...34
Figure 2.15 / Structure of use of performance-related services in manufacturing, as a percentage of gross output, 2010 ...34
Figure 2.16 / Direct cost shares of imported business services in manufacturing, as a percentage of gross output ...36
Figure 2.17 / Import intensities and the cost share of business services in manufacturing, as a percentage, 2011 ...36
Figure 2.18 / Cost shares of imported business services used in manufacturing, as a percentage of gross output, 2011 ...37
1995–2011 ... 40
Figure 2.22 / Structure of service content of manufacturing final goods production, 2011, as a percentage ... 41
Figure 2.23 / Change in structure of service content of manufacturing final goods production, 1995–2011, percentage points ... 42
Figure 2.24 / Imported direct and indirect business services content of manufacturing final goods production, 2011, as a percentage of total ... 42
Figure 4.1 / Industry and value chain perspective of the manufacturing process ... 50
Figure 4.2 / Industry and value chain shares for manufacturing, as a percentage of GDP, EU-27 ... 53
Figure 4.3 / The structure of manufacturing value chains, as a percentage, EU-27 ... 54
Figure 4.4 / Changes in manufacturing and manufacturing value chain share, in percentage points 1995–2011 ... 56
Figure 4.5 / Manufacturing value chain shares and structures, 1995 and 2011 ... 57
Figure 5.1 / Employment and productivity by industry (EU-6) ... 60
Figure 5.2 / Sectoral shares in GDP in EU-6: industry approach versus value chain approach ... 61
Figure 5.3 / Value chain approach: share of manufacturing, total and business services, by industry (EU-6) ... 63
Figure 5.4 / Share of business services as a percentage of total services used in manufacturing industries, 2011 ... 64
Figure 5.5 / Share of business services as a percentage of total services used in manufacturing industries, 2010 ... 65
Figure 5.6 / Comparison of the French and German machinery industry ... 69
Figure 5.7 / Comparison of the French and German transport equipment industry ... 71
Figure 5.8 / Value chain approach for the Czech Republic and Poland ... 74
Figure 5.9 / Comparison of the Polish and Swedish textiles and clothing industry ... 81
Figure 5.10 / Comparison of the Czech and Danish food and beverages industry ... 84
Figure 6.1 / Share of imported PE services as a percentage of PE services, 2011 ... 94
Executive summary
Changing patterns of specialisation in manufacturing and business service activities across Europe
Despite positive growth rates of industrial output in absolute terms, the share of manufacturing value added in overall GDP of the EU declined from 20% in 1995 to 16% in 2011 (following a long-term trend), whereas the share of business services increased from about 14% to 18% over the same period for the whole economy. However, despite this increase in business services, an overall ‘deindustrialisation’ trend is still to be observed for the EU as a whole, when only those services are included that are used in manufacturing activities for the provision of final manufactured goods. This ‘value chain approach’ shows a decline in the combined manufacturing and related services share of GDP from 25.7% in 1995 to 22% in 2011. A number of reasons have driven this trend, including overall shifts in demand,
significant improvements in productivity, companies externalising business services to outside Europe, offshoring of core manufacturing activities (notably to Asian countries) and changes in relative prices in favour of services (Baumol’s cost disease1).
These changing patterns of specialisation are, however, not uniform across the EU Member States: the geographical patterns of specialisation have become more pronounced. While some countries remain relatively specialised in manufacturing (e.g. Germany, Austria, Central and Eastern European countries), a second group is specialising more in business services (e.g. the UK, the Netherlands, Belgium and France). Consequently, specialisation and agglomeration trends are observed for both manufacturing and services activities.
A third group of countries, comprising the Baltic States, Greece, Malta, Spain and Portugal, have faced a decline in their manufacturing shares, but have not succeeded in increasing their specialisation in business services either. This may be because these countries have started from a lower level and, with respect to initial specialisation patterns, from a less favourable manufacturing base. These conditions, together with the creation of bubbles in their economies and the ensuing difficulties, resulted in a loss of manufacturing competitiveness and an unfavourable economic development following the economic and financial crisis.
A mutually dependent and dynamic relationship between manufacturing and services
The production of manufactured output involves many activities along the value chain, from
predominantly pre-production-stage activities (such as R&D and design), through the production (or assembly) stage, to predominantly post-production activities (such as logistics, distribution, maintenance and marketing).2 As physical inputs, services can either be provided in-house or sourced from service providers. In terms of direct cost shares in manufacturing, on average about 25% are service inputs; but
1
Baumol’s cost disease states that due to larger productivity growth in manufacturing activities, as compared to services, the relative price of manufactured products is declining, which consequently implies that the share of manufacturing is declining in nominal terms.
2
there are large differences across countries, with shares ranging from more than 30% to less than 15%. In terms of direct cost shares, distribution services account for about 12%, transport and communication for about 5%, and business services for about 9% of total manufacturing costs. The service content of manufacturing production increased by about 3 percentage points on average across countries over the period 1995 and 2011.
When taking account of both direct and indirect linkages, the average service content of manufactured goods produced in the EU comes close to 40% of the total value of final manufacturing goods produced. The bulk of these services are distribution services (15%), transport and communication (8%), and business services (which range from under 10% to 20% or more across the EU Member States). This last category includes services such as legal and accounting services, research and development (R&D), advertising and market research, engineering activities and information and communications (ICT) services. The remaining service activities, which represent a negligible share of the total, are non-market services. These numbers reflect a trend towards increased use of outsourcing of services by manufacturing firms.3
Additionally, there is a trend towards services being increasingly supplied together with physical products: a phenomenon sometimes described as ‘servitisation of manufacturing’.The amount of services provided by manufacturers is not completely represented in officially available statistics and hence is not part of the cost shares presented above. The servitisation share of total manufacturing revenues varies greatly. Shares of between zero and 30% have been mentioned in interviews. Servitisation is to a large extent dependent on product programme and market environment with, generally speaking, final goods markets providing better opportunities to offer services over the whole product lifecycle. Servitisation contributes to EU manufacturers’ international competitiveness through comparative advantages in the field of services driven by know-how, in particular engineering, and thus opens up growth opportunities for manufacturers who tap into new business areas, such as BOT,4 lifecycle services, etc.
Finally, of course, services also use manufacturing inputs for the provision of services. However, these channels operate primarily via the supply of capital goods, rather than intermediate inputs. The direct cost shares of manufacturing in services are therefore rather low at only about 2% of the gross output of services, and do not give an accurate quantification of the relationship between services and
manufacturing.
Services–manufacturing interaction is growing across industries for different reasons
Expert interviews in four industries (machinery, transport equipment, textiles and clothing, and food and beverages) and six countries (France, Germany, Denmark, Sweden, the Czech Republic and Poland) have shown that, for an in-depth understanding of the use of services in manufacturing, country and industry characteristics have to be taken into account. The industries considered differed greatly in terms of their structure, production technology, rate of innovation and their exposure to globalisation. For the
3 Note that these data provide a conservative estimate concerning the service content of manufactured products, as they
do not account for services produced ‘in-house’ as services.
4
Build–Operate–Transfer: a form of project finance which traditionally has been applied to large investment projects where manufacturers are reimbursed by revenue earned through the operation of the establishments delivered. Finally, ownership is transferred to the client.
four industries, these four features largely explain the differences in the relationship between manufacturers and service providers, the critical fields of interaction and the economic impact of services on manufacturing companies’ performance.
In the machinery and transport equipment industries – as examples of medium-high- and high-tech industries – the cost share of services for medium-high to high-tech industries has been growing and is expected to increase further, mostly through outsourcing of R&D and engineering services, in particular by the spin-off of R&D and engineering units and because of the need to set up more efficient and effective development processes. The most important drivers behind this trend are the growing complexity of products and the integration of different technologies. The findings indicate that the success of R&D and engineering projects depends on the interaction of the different players involved and on the objectives of the outsourcing strategies pursued. For example, outsourcing of R&D and engineering services can be motivated by cost saving, as well as by the need for access to specific expertise.
By contrast, in both so-called ‘low- to medium-low-tech’ industries considered – food and beverages and textiles and clothing – efforts to increase the efficiency and effectiveness of the value chain management is the most important driver of growing business service inputs. A second explanation for the growing cost share of business services is related to downstream strategies. Manufacturers try to be better placed in their sales markets, through services such as market research and advertising, and to offer their clients additional services, such as logistics and product placement. These activities comprise the provision of external and own services (i.e. servitisation, as discussed above). These ‘low-tech’
industries also show higher cost shares of industrial output caused by transport and distribution services, which is due to the fact that these two industries are, to a greater extent, producers of consumer
products.
The ability to exploit services – in particular business services – has contributed a great deal to the success of manufacturers in these ‘low-tech’ industries. Above all, companies from the textiles and clothing industry have been investing heavily in value chain management and the related upstream and downstream services. As such, these companies have been able to meet the challenges of globalisation through the management of international supply chains. In terms of value added and jobs, this has partly been able to compensate for the reduction in domestic production capacities, thanks to the tapping of new business areas. The success of these industries has therefore driven the growing integration of services and manufacturing. Although the growth in related services might not be sufficient to fully compensate for the losses in manufacturing activities, these services do increase EU companies’ competitiveness and reduce any negative impact resulting from the structural changes taking place in the low-tech industries as a result of globalisation.
The differences in the interaction of services and manufacturing between the industries under
consideration suggest that sectoral specificities have to be taken into account when formulating public policies and schemes.
Services–manufacturing interrelationships also determined by country specifics
The interrelationship of services and manufacturing further shows quite different patterns between the Member States under consideration. The predominant strategies pursued by manufacturers in the
individual countries impact not only on the overall use of services, but also on the kind of services sourced from outside. This is particularly the case with regard to the use of R&D and engineering services in medium-high- to high-tech industries, which are well suited to contribute to manufacturers’ economic performance and to their supply of technologically leading, high-performance products.
For example, there are remarkable differences in the amount of external services used by French and German companies. French companies have been more inclined to outsource, whereas German firms have relied to a greater extent on internal service provision. Outsourcing is driven not only by the sophistication of products and the integration of numerous different technologies, but also by the manufacturers’ need to improve their economic performance through cost saving. French companies in this the transport equipment industry have been struggling more than their German competitors, and this may explain why they have outsourced more. There are indications that German companies are also moving towards a greater use of outsourcing.
For the smaller countries, the fieldwork revealed that the Danish manufacturing sector, for example, is struggling with a loss of competitiveness. The cost shares of services in manufacturing are well below those of the other EU Member States under consideration, so that Danish manufacturers are less able to exploit the possibilities of increasing their competitiveness through outsourcing than are manufacturing firms in other comparable countries.
The Swedish manufacturing industry provides a good example of maintaining a viable sector through comprehensive exploitation of services. Traditionally, Swedish firms have successfully commanded global value chains, and only little capacity is left in the country; however, these have remained
competitive thanks to the use of services. Most impressive is the Swedish textiles and clothing industry: although only marginal manufacturing capacities are left in Sweden, the textiles and clothing industry is viable, provides attractive workplaces, is strong in R&D and design, and manages to keep its position in the global production network through value chain management.
Since the fall of the Iron Curtain, Poland and the Czech Republic have become market-oriented economies. During the transition phase companies were privatised, with foreign direct investment (FDI) playing an important role in this process and affecting the structure of the respective manufacturing industries. Typical of both countries are foreign-owned and domestically owned production sites that are integrated upstream in international supply chains. Independent, domestically owned companies which successfully command their own international distribution and sales networks exist as well, but are less frequent. Due to this characteristic the exploitation of services does not yet play the same role for Polish and Czech manufacturers as it does for most companies from EU Member States of longer standing. As many companies are struggling to meet the challenges emerging from production sites located in non-EU low-wage countries, in the longer run their survival will probably depend on process and product innovations and the upgrading of product programmes, for which services are pivotal. However, the Central and Eastern European manufacturing sector is expected to undergo structural changes similar to those in the long-standing Member States. The loss of production capacities, in particular of labour-intensive activities, will however only be partly alleviated through the use of services by manufacturers, increasingly driven by know-how.
To summarise, these results indicate that improved access to services and increases in the quality of services have the potential to strengthen the competitiveness of the EU manufacturing sector. However,
even improved services and an improved integration of services and manufacturing will not prevent changes in the international division of labour and the relocation of manufacturing capacities.
Manufacturing firms in smaller countries source a higher proportion of business services from abroad than do manufacturing firms in larger countries
The proportion of business services sourced from abroad tends to be small in all countries: in most, the share of imported business services in manufacturing gross output is less than 1% (compared to about 5–10% in terms of direct cost shares of total business services used in manufacturing), with only a few countries showing higher shares. However, it should be borne in mind that this does not include services provided domestically via the commercial presence of foreign-owned affiliates (Mode 35) or through the long-term presence of foreign-national persons (Mode 4). For the cross-border provision of services (Mode 1) measured here, there is a distinct pattern whereby manufacturers in smaller countries source a relatively large share of their business services from foreign, mostly intra-EU, suppliers. This is, in particular, the case for Central and Eastern European countries.
The differences in the intensity of use of imported business services suggest that manufacturers in larger countries have access to a more substantial base of domestically supplied services, whereas manufacturers in smaller countries have to rely more on foreign-sourced business services in order to gain access to the services they need. These different patterns also become apparent when considering the relationship between manufacturing performance and business services: for the set of large EU countries, econometric evidence reveals a positive impact of domestic (and – to a smaller and less robust extent – foreign) business service inputs on manufacturing performance, measured in terms of productivity or value added growth; for smaller countries, the econometric results suggest that in particular foreign business services linkages are important for improved manufacturing performance. However, this does not mean that large EU Member States would not profit from more open services markets. In particular, the service providers in larger countries would also benefit from enlarged markets, and the manufacturing sector in larger countries would, in turn, gain advantage from increased
competition and the specialisation of business service providers.
Given the increasingly pronounced patterns of specialisation across Europe, and the relative importance of foreign-sourced business services – particularly for smaller countries – potential barriers to cross-border trade in services and to international manufacturing–services linkages are an important policy issue. However, the issue is not straightforward and goes beyond the issue of regulatory barriers. An analysis of the correlation between the patterns of use of imported services by manufacturing industries and the number of regulatory barriers to services trade present in a country did not reveal a significant relationship between the two. Furthermore, interviews with EU service providers and an analysis of regulatory barriers to services trade using data from the OECD Services Trade Restrictiveness Index (STRI) and Product Market Regulation (PMR) indices suggest that legislation at the EU level is not significantly hampering cross-border trade in services. Nevertheless, from the interviews it is also clear that in practice significant regulatory barriers still exist at lower levels. These barriers relate, for example, to differences in Member States’ internal legislation or the concrete implementation of EU regulations in individual countries.
5
The four modes of supply (as defined by the General Agreement on Trade in Services (GATS)) are: Cross-border trade (Mode 1); Consumption abroad (Mode 2); Commercial presence/establishment (Mode 3); Presence of natural persons (Mode 4).
Moreover, given the lower tradability of services (compared to goods), entry modes other than the cross-border provision of services are often more important. For example, for most performance-enhancing services, tradability of services is rather low and a local presence is required for a large part of the service offering, because factors such as ‘trust’, the performance of domestic services markets, language, and knowledge of local regulations and culture all play an important role. Consequently, for many types of services the policy issue for stimulating the use of foreign-sourced services in EU manufacturing industries relates more to the entry and the right of establishment of firms, as well as to the recognition of professional qualifications across borders. It should, however, be noted that the increasing digitalisation of performance-enhancing services is likely to increase their tradability in future. This in turn will affect the policy intervention needed to support them.
Main policy messages
In summary, there is evidence of a positive relationship between the performance of business services and the performance of manufacturing: notably, manufacturing sectors that buy in a relatively high proportion of business services have better productivity performance than do sectors with a relatively low buy-in of business services. This indicates that the performance of manufacturing could be improved through policies that support the development of business services activities and their quality.
Furthermore, access to foreign suppliers of business services seems particularly important for smaller countries, since they usually do not have a full range of high-quality domestically supplied business services. However, given the ongoing trend towards further specialisation and agglomeration of both business services and manufacturing across Europe, even for larger countries there is increasing potential from improved competition and increased trade in business services. The ‘manufacturing core’ countries would benefit, for example, from improved access to foreign services suppliers from countries that are becoming more specialised in business services. In turn, the ‘business services’ specialist countries will also profit from the increased cross-border demand for business services.
Since goods and services markets are becoming more closely linked, and since business services impact positively on the performance of manufacturing (and vice versa), further steps towards integration should be undertaken, in particular in areas where barriers still exist. For example, a more ambitious implementation of the EU Services Directive would be a significant step forward in this direction, accompanied by the removal of remaining regulatory barriers to goods markets as well, in particular at the national level. Consequently, with the trends towards further specialisation and agglomeration in business services and manufacturing, reinforcing the internal market for both services and goods is likely to become even more important for EU competitiveness in the future.
Openness to trade will support further specialisation across countries and will allow the EU as a whole to reap the rewards of specialisation. This study shows that a group of countries, perhaps in particular those on the periphery, have managed neither to keep a strong manufacturing base nor to develop strong business services industries. This indicates that there is a risk that some Member States may have difficulty in participating in EU (and globalised) manufacturing and business services value chains. These problems are to a degree caused by the loss of competitiveness due to the build-up of economic bubbles in these countries in the run-up to the economic and financial crisis. While they have to some extent managed to develop sectors other than business services and manufacturing, it would seem advisable for these countries to improve their overall competitiveness, in order to benefit more from the opportunities resulting from the globalisation of manufacturing and business services value chains.
1.
Introduction
1.1. MANUFACTURING, SERVICES AND THEIR INTERRELATEDNESS
The services sector plays an important role in advanced economies, not only because of its high and growing share in total GDP (more than 70% in most advanced economies) or its role in employment creation, but also because it is an essential source of inputs in manufacturing. Of the service sectors, business services play a particularly important role as inputs in production, e.g. in terms of consultancy activities, design activities, marketing, cleaning, etc. As can be seen, business services are
heterogeneous and have different degrees of importance in the manufacturing process in upstream and downstream activities along the manufacturing value chain.
By contrast, most developed economies have witnessed a declining share of the manufacturing sector over an extended period of time. However, the experience is mixed, and while some countries
experience an acceleration of this trend, others successfully maintain their strong manufacturing bases (Stöllinger et al., 2013). Therefore, on the one hand policy makers focus on reorienting their economies towards services in order to outweigh the loss of manufacturing jobs; but on the other hand, they also strive to maintain a strong manufacturing base. This is referred to as ‘re-industrialisation’, which is widely debated not only in the EU and among its Member States, but also in other major advanced economies, particularly the United States. However, given the strong linkages between manufacturing and services, the question is not just about promoting manufacturing per se, but about promoting manufacturing and service sectors/activities in which the EU can be globally competitive.
There is an increasing awareness that manufacturing and services are closely intertwined. First, manufacturing firms not only use various services as important inputs in their production process in a broad sense, but also bundle their products and provide services along with their products. Second, a number of service activities are also carried out within manufacturing firms, which may be partly outsourced or offshored (e.g. business function offshoring). Conversely, service industries also use the output of manufacturing industries, which allows them to provide their activities more efficiently, for example, (i) goods are sold by service providers (for instance for maintenance and repair), (ii) via information and communications technology (ICT) systems development and integration and (iii) capital goods used in service activities. Hence, given strong inter-sectoral linkages and interrelationships, changes or improvements in the service sectors and the conditions impacting on the interaction of services and industry (both within and across countries) are expected to have important effects on the performance of the manufacturing sector.
In the European Industrial Policy Communication of 2012, the Commission emphasised the need to reverse the declining role of manufacturing in Europe from the current 16% or so of GDP to as much as 20% by 2020, in order to address and counter the prevailing and persistent economic ailments, to guarantee sustainable growth and the creation of high-value jobs, and to solve pressing societal challenges. This is even more relevant as the growth of manufacturing has been negatively affected by crisis-related low consumption, low investment levels and general policy uncertainty. On the positive side, the good export performance of European industry and its global competitiveness in high
value-added goods point to important growth potentials for European manufacturing. This can, however, only become sustainable if European firms succeed in maintaining their competitive edge in global markets by further improving productivity, increasing the value-added content of their products and innovating. In all of this the service sectors provide important inputs.
The emphasis on the interrelatedness of the two sectors implies a shift in perspective. Baumol (1967) warned of the danger posed to the global economy by increasing services intensity. He claimed that, due to the low productivity of the ‘stagnant’ services sector, an increase in the share of services in GDP causes overall productivity growth to stagnate – the so-called ‘Baumol disease’. However, the major critique of Baumol’s theory lies in the fact that he considered services to be used for final consumption only, and not as intermediate inputs which can affect economy-wide productivity indirectly.6 In particular, some services facilitate transactions through space (transport and telecommunications) and time (financial services). Also, many producer-related services are often found to be important vehicles for the transmission of knowledge spillovers and to initiate changes in the production processes of client firms, which, in turn, improve overall productivity not captured by direct measurement. Empirically there is mounting evidence to refute Baumol’s concerns about the negative productivity effects emanating from the continuously expanding service sector. Instead, a positive productivity effect is found to prevail. For example, Maroto-Sanchez and Cuadrado-Roura (2009 show that between 1980 and 2005 the relationship between the growth of services (in terms of percentage of total employment) and overall productivity growth was positive and statistically significant in 37 OECD countries.
The relevance of this critique may best be seen from the role of knowledge-intensive business services (defined as NACE Rev. 1 70 to 74), the so called knowledge-intensive business services (KIBS).7 The share of business services and of KIBS is generally increasing in the EU Member States, as is their share used as intermediate inputs in manufacturing, as will be documented below.
These trends can imply two effects: on the one hand, manufacturing outsources or offshores low value-added activities to external suppliers, which raises measured productivity in manufacturing. On the other hand, manufacturing makes increased use of specialist service inputs (e.g. KIBS), which gives rise to a positive (spillover) effect on productivity.
For a number of reasons, therefore, services have become increasingly intertwined with manufacturing activities. Consequently, developments in the services sector are not isolated, but instead affect manufacturing, too, so that productivity improvements or increases in growth in the service sector give rise to important productivity or output growth effects in the manufacturing sector, and vice versa. The service sector is found to be an important engine of innovative activities and spillovers for other sectors. For example, Kox (2004) shows that the Dutch business services industry, which has grown much faster
6
Besides, misleading findings on productivity in services may arise from incorrect measurement (Maroto and Rubalcaba (2008). Wölfl (2003) identifies the following sources of measurement biases: difficulties in measuring output of certain service sectors (such as financial services); choice of deflators and disentangling the effects of price changes from the effects of quality changes; aggregation bias when calculating aggregate productivity based on its components. There is substantial evidence that low or negative productivity rates in services are partly linked to inadequate measurement of service productivity growth (in particular the way constant prices are computed). Potential underestimation of service productivity growth leads to an underestimation of aggregate productivity growth.
7
In the literature, various definitions of the knowledge-intensive business services (KIBS) industries are used: these depend rather on data availability and the respective classifications to be used. These figures are therefore only indicative of the relative importance of the KIBS sector.
than the market services sector as a whole, but displayed stagnating productivity growth, plays a crucial role in the national innovation system and creates knowledge spillovers to other sectors. Similarly, Foster-McGregor et al. (2012) use the World Input-Output Database (WIOD) to analyse the prevalence of technology spillovers between services and industry. They demonstrate that through R&D the service sector generates non-negligible productivity effects for manufacturing industries.
Thus, given the importance of industry–service linkages, it is important to understand the potential barriers – and also the enablers – of these links. Previous studies have shown that framework conditions can be an important determinant of the productivity performance of the service sector, which, in turn, affects the performance of other sectors. For example, PWC (2007) conducted a literature review and found that inappropriate labour or product market regulation can dampen innovation and inhibit the uptake of ICT. Moreover, in the retailing sector, restrictions on planning permission, flexible working, opening hours and other operational factors can place important limitations on retail sector efficiency. Also the role of the internal market was found to be an important determinant of service sector
productivity. Ecorys (2011) showed that differences in regulatory regimes are significant determinants of relative performance in services between EU Member States. This study has also found that, for example, administrative burdens, barriers to trade and investment, price controls and the costs of starting up a company have an important negative impact on the performance of services.
Next to these different perspectives, the impact of regulations on services–industry relations can be expected to differ depending on the type of relation between the two (see discussion below). For example, if services play an important role in manufacturing innovation – as is the case with technical engineering and its relation to technical products (an instance of co-production) – innovation policy may affect not only the technical engineering sector, but also the producer of technical products. By contrast, if a service is supplied as a support service and not as an input (e.g. security services), innovation policy may affect the performance of the security service sector, but is unlikely to contribute significantly to any increase in productivity of the industry that uses those security services. It has to be stressed, however, that the effect of framework conditions may be positive or negative: they can act as a barrier, hindering productivity improvements, or they can help to promote productivity improvements in interrelated services and industries. Although previous studies have started to analyse some of these framework conditions, the analysis has been at a relatively general level. A deeper understanding of how framework conditions affect the service sector and its relationship with industry is needed in order to develop appropriate policies.
To summarise, the strong and growing inter-sectoral linkages and the critical role of the service sector for the development and performance of industry all point to the importance of a policy framework that helps to revitalise industry and keep it internationally competitive by also fully exploiting the potential of services. Moreover, industrial policy also needs to ensure that the service sector can fully profit from – and exploit the opportunities emanating from – industry to optimise economic growth and employment generation.
Concerning the EU, an important aspect is the role of the internal market and trade in services among EU Member States which might contribute to a thriving manufacturing industry in the EU economy.
1.2. GENERAL FRAMEWORK FOR EXPLORING MANUFACTURING–SERVICES
INTERACTIONS
1.2.1. BUSINESS SERVICES CATEGORISATION
There is a wide range of service activities which are directly and indirectly linked to the provision of a manufactured good. Kox and Rubalcaba (2007) provide a general taxonomy of producer services8 (Figure 1.1) that distinguishes between those services that may be categorised as network-type services (e.g. distribution, transport and logistics, financial services, telecommunications, and energy) and business services, which they define as ‘a set of service activities that – through their use as
intermediary inputs – affect the quality and efficiency of the production activities by complementing or substituting the in-house service functions’. Within the category of business services, they further
distinguish between operational services that supply relatively standardised business services, and knowledge-intensive business services (KIBS) that generally produce client-specific services with high knowledge content. In relative terms, operational services are mainly concerned with the provision of manual skills, while KIBS are based on knowledge and information in the production and delivery of services. Viitamo (2007) considers that the taxonomy of Kox and Rubalcaba can be seen in terms of the generality of the service functions, with the highest generality (i.e. lack of client-specific characteristics) associated with network-type services, while operational business services – although also relatively standardised – are more specialised in terms of supporting specific functions. Finally, knowledge-intensive business services have the highest degree of customer specificity.
Figure 1.1 / Overview of the categorisation of producer services
Producer services Business- related services Business services Knowledge- intensive business services (KIBS)
Software and computer services Strategy and management consulting Accounting, tax and legal advice Marketing services, opinion polling Technical services, engineering Research and development Personnel training, headhunting
Operational business services
Security services
Facility management, cleaning Administration, bookkeeping Temporary labour recruitment
Other operational services (e.g. catering, photography, translation, call centres)
Leasing and renting Real estate
Network-type services
Distribution and trade services Transport and logistics
Banking, insurance, stock exchange Telecommunication, courier Energy services
Consumer services partly used by enterprises (business travel, company health service, social insurance services)
Source: Adapted from Kox and Rubalacaba (2007).
8
Based on the main client base (customer segment) for the service provided, a distinction may be drawn between consumer services – i.e. services that are primarily consumed by private individuals – and producer services that are primarily used as intermediate inputs into the production processes of businesses.
From the above, it is evident that there is a large and diverse range of business-related services that interface with industry in different ways; for example, by providing various technological, operational, distributive and financial capabilities. Moreover, these services vary in terms of the degree to which they are tailored to the specific requirements of industry. They also vary in terms of the intensity of their interaction with industry, with some services providing specific capabilities that require a high degree of understanding and continuous interaction with industrial (manufacturing) production activities to deliver effectively. Other services, by contrast, require a much lower degree of specific knowledge of industrial (manufacturing) processes.
As noted in Ecorys (2008), typically the combination of the general nature (i.e. lack of client specificity) of network-type services and the associated economies of scale in their provision means that in-house production is usually neither a viable nor a cost-effective option. Moreover, the fact that such services are relatively standard means that a significant level of in-house complementary knowledge (to make effective use of the service) is not normally required. By contrast, though increasingly subject to outsourcing, knowledge-intensive business services typically require the retention of a complementary in-house knowledge base. Meanwhile, operational business services are situated in between these two situations. In this context, the focus of this study is on knowledge-intensive business services, which are characterised by a close relationship to manufacturing production activities, the necessity for a
complementary house knowledge base, and the possibility for firms to decide whether to rely on in-house provision or whether these service inputs are outsourced or offshored.
1.2.2. BROAD CATEGORISATION OF SERVICE–INDUSTRY INTERACTIONS AND PRODUCTIVITY IMPACTS
In general terms, the growth and productivity potential of interactions between service activities and manufacturing production activities – specifically in terms of the contribution of services, in particular KIBS, to the performance of manufacturing – can be considered to be influenced by conditions at three levels:
› Within manufacturing sectors: In general, empirical evidence – comparing both countries and sectors – points to a positive impact on productivity performance in manufacturing industries of the increased use of (external) service inputs. Equally, services – whether externally or internally supplied – are regarded as a means for industry (manufacturing) to extract higher levels of value added within the value chain. On the one hand, services may contribute to raising the efficiency of industrial (manufacturing) activities; on the other hand, specific attention has focused on the role of services – in particular knowledge-intensive services – as vehicles to increase value added in industrial
(manufacturing) activities through the generation of non-physical or intangible capital. Many services used in industries act as a vector for the diffusion of technology and as a catalyst for innovation activities that contribute to productivity improvements in industrial (manufacturing) activities.
› Within service sectors: Factors that enhance access to service inputs, reduce their cost or raise their quality are likely to have an incremental effect on value creation within a value chain. In this respect, productivity gains within service sectors can be expected to create benefits for industrial
(manufacturing) users of service inputs. This indicates the potential importance of the openness and overall functioning of service markets (e.g. in terms of their regulatory environment, competition
conditions, the extent of integration in international markets, and the level of innovation) as factors influencing the growth and productivity potential of manufacturing production activities.
› Interface between services and industry: Beyond conditions at the level of service and industry sectors per se, the growth and productivity potential of interrelationships between service activities and manufacturing production activities depend on the combined ability of service providers and service users within value chains to generate effective service outcomes. In this respect, significant attention in the literature on services covers discussion of issues such as information asymmetries between service providers and users, or the role of users in the co-production of service outcomes. For example, the former may reflect the difficulty that users have in evaluating service quality (both pre-acquisition and during and after service delivery) or that providers have in clearly establishing the service requirements of their clients. The latter reflects the fact that effective delivery of many services requires interaction (‘co-production’) between service providers and clients; the level of interaction is likely to be more pronounced when services are more customised to the specific requirements of clients and where a high degree of mutual understanding is required. These attributes of the service– industry interface indicate the potential importance of factors that increase market transparency (i.e. facilitation of search and matching processes) and enhance the respective capabilities of service providers and users to engage effectively in co-production processes (e.g. ‘learning processes’ through which mutual understanding can be developed, with regard both to the nature of the services to be provided and to the requirements of client organisations).
1.2.3. MANUFACTURING–SERVICE INTERACTION ALONG THE VALUE CHAIN
Industry–services interactions occur throughout industrial value chains, from ‘upstream’ functions (such as R&D and design) through to downstream functions (such as ‘marketing’ and ‘after-sales’ services). The increasing importance of more upstream (‘pre-production intangibles’) and downstream (‘post-production intangibles’) functions is associated with the fact that the (‘post-production phase occupies a less pivotal position in the value chain of manufactured goods than is the case with more service-oriented components (see e.g. Veugelers, 2013, for a recent discussion). The diminution of value creation in the core production phase (e.g. fabrication and assembly activities) reflects a combination of factors, including productivity gains and technology developments that have lowered costs and displaced employment in production activities, and growing (international) competition that has further contributed to driving down prices and reducing margins for physical production outputs. In particular, the pressure on value creation in core production activities has gone hand in hand with the trend that has seen them outsourced and offshored to low-cost suppliers/locations.
At the same time, as a consequence of the pressure on core production processes, many firms have sought to increase value creation and profit margins by focusing on the development of intangible service-related assets in ‘upstream’ and ‘downstream’ value chain activities. In general terms, services can be categorised relative to their position in the value chain:
› Upstream (development) services in the value chain: product conception and innovation activities (e.g. R&D, design and branding), together with the technical development of high value-adding production processes, are increasingly important as a source of competitive advantage. The focus on upstream functions links in with trends towards raising the technological level of products (e.g. high-tech products), increased specialisation of production processes and higher-end market positioning. In
this context, services play a key role in providing the specific scientific, technical and design capabilities necessary to support upstream functions that contribute to raising the value added ‘embedded’ in manufactured products through better product conception and specialised production processing. These include services dedicated to product innovations, such as R&D and engineering and design. For example, Europe is a global leader in independent engineering services providers (ESPs), which strengthen the comparative advantages of related industries. Particularly, the services provided by ESPs and their technological expertise are pivotal for the success of the EU automotive industry in global markets.
› Core (production) services in the value chain: these concern services which are associated most closely and directly to production activities, such as supply management, production and process engineering, and other technical services. They include:
- Services that contribute to improved linkages along the supply chain, for example through
the better functioning of input markets via greater transparency, shortened response times and reduction in transaction costs. These services increase manufacturing companies’ opportunities to exploit comparative advantage even in remote areas, which might lead to a relocation of manufacturing activities from EU to non-EU locations. One striking example is the production of clothing, one of the most globalised industries. Some of the more successful EU companies have become international supply (and value) chain managers, retaining only a remnant of their own production (if at all). Their competitiveness depends greatly on the set-up of efficient, globally coordinated processes, supported by the application of adequate IT tools and agreements on common standards, at least proprietary ones.
- Services for process innovation within companies: generally services in this area contribute
to the competitiveness of European production locations. Disadvantages (such as high input costs) can to some extent be compensated for by increased efficiency, resource saving, and faster or more flexible processes. As an example, the setting-up of highly integrated and sophisticated business operations supported by IT systems requires a qualified staff and experienced consultants. The EU offers a more favourable environment for the establishment of efficient, IT-supported processes than do emerging economies. Service providers can therefore improve manufacturing companies’ opportunities to exploit comparative advantage for EU production locations. However, the relocation of non-core, low value-added manufacturing processes to non-EU locations remains on the agenda.
› Downstream (market) services in the value chain: firms are increasingly using downstream services (e.g. distribution, marketing, pre- and after-sales services) as a means of generating value added by differentiating their products more clearly, enabling greater customisation and more broadly deepening their relationships with customers. The focus on downstream functions is part of the manifestation of the ‘servitisation’ of manufacturing, by which firms increasingly tend to supply hybrid goods and service combinations or service solutions, rather than just providing goods. Often
manufacturing firms derive an increasing proportion of their revenue not from the sale of goods per se, but from the service activities that accompany the goods and that may generate longer-lasting
revenue streams, with higher margins, than the goods themselves. In this context, the range of different service functions that are related to bringing products to market (e.g. logistics, distribution, marketing and pre-sales services) and that ‘support’ and ‘accompany’ goods in the market (e.g.
customer support, maintenance) and even after use (e.g. recovery and recycling) plays an increasingly important role in value generation within manufacturing value chains.
Thus, ‘servitisation’ has the potential to contribute to comparative advantage for the EU-based production of complex, sophisticated products for specific applications and customised solutions. Demand for such comprehensive service packages – related, for example, to the supply of machinery and equipment – is growing strongly worldwide, with new business areas such as contracting and BOT9 gaining in importance. The EU machinery industry is a paradigm for an industry with a notable and growing share of services in output, with its competitiveness driven by a combination of physical goods and services. This supply meets growing client demand for a comprehensive supply of machinery and equipment, together with product lifecycle services.
› Transversal (management & coordination) services: e.g. management and strategy consulting, management-related ICT. In this context, services – ICT-related services, in particular – can play an important role in enabling firms to maintain their competitive position in core production activities by supporting improved production efficiency, lowering production costs and facilitating coordination within complex supply chains and across multiple production locations.
The general point is that industry–service interactions occur throughout the value chain, and at each stage potential choices exist in terms of both (i) whether to provide services ‘in-house’ or to ‘buy in’ services from an external service provider, and (ii) and whether to source services locally or from a ‘foreign’ supplier. Decisions on the choice of service provision may be influenced by overall framework conditions at all levels, which furthermore should not be seen as independent of one another (see next sub-section).
1.2.4. INDUSTRY–SERVICE INTERACTIONS AND FRAMEWORK CONDITIONS
Despite increasing recognition of the importance of industry–service interactions for the (productivity and growth) performance of manufacturing industry, there has to date been very little analysis of the factors (e.g. framework conditions) that influence the efficiency and effectiveness of the interactions between manufacturing and services. To some extent this reflects the difficulty of providing an overarching framework capable of encompassing very heterogeneous service functions that interact with industry in many diverse ways.
Even if the analysis is limited to the KIBS which are deemed to be performance enhancing, there is an absence of studies that focus specifically on their interaction with manufacturing. On the whole, understanding of the role played by KIBS in terms of their contribution to their clients’ innovation behaviour has developed significantly. Initially seen as adopters of technology developed in manufacturing, the role of KIBS as catalysts for innovation among their clients has now been recognised. This has been followed by increasing acknowledgement that KIBS are important as innovators in their own right, both for themselves and on behalf of their clients (Muller and Doloreux, 2007).
9
Build-Operate-Transfer: A form of project finance which traditionally has been applied to large investment projects where manufacturers are reimbursed by revenues earned through the operation of the delivered establishments. Finally ownership is transferred to the client.
More problematic is the spatial dimension of KIBS. To date, relatively little analysis exists concerning the factors determining the location of KIBS; most of the existing analysis has focused on the tendency for KIBS suppliers to be concentrated in major metropolitan areas. In particular, it appears that service providers in major urban areas take advantage of the access that such locations offer to national and (increasingly) international networks and information exchanges. It appears, moreover, that service providers in major urban areas tend to be both more internationalised – indicating a priori a stronger market position – and more innovative. As a consequence, there is a self-reinforcing tendency for KIBS to become more spatially concentrated.
At first glance, the tendency for KIBS to become more spatially concentrated is somewhat counter-intuitive. In particular, the development of information and communication technology that supports the codification of knowledge and its delivery at a distance would a priori be expected to weaken the incentives for KIBS to group together in specific locations. However, there appears to remain an important component of tacit knowledge that is required to use and interface with flows of knowledge supported through ICT technologies. In this respect, the effective delivery of KIBS may nonetheless require proximity between service provider and (manufacturing) user, in order to develop the necessary mutual understanding (i.e. common tacit knowledge). Accordingly, it is understandable for KIBS to cluster in locations that provide access to a high concentration of (actual and potential) clients.
Recently, a number of authors have attempted to analyse the relationship between foreign direct investment (FDI) in services and in manufacturing, either in terms of the presence and size of manufacturing activities as a factor influencing service location decisions, or in terms of the
complementarity between services FDI and manufacturing FDI. For example, Nefussi and Schwellnus (2010) find complementarity between the location of business services and the manufacturing activities of French affiliates abroad, and Meliciani and Savona (2011) find that intermediate demand from the manufacturing sector positively affects domestic specialisation in business services at a regional level. Similarly, Castellani et al. (2012) find that the localisation of FDI investment in business services is positively related to the presence of manufacturing activities, particularly for manufacturing sectors that are intensive users of business services, as is the case for high- and medium-high technology industries. That would suggest that business services that provide services to manufacturing industries tend to locate close to major manufacturing production locations. This finding might have implications in the context of the ‘offshoring’ of manufacturing production and the location of business services that can either relocate accordingly or remain in the respective countries and specialise in the service-intensive parts of the value chain. For example, the textiles industry is a highly internationalised industry which uses services heavily, whereas most of its production occurs outside Europe (see Section 5 for a detailed assessment of the organisation of production in selected industries and countries).
Unfortunately, there is relatively little analysis that has examined the spatial dimension of specific categories of knowledge-intensive services and in relation to the location of manufacturing activities (although there is somewhat more analysis of the locations patterns for R&D functions). In general, it appears that the main factors influencing the location of business services are typical location
determinants, such as general demand, cost advantages, human capital and agglomeration economies. What is missing in this respect is any assessment of whether other framework conditions – specifically regulatory and other restrictions – may impact on FDI (and trade) in business services.
1.3. OVERVIEW OF STUDY
The purpose of the study is to shed light on prevailing services–industry inter-linkages, with the EU as focal area. It will take a quantitative comparative approach and compare trends and developments in the EU with a focus on analysing and describing differences in the evolution of services–industry inter-linkages across EU countries (and partly in terms of the trends of the EU’s major competitors).
In particular, it aims to quantify the relationship between business services and manufacturing sectors and the extent to which this relates to productivity and growth in manufacturing industries. This will be the subject of Sections 2 and 3 of the report. Section 2 furthermore provides an overview of general trends concerning the specialisation patterns in manufacturing and business services over the period 1995–2011 and examines the potentially underlying explanations based on performance indicators such as productivity and unit labour costs. Section 3 takes an econometric approach, investigating the role of business services and the respective inter-linkages with manufacturing performance. In both sections the role of domestic and foreign-sourced business services will be highlighted.
This is followed by Section 4, which provides a novel approach to exploring the value added associated with manufacturing. This approach takes account of all those value added-creating activities along the value chain of a specific country that contribute to the production of a specific manufactured product – or, more generally, to the production of final products worldwide of a specific industry. Thus a specific service activity (e.g. R&D, advertising) of a country can directly and indirectly contribute to the production of the final manufactured product (e.g. a car), which would be considered part of the manufacturing value chain.
However, as indicated above, the interaction of manufacturing and services is a rather complex issue, and not all aspects can be covered by using a purely quantitative approach. The quantitative analysis is complemented, therefore, with a more qualitative, interview-based approach for a selection of six countries and four industries characterised by differences with respect to past developments, their use of domestically and foreign-sourced business services and framework conditions. Specifically, Section 5 highlights cross-country differences in the use and provision of business services in the manufacturing process in a comparative manner. Subsequently, Section 6 focuses on the differences in cross-border flows of business services and potential hindrances and barriers to these flows.
2.
Performance and interdependence of
industries and services
2.1. MANUFACTURING AND SERVICES PERFORMANCE
2.1.1. THE IMPORTANCE OF (BUSINESS) SERVICES IN THE ECONOMIES
Though the focus of this study is the interaction between manufacturing and service sectors – and business services in particular – this section starts with a comparative overview across countries of developments in these two sectors within the total economy (for classification issues, see Box 2.1). It is a well-known fact that the share of manufacturing is declining worldwide (with a few exceptions, such as China and Korea), whereas the share of the service industries is increasing. With respect to the
advanced nations, the manufacturing shares have decreased, whereas the shares of business services have increased, as shown in Table 2.1. The shares of the other service sectors remained more or less stable.
Table 2.1 / Shares of manufacturing and services in total GDP, as a percentage
Manufacturing Distribution
Transport and
communication Business services Non-market services 1995 2011 1995 2011 1995 2011 1995 2011 1995 2011 EU-27 20.1 15.8 28.3 29.7 6.7 6.8 14.3 17.9 18.0 18.8 USA 15.5 12.3 32.3 30.3 6.1 5.2 17.8 23.1 19.6 20.8 Japan 22.6 18.6 32.7 33.8 6.6 6.5 11.7 13.2 13.7 18.3 Austria 19.6 18.5 28.9 31.8 7.6 6.0 11.8 14.8 18.4 17.2 Belgium 20.3 14.5 26.4 26.5 8.2 7.7 15.7 20.5 19.8 22.3 Bulgaria 22.0 17.6 25.3 27.7 6.6 11.5 10.4 9.1 9.9 13.5 Cyprus 11.8 6.8 37.6 37.5 8.0 7.4 9.9 14.7 16.9 20.7 Czech Republic 24.3 25.8 23.7 21.2 10.4 10.2 9.6 14.0 13.0 14.3 Denmark 17.1 11.5 29.7 28.9 7.6 7.4 11.8 15.7 22.4 24.3 Estonia 21.0 14.3 28.2 28.6 11.2 11.0 7.0 14.0 14.8 17.4 Finland 25.4 18.6 24.6 28.2 9.1 7.8 9.4 12.7 19.2 20.2 France 14.2 10.1 28.1 31.3 6.3 6.6 16.9 19.6 20.7 22.4 Germany 22.6 22.4 28.4 28.3 5.7 5.5 15.2 17.8 17.3 17.8 Greece 12.0 10.3 38.7 39.7 5.9 9.5 7.8 8.9 17.1 21.0 Hungary 21.3 25.3 24.6 24.6 7.6 7.2 11.6 14.0 18.7 16.3 Ireland 30.2 26.8 18.9 19.3 5.5 5.3 13.6 21.8 17.0 19.1 Italy 22.2 16.6 31.9 33.6 7.0 7.3 11.7 14.9 15.8 17.4 Latvia 20.7 9.9 20.3 32.7 14.5 11.4 8.8 14.9 16.9 17.1 Lithuania 19.1 16.4 28.6 29.8 8.4 13.8 3.7 8.2 16.8 18.0 Luxembourg 13.7 6.5 26.8 25.0 8.2 8.7 28.7 38.6 13.5 14.3 Malta 21.7 13.3 32.9 34.0 9.2 9.2 9.8 15.8 16.8 19.4 Netherlands 17.4 14.1 25.5 24.8 6.9 6.0 16.7 20.7 20.0 22.0 Poland 21.1 18.1 29.6 31.8 6.3 7.2 6.4 11.0 14.5 14.4 Portugal 18.4 13.4 27.7 29.8 6.5 6.9 12.4 15.3 19.3 22.8 Romania 25.6 23.6 19.8 24.5 6.7 10.5 9.8 7.7 6.1 11.9 Slovak Republic 26.8 19.6 24.4 27.3 10.5 7.1 9.3 12.7 12.1 13.9 Slovenia 25.7 19.6 25.8 26.3 6.8 7.2 11.9 15.3 16.0 17.7 Spain 19.2 13.2 30.8 33.6 7.1 7.2 10.5 13.0 16.4 18.3 Sweden 22.4 16.7 26.6 26.1 7.9 7.0 11.8 16.8 20.2 21.1 United Kingdom 20.9 11.7 25.7 28.1 7.7 6.8 16.6 25.5 17.5 16.6 Note: These figures are based on value added at basic prices as provided in the World Input-Output Tables (WIOT). Source: WIOD; wiiw calculations.