Lying about intentions
Lara Natasja Warmelink
May 2012
The thesis is submitted in partial fulfilment of the requirements for the award of the degree of Doctor of Philosophy of the University of Portsmouth.
I would like to dedicate my thesis to my grandmothers.
To mrs. Warmelink-Minkjan, in the hope she will enjoy reading the fruits of my labour and to mrs. Grovenstein-Tijsma, who will now not be able to.
Before the throne of the Almighty, man will be judged not by his acts but by his intentions. For God alone reads our hearts. (Mohandas Karamchand Gandhi)
Abstract
This thesis aims to explore whether lying about intentions can be detected using the same methods that are used to detect other types of lie. Part I, the introduction, contains a literature review of research into future thinking and intentions.
In Part II non-verbal cues and thermal imaging are investigated as cues to deception. In Experiment 1 participants of twelve different ethnicities were
interviewed at an airport about their forthcoming trip. Half of the participants were instructed to answer truthfully, the other half to answer deceptively. The
participants’ veracity affected only three of the 17 non-verbal cues: struggling, thinking hard and controlling behaviour. These cues were reduced to two factors, cognitive load and animation. These two factors could correctly classify 52.3% of truth tellers and 62.6% of liars. The thermal imaging showed that liars tended to get warmer during the interview, while the truth tellers’ temperatures remained constant. This temperature rise was a cue to deception at above chance rates.
In Part III two experiments are described, investigating verbal cues to deceit in longer and shorter interviews. In Experiment 2 participants were interviewed, answering truthfully or deceptively, about a forthcoming trip. The interview
contained general questions that were expected by the participants and three types of unexpected questions. Half of the participants had been to the travel destination previously, while the other half had not been there. The results showed that truth tellers generated more details on the unexpected questions than liars, while liars provided more details on expected questions than truth tellers. This pattern was more pronounced with participants who had been to their travel destination before than for
those who had never been to that destination. A positive predictive value of .69 (truth) and a negative predictive value of .75 (lie) were obtained. Experiment 3 investigated verbal cues to deceit in a short one question interview about a
forthcoming trip. The interview question was asked in two forms, one prompting for time detail and one control. The results showed that truth tellers and those answering the time prompting question were more likely to provide temporal information. The results showed that 47.6% of truth tellers and 81% of liars could be classified correctly on the basis of the time prompt question.
Part IV investigated reaction times as a cue to deception. In Experiment 4, participants were asked to perform a mission, either immediately or two weeks later. Half of the participants was instructed to answer any questions asked by
experimenters en route truthfully, the other half was asked to answer deceptively. Using a computer, participants classified adjectives as positive or negative and were primed by words related to the real intention of truth tellers (to buy a present), which was also the cover story for liars. Contrary to the hypothesis, in the immediate condition liars answered faster on positive than negative adjectives, while the truth tellers responded equally fast to both adjectives. In the delayed condition no difference was found between truth tellers and liars.
Part V presents the general discussion. The main findings of the thesis are summarised, practical and theoretical implications are discussed, the methodological and ethical limitations are considered and ideas for future research are given.
Overall, the conclusion of the thesis is that false intentions contain cues to deceit that observers should be able to spot.
Contents Abstract 3 Contents 5 Declaration 10 List of Tables 11 List of Figures 13 List of Abbreviations 14 Acknowledgements 15 Dissemination 16
Part I: Introduction and Literature Review 17
Chapter 1:Introduction to Thesis 17
Introduction. Thesis outline.
17 19 Chapter 2: Episodic Future Thought Literature Review 22
Intention and mental time travel. 22
The clarity and level of detail of the mental image. 23 Intentions and non-intended future thought. 25 Part II: Non-Verbal Behaviour and Thermal Imaging as Lie Detection
Cues
27
Chapter 3: the Method for Experiment 1 and the Questionnaire Results of Experiment 1
27
Method. 30
Participants. 30
Design. 30
Questionnaire results. 34
Questionnaire discussion. 35
Chapter 4: Non-verbal Behaviour as a Lie Detection Tool 36
Method. 42
Dependent variables. 42
Coding and reliability coding. 43
Data analysis. 45 Results. 46 Multivariate. 46 Univariate. 46 Factor analysis. 53 Discussion 57 Phase. 57 Veracity. 58 Ethnicity. 59 English. 60 Factor analysis. 61
Limitations of using non-verbal cues to lying in an airport situation.
62
Chapter 5: Thermal Imaging as a Lie Detection Tool 64
Introduction. 64
Method. 67
Participants. 67
Thermal imaging coding. 67
Dependent variables. 69
Results. 70
Mean skin temperatures as a function of veracity.
70
Truth – Lie Classifications, Between-Subjects Analyses.
71
Truth – Lie Classifications, Within-Subjects Analyses.
73
Discussion. 76
Thermal Imaging Results. 76
Interviewers’ Assessments. 77
Issues to Consider. 79
The Practical Application of Thermal Imaging. 83 Part III: Verbal Cues. The Effect of Interviewees’ Previous Experience
and Time Prompting
84
Chapter 6: Using Verbal Cues to Detect Deception Literature Review
84
Chapter 7: Experiment 2. The Effect of the Interviewees’ Previous Experience 92 Method. 96 Participants. 96 Design. 96 Procedure. 98 Data analysis. 100 Results. 102
Expectedness of the questions. 102
Questionnaire results. 103
Interview content. 104
Discussion. 113
Chapter 8: Experiment 3. The Effect of Time Prompting 119
Method. 121 Participants. 121 Design. 121 Procedure. 121 Data analysis. 123 Results. 123 Discussion. 124
Part IV: The Effect of True and False Intentions on Reaction Times 127 Chapter 9: Detecting Lies about Intentions Using a Lexical
Decision Reaction Time Task
127 Method. 131 Participants. 131 Design. 132 Procedure. 133 Materials. 135 Data analysis. 137 Results. 138 Discussion. 141
Part V: General discussion 144
Summary of findings. 144 Theoretical implications. 146 Practical implications. 149 Limitations. 151 Methodological considerations. 151 Ethical considerations. 153 Future Research. 155 Conclusion. 158 References 160 Appendix 1 174
Declaration.
Whilst registered for the above degree, I have not been registered for any other research award. The results and conclusions embodied in this thesis are the work of the named candidate and have not been submitted for any other academic award.
List of tables
3.1 The mean (SD) of difficulty per phase. 35
4.1 The correlation between the first and the second coder. 45 4.2 The means (and standard errors) for Ethnicity on those variables
where Ethnicity had a significant effect.
49
4.3 The means (and standard errors) for English on the variables where English had a significant effect.
51
4.4 The means (and standard errors) for Phase. 52 4.5 The six components with eigenvalues over 1 extracted from the
factor analysis.
54
4.6 The means and (SD) of Ethnicity for the animation factor. 55
5.1 Skin Temperature as a Function of Phase. 71
5.2 Area under the ROC Curves and Related Statistics and Discriminant Analyses Regarding Truth/Lie Classifications.
75
6.1 The CBCA Criteria. 86
6.2 The scales of the JMCQ. 89
7.1 The correlation between the first and the second coder. 102 7.2 The three significant multivariate effects for those variables with a
significant three way interaction effect.
105
7.3 The mean and (SD) of the amount of total details per questions category, experience level and veracity.
106
7.4 The mean and (SD) of the amount of visual details per questions category, experience level and veracity.
107
7.5 The mean and (SD) of the amount of spatial details per questions category, experience level and veracity.
7.6 The mean and (SD) of the amount of temporal details per questions category, experience level and veracity.
110
7.7 The mean and (SD) of the amount of explanations per questions category, veracity and experience level.
111
7.8 The three way interaction effects for the 12 variables where this effect was non-significant.
112
8.1 The percentage of participants from each condition that did or did not mention a time in their answers.
124
9.1 The stimulus words used in the adjective classification task. The mean (and SD) of the participants’ rating of the primes is listed.
List of Figures
5.1 An example of artefacted data. 69
5.2 Skin temperature as a function of phase 76
List of Abbreviations Abbreviation Full term
ACID Assessment Criteria Indicative of Deception ANOVA Analysis of Variance
AUC Area Under the Curve
CBCA Criteria Based Content Analysis CIT Concealed Information Test EEG Electroencephalograms
fMRI functional Magnetic Resonance Imaging IAT Implicit Association Test
JMCQ Judgement of Memory Characteristics Questionnaire
M Mean
MANOVA Multivariate analysis of variance MCQ Memory Characteristics Questionnaire MEG Magneto Encephalograms
RM Reality Monitoring
ROC Receiver Operating Characteristic SCAN Scientific Content Analysis
SD Standard Deviation
SUE Strategic use of Evidence SVA Statement Validity Assessment
Acknowledgements.
Many people have helped me while working on this thesis and I am grateful to all of them. I would especially like to thank my supervisors. First and foremost, I want to acknowledge Professor Vrij, my first supervisor, for all his help and advice. Bedankt Aldert, voor alle hulp en tips van statistiek tot hoe om te gaan met Engelsen. I would like to thank Dr. Mann, my second supervisor, for all the practical help she gave me, ta Sam. Also, thanks to my third supervisor, Professor Granhag of the University of Gothenburg, for keeping a wide view and an open mind, tack för all din hjälp med min avhandling.
I’d like to thank Kalle Ask and Melanie Knieps, also from the University of Gothenburg, for allowing me to use their unpublished work. My gratitude extends to Sharon Leal, who gave me much sound advice.
I want to thank the technicians and administration staff at the department of psychology at the University of Portsmouth, particularly Dave Forrester, who assisted greatly in Experiment 1 and Tina Harding, who has helped me on numerous occasions. In addition, I’m grateful to my colleagues for all their help and support: Dr. Jackie Hillman, Dr. Gary Lancaster, Shyma Jundi, Dom Shaw, Zarah Vernham, Sarah Rohlfing, Dr. Sabine Quandte, Gemma Graham, Dr. Victoria Devonshire, Ailsa Millen, Vivian Lago, Jo Fraser, Ed Agobiani and Isolde Sommer.
Finally, I’d like to thank my family for their emotional support. Especially, my mother, Sophia Grovenstein, my father, Bert Warmelink, his wife, Pia Teeuw and my siblings, Rosa, Niklas and Vera.
Dissemination. Articles.
Warmelink, L., Vrij, A., Mann, S., Leal, S., Forrester, D., Fisher, R.P. (2011). Thermal imaging as a lie detection tool at airports. Law and Human Behaviour, 35, 1, 40-48 DOI: 10.1007/s10979-010-9251-3
Warmelink, L. Vrij, A., Mann, S., Jundi, S., & Granhag P.A. (in press). The effect of question expectedness and experience on lying about intentions. Acta
Psychologica.
Warmelink, L. Vrij, A., Mann, S., & Granhag P.A. (under review). Temporal details in intentions: A cue to detecting deception. Applied Cognitive Psychology.
Conference presentations.
Warmelink, L., Vrij, A., Mann, S. & Granhg, P.A. (2011, June). Is it harder to catch a liar who knows what he’s lying about? Presented at Division of Forensic Psychology conference, Portsmouth UK
Warmelink, L., Granhag, P.A., Jundi, S., Mann, S.A. & Vrij, A. (2011, June). The effect of previous experience on lying about intentions. Presented at SARMAC conference IX, New York, USA
Warmelink, L., Vrij, A., mann, S., & Granhag, P.A. (2012, April). Detecting lies about intentions using reaction times. Presented at EAPL conference, Nicosia, Cyprus
Part I: Introduction and Literature Review Chapter 1: Introduction to Thesis
Introduction.
The subject of this thesis is lying about intentions. The aim is to explore whether lies about intentions can be detected using the same techniques that are used to detect lies about past events or opinions, and how detection rates can be
maximised. Previous research, which focuses on lying about past events and opinions, has found that people in general are not very good at detecting lies. Bond and DePaulo (2006) and Vrij (2008) found that laypeople could on average detect 54% of truths and lies. Professional lie catchers were not much better at 55%. Many tools and methods have been developed to improve these detection rates, including physiological methods, non-verbal behavior analysis, statement content analysis and reaction time analysis.
Physiological lie detection uses intricate tools and equipment to monitor the body’s activity for cues associated with deception. Polygraphs take several measures including heart rate, breathing rate and sweating (Ben-Shakhar & Elaad, 2003). The temperature often participant is measured with thermal camera’s (Pavlidis,
Eberhardt, , & Levine, 2002). Electroencephalograms (EEG) (Farwell & Donchin, 1991), functional Magnetic Resonance Imaging (fMRI) (Spence, Farrow, Herford, Wilkinson, Zheng & Woodruff, 2001) and Magneto Encephalograms (MEG) (Seth, Iversen & Edelman, 2006) are used to measure the activity of the brain. The n on-verbal behaviour of the subject has also been analysed as a cue to deception. This is a technique used not only used by professionals, but also sometimes by laypeople (Akehurst, Köhnken, Vrij & Bull, 1996), and it has been studied extensively by scholars (Bond & DePaulo, 2006; DePaulo et al., 2003; Zuckerman, DePaulo and
Rosenthal, 1981). Other methods have focused on the content of the statement, such as Statement Validity Assessment (SVA) (Köhnken, 2004; Masip, Sporer, Garrido, & Herrero, 2005; Vrij, 2005) or Reality Monitoring (Sporer, 2004). Another
technique is to measure the response time to truth- or lie-related stimuli. Truth related stimuli usually elicit a shorter response time, probably because humans show an orienting reflex to familiar stimuli and the truth is often more familiar than the lie (Johnson, Barnhardt & Zhu, 2003; Verschuere, Spruyt, Meijer & Otgaar, 2010). These different techniques all improve lie accuracy rates compared to not using them. These accuracy rates are also above chance level, ranging between 60 and 90%, the accuracy rates for the different techniques vary substantially (Vrij, 2008). Each method has its own strengths and weaknesses. In this thesis, I will examine a range of these methods: nonverbal behaviour, the temperature of the speaker, the speech content, and reaction times, and will examine the utility of each when used to detect lies about intentions.
Lying about intentions is a relatively new subject in lie detection (Granhag, 2010). Detecting lies about intentions is at least as important as detecting lies about past activities. Detecting lies about past activities might help law enforcement officers solve crimes that have already taken place, but detecting lies about intentions might help intelligence and security services prevent crimes from ever happening. One area of law enforcement that would benefit from detecting lies about intentions is border control and transportation security. The main goal for these systems is to let people without criminal intent pass through as quickly as possible while detaining those with criminal intentions (Burgoon et al., 2009).
because past event are definite and knowable, even if they are currently unknown. In contrast, intentions are in the future and therefore not definite or knowable. Even if someone intends to do something, it does not necessarily mean that they will execute their intentions. This means that even if someone tells the truth about their intentions they still know that their intended actions might not happen and those who lie about their intentions might feel that they are not truly lying, since even if they do not intend to execute their false intention, it is possible that in fact they will do so. This creates a grey area between truth and lie that may be detrimental to differentiating truth tellers from liars. This thesis is an attempt to study whether it is possible to differentiate between truth tellers and liars when they are discussing their intentions.
Thesis outline.
This thesis contains the following 5 parts.
Part I: Introduction and Literature Review.
Part I contains Chapters 1 and 2. In Chapter 1 the entire thesis is introduced, sets its aims and contains the thesis outline. Chapter 2 is a literature review on
episodic future thought and mental time travel. It discusses previous research on how people imagine the future, and the similarities and differences between that and remembering the past. It also discusses intentions and how they differ from other types of future thought.
Part II: Non-Verbal Behaviour and Thermal Imaging as Lie Detection Cues.
Part II contains Chapters 3, 4 and 5. Experiment 1 is described, which investigated several different non verbal cues to lying about intentions in an airport.
In Chapter 3 the experimental method is described and the results from the
questionnaire used in Experiment 1. In Chapter 4 non-verbal behaviour is introduced as a cue to lie detection. Those parts of the method of Experiment 1 that are specific to the non-verbal behaviour cues are described, together with the results and a discussion of those results. In Chapter 5 thermal imaging is introduced as a lie detection cue. Those parts of the method of Experiment 1 that are specific to the thermal imaging technique are described, and the results of the experiment relating to the thermal imaging are reported and discussed along with a discussion of the potential of thermal imaging as a lie detection tool in an airport setting. A modified version of Chapter 5 was published as Warmelink, L., Vrij, A., Mann, S., Leal, S., Forrester, D., Fisher, R.P. (2011). Thermal imaging as a lie detection tool at airports. Law and Human Behaviour, 35, 1, 40-48 (see Appendix 1).
Part III: Verbal Cues. The Effect of Interviewees’ Previous Experience and Time Prompting.
In Part III the effectiveness of interviewing participants and using the content of their answers as a cue to detect deceit, is investigated. Part III contains Chapters 6, 7 and 8 and describes two experiments. Chapter 6 contains a literature overview of how interviewing can be used to detect lies about past events, opinions and
intentions. In Chapter 7 Experiment 2 is described. It tests whether truthful and lying interviewees who have previously experienced executing the intention they are describing, talk about the intention in more detail than truth tellers and liars who have never executed the intention they are discussing. In Chapter 8 Experiment 3 is described, which also focuses on detail. It is investigates whether the phrasing used in interview questions influences how much temporal detail is given.
Part IV: The Effect of True and False Intentions on Reaction Times.
Part IV contains only Chapter 9 and Experiment 4. The fourth experiment tests the reaction times of participants with a truthful or a false intention. In the experiment participants did a priming task to elicit their intentions. The goal of the study is to investigate whether those with a true intention respond differently from those with false intentions.
Part V: General Discussion.
The fifth and final Part contains Chapter 10. It contains an overview of the main findings of the thesis. In it the practical and theoretical implications of the findings, the methodological and ethical limitations of the thesis and ideas on possible future research are discussed. It ends with a final conclusion.
Chapter 2: Episodic Future Thought Literature Review
Intentions and mental time travel.
In order to investigate and detect lies about intentions we need an
understanding of what a true intention is like. Humans often think about the future (D’Argembeau, Renaud & Van der Linden, 2011). Sometimes people purposefully imagine the future, sometimes these thought are triggered by an environmental or internal cue (Berntsen & Jacobsen, 2008). Not all of these thoughts are intentions. Intentions are defined as an agent’s mental state that represents an action that is done on purpose (intentionally) (Malle, Moses & Baldwin, 2001). It is important to
distinguish between desires and intentions. When someone has a desire, they have not decided that they will take action to make the desire become reality. Whereas when someone has an intention they have decided to perform an action (Malle & Knobe, 2001). For this thesis intentions are defined as future actions that someone is committed to executing and of which that person has an image of how and in which situation they will be executed (Granhag, 2010; Goschke & Kuhl, 1993).
Humans have the ability to imagine themselves in past or future situations. This ability is known as mental time travel (Suddendorf & Corballis, 1997). This mental time travelling involves imagining the self into the event and “mentally experiencing” it. Remembering a past event in this way is known as episodic memory and imagining oneself into a future event is known as episodic future thought (Atance & O’Neill, 2001, 2005; Szpunar, 2010). It has been proposed that mental time travel into the past and into the future relate to each other closely
(D’Argembeau & van der Linden, 2006). This theory has been supported by findings that imagining the future and remembering the past rely, both neurophysiologically
is provided by studies of patients with severe amnesia, who were found to have trouble engaging in episodic future thought, as well as having problems with episodic memory (Schacter, Addis & Buckner, 2008). More support is found in neuroimaging studies, which led Schacter and colleagues to propose a “core system” of brain regions (the medial prefrontal cortex, the medial temporal lobe, the
precuneus/retrosplenial cortex, the lateral parietal cortex and the lateral temporal cortex), which mediate mental time travel into both the past and the future (Schacter, Addis & Buckner 2007). This core system would be responsible for taking elements of memories and using them as the building blocks to reconstruct memories of past events and to construct images of future events.
The clarity and level of detail of the mental image.
Johnson and her colleagues developed the Memory Characteristics
Questionnaire, in which participants could rate their memories for clarity and level of detail (Johnson, 1988; Johnson et al., 1988). This questionnaire has been
successfully adapted for participants to report on mental images of future events (D’Argembeau and Van der Linden, 2004; 2006). Research using the questionnaires has shown that differences in clarity and detail depend on the participant and on the content of the image. For example, D’Argembeau and Van der Linden (2006) found that people who score higher on the Vividness of Visual Imagery Questionnaire, which measures how vivid their visual images are in general, also report more clear and detailed future images. This indicates that the ability to imagine detailed future images is related to the ability to imagine other detailed images. The content of the image also affects the self-reported clarity, D’Argembeau and van der Linden (2004) found that positive events both in the past and in the future are more detailed than negative events, according to self-reports. Also events that are closer in time to the
moment of reporting are more detailed than events that are further ahead in the future or further back in the past. Arzy, Adi-japha and Blanke (2009) found evidence that mental time travel is not done instantaneously. Participants take longer to respond to questions about events that are longer before or after a specified time. In other words, events that require mentally time travelling further. This indicates that when they mentally time travelled between two points they mentally passed through the time in between.
Gamboz, Brandimonte and De Vito (2010) found that the familiarity of a future image affected the clarity of the image. The participants’ self reports indicated that images of unfamiliar events were less clear on spatial and temporal information than past events, but there was no difference between past events and future events that were familiar. Szpunar and McDermott (2008) found similar results. Future events that took place in surroundings the participants knew (e.g. their home) were rated by the participants as clearer and as more detailed than future events in novel surroundings (e.g. a jungle). They also found that when people based their future image on a familiar setting, they reported the image as more clear and detailed when they had experienced that setting recently compared to settings they had experienced long ago. Szpunar, Chan and McDermott (2009) also found differences on an fMRI between imagining a familiar future and an unfamiliar one. Certain brain areas (the superior occipital gyrus and the posterior cingulate and parahippocampal cortices) were only active during remembering the past and imagining a future that was set in a familiar context. When imagining a future event in an unfamiliar context these brain regions were no longer active. They suggest that this means that these brain regions are used to imagine the familiar surroundings in which events are set,
These studies suggest that it matters little whether someone time travels to the past or to the future. What matters is whether someone has suitable memories to base an episodic future thought on and how to use that episodic memory to
reconstruct new images. However, both D’Argembeau and Van der Linden (2004) and Gamboz, Brandimonte and De Vito (2010) found that images of past events were more detailed than images of future events, which suggests that episodic future thinking is not as easy as remembering. Overall, the results suggest that
remembering past events and imagining the future are closely related, but not entirely the same.
Intentions and non-intended future thought.
Intentions are a type of episodic future thought, but are different from
ordinary future images in the sense that intentions require the commitment to execute the action in order to create the desired end goal. The human mind seems to prioritise intentions and intention related stimuli over other future related stimuli. Goschke and Kuhl (1993) found that participants respond faster to stimuli that are related to an intention than to stimuli that are related to a future image that will not be executed. This effect is known as the intention superiority effect. Goschke and Kuhl (1993) suggested that the effect is caused by a higher sub-threshold level of activation of the intention in long-term memory. Long term memory can be envisioned as a network of nodes that can be active or not and can spread their activation to other nodes. The activation of a node can cause an action, or can make the content of the node reach consciousness (be remembered). Goschke and Kuhl (1993) suggest that when an intention is not present in consciousness, its node remains active, but not active enough to reach consciousness. This sub-threshold activation means that less extra
remembered. This makes it more likely that an intention will be remembered if related nodes become active and the intention node will become active faster than other nodes in the presence of related activity. Marsh, Hicks and Bryan (1999) have suggested that this heightened activation helps with remembering the intention and executing it. In fact, Watanabe (2005) found that more intentions than unintended future actions are remembered.
Several researchers investigated the intentions superiority effect. Dockree and Ellis (2001) found that when intentions are cancelled, so the action no longer has to be performed, they no longer cause the intention superiority effect on a lexical decision task. They also found that the participants did not show an intention superiority effect when they expected that they would have written instructions for the task with them when they performed the task. Presumably the written
instructions negated the need for memorising the task and with it the need to keep the intention at high activation disappeared. Marsh and colleagues found that
completed and cancelled intentions lack an intention superiority effect, in fact stimuli related to cancelled or completed tasks elicited significantly slower reaction times than neutral stimuli (Marsh, Hicks & Bryan, 1999; Marsh, Hicks & Bink, 1998). They suggest that cancelled and completed intentions are actively inhibited, to prevent intentions that no longer need to be executed from interfering with the current task. The theory that intentions are held in higher sub-threshold activation is supported by the finding that intentions related words are harder to ignore then neutral words. Marsh, Cook, Meeks, Clark-Foos and Hicks (2007) asked participants to respond to visual cues, while listening to an auditory stream of neutral or intention –related words, which they were asked to ignore. The results showed that the
intention related words in the audio stream were remembered better than the neutral words by the participants.
When someone is lying about their intentions, instead of reporting their true intention, they discuss another future event which they do not intend to create or execute. This future event can be a detailed visual image or a simple thought with no imagery attached (Granhag & Knieps, 2011). This chapter has outlined what these concepts mean and how they differ from each other. Both intentions and unintended future thoughts are constructed from different elements of memories. But intentions have a special priority in the mind. Intentions affect certain experimental tasks, such as reaction times test or memory tests more than other future thoughts. The
differences between them could be the beginning of a way to detect lies about intentions. Measuring reaction times, the verbal and non-verbal behaviour of
participants discussing intentions and unintended future thoughts might yield cues to classifying statements as real intentions or false intentions. In the next chapter we will start by looking at verbal and non-verbal cues in behaviour.
Part II: Non-Verbal Behaviour and Thermal Imaging as Lie Detection Cues
Chapter 3: the Method for Experiment 1 and the Questionnaire Results of Experiment 1
Part II of this thesis contains three chapters and the first experiment, which investigates several non-verbal cues and thermal imaging as indicators of deception. In Chapter Three the method of Experiment 1 is described and the results from the questionnaire part of the experiment are reported. In Chapter Four the non-verbal cues that were investigated are discussed. The non-verbal cues will be introduced, the parts of the method specific to these cues will be discussed and the results will be reported and discussed. In Chapter Five thermal imaging is discussed and it contains an introduction to thermal imaging, the specific thermal imaging method, the results and a discussion of the method and its practical use.
The cues to deceit that are the focus of this experiment are based on three different theoretical approaches. The first is that liars are more aroused or more nervous than truth tellers. The second is that lying is more cognitively demanding than telling the truth. The third approach is that liars attempt to control their behaviour more than truth tellers in order to appear truthful (Vrij, Fisher, Mann & Leal, 2006; Hartwig, Granhag and Strömwall, 2007; Vrij, 2008).
Experiment One was conducted at a large, international airport. This allowed us to interview people from all over the world. Psychology research often relies on participants from the same area as the researchers. These participants do not
represent mankind as a whole very well, in fact they have been described as WEIRD (Western, Educated, Industrialised, Rich and Democratic, Henrich, Heine &
Norenzayan, 2010). These participants often show traits or responses that might not extend to the general public. In order to get a wider spread of participants, we recruited participants from 12 different regions of the world: Northern European, Eastern European, South West European, South East European, East Asian, South East Asian, Central Asian, Iranian, Arabic, South American, West African and East African. In order to be considered part of a region a participant would have to be: a national of one of the countries in that region, have lived there for an extended period and not be a recent immigrant from a country from a different region. The participant could
currently be living out of the region. No North American region was included, because its population consist in large parts of recent immigrants and many people identify both with their country of origin and their “new” country. We were worried this would complicate the classification. In this thesis the twelve regions are called ethnicities. We also scored each participant on how well they spoke English.
The interview had five phases: ‘general’, ‘destination plans and past’, ‘plans on plane’, ‘reassurance’ and ‘lie’. The questions were always asked in this order and concerned, respectively: factual information about the trip; detailed information about the destination and past actions concerning the trip; information on what the participant will do on the plane; any extra information the participant can give to reassure the interviewer they are telling the truth and in the lie phase all participants were asked to lie about their plans at their destination, regardless of whether they had been lying before. It was hypothesised that overall the liars would find the interview harder than truth tellers. When examining this per stage, it was hypothesised that liars would find the first four phases harder than truth tellers, but that truth tellers would find the final ‘lie’ phase harder than liars, because they had to switch from truth telling to lying, whereas liars could continue lying.
Method.
Participants.
Four hundred and eighty one participants were recruited at a major airport, 17 participants were excluded from the analysis, because they did not follow the
instructions completely. There were 331 (68.8%) men, 142 (29.6%) women and 8 participants did not answer this question on the questionnaire. Their age ranged from 16 to 75 with an average of 35 years (SD = 12.5). Two hundred and seven
participants were going home (44 %). One hundred and eight were visiting friends or family (23%). Ninety-two participants (20%) were going on work or study related trips, e.g. travelling to their workplace, on business trips or going to a conference. Fifty-four (12%) were going on holiday. Two participants were going for medical reasons (0.4%).
Design.
Independent variables.
The experiment has a 2 by 12 by 5 factorial design. The first factor, Veracity, is a between-subject factor and has two levels: named truth telling and lying (both groups did the other task on one question). The second factor, Ethnicity, is also a between-subjects factor and has 12 levels (N = 40 for all groups, except West African, N = 39) and East African, N = 41):
-‐ Northern European, e.g. Swedish -‐ Eastern European, e.g. Russian -‐ South West European, e.g. Spanish -‐ South East European, e.g. Greek -‐ Central Asian, e.g. Indian
-‐ South East Asian. E.g. Malaysian -‐ Iranian
-‐ Arabian, e.g. Kuwaiti
-‐ South American, e.g. Brazilian -‐ West African, e.g. Nigerian
-‐ East African, e.g. Somalian, Kenyan
The third factor, Phase, is a within subjects factor and has five levels, representing the five different phases of the interview. The first phase, general, contains questions 2 and 3 of the interview, these questions are just general
information questions (e.g. “What would you say is the main purpose of your trip?”). The second phase, destination plans and past, contains questions 4 to 9. This phase is mostly dedicated to getting a detailed description of what the participant is going to do (e.g. “What are you going to do when you get off the plane?”). The third phase, plans on plane, contains questions 10 and 11. These questions ask what the
participant plans to do on the plan (e.g. “What are you going to do on the plane?”). The fourth phase, reassurance, contains questions 12 to 16 and asks the participants for different types of information that could confirm that they are telling the truth (e.g. “Is there any information you can give to reassure me you are telling me the truth about your trip?”). The fifth phase, lie, contains question 17. This question asks what the participants are going to do on the day they arrive at their destination, but this time all participants have to answer deceptively. As a consequence, participants who were telling the truth must make up a lie. Participants who were already lying should think of a second lie, because if they repeat their original lie it will become clear to the interviewer that it was a lie. Question 1, “Where are you flying to?”, does not belong to any of the phases and all participants were instructed to answer it
truthfully. Hence, it was used as a baseline in the thermal part of the experiment, in which the interview therefore consists of six phases. The complete list of questions is confidential for security reasons and we are not allowed to publish it in full.
Dependent variables deriving from the questionnaire.
There were five dependent variables based on the questionnaire: the difficulty score for each of the five phases. The participants received a list of all questions and to indicate whether each was difficult (1) or not (0). The difficulty score of each phase was calculated per participant by averaging the dichotomous scores for each question in that phase. This compensated for the fact that some phases contained more questions than others. The resulting score indicated the proportion of questions in that category that were rated as difficult.
Procedure.
The experiment took place airside in the departure hall of a large
international airport. One of the experimenters approached passengers after they had come through security and said that he was looking for volunteers to participate in an experiment that involved being interviewed about their travel plans and that they could earn £10 by taking part. He told them that the experiment would take 20 minutes and that the interviews would be video recorded. An estimated 40% of the participants agreed to take part. Passengers who did not take part gave good reasons for not doing so: They were busy (had work or shopping to do), travelled with more people or had to catch their flight. The reasonably high response rate may have been a combination of an official looking experimenter combined with the opportunity to earn money whilst serving a good cause (scientific research that could be used to
enhance security at airports). The fact that most people in a departure hall have little else to do besides waiting for their flight might also have helped.
The participants were first asked the following two questions:
- (1) Where are you going to fly to today?
- (2) How would you describe the main purpose of your trip?
These questions were asked to establish the ground truth in the experiment. All participants (truth tellers and liars) were asked to reveal their true destination during the actual interview, and truth tellers were also asked to reveal the true purpose of their trip, while the liars were asked to lie about the purpose of their trip. These data show that, in their interview, all interviewees honestly reported their destination, and that all truth tellers honestly reported the true purpose of their trip. All liars truthfully reported their destination but lied about the purpose.
The experimenter continued: “My colleague will ask you a few questions about your forthcoming trip. Some people will be asked to tell the truth whereas others will be asked to lie during these interviews. My colleague, who does not know who is lying or telling the truth, will make a veracity judgement at the end of the interview.” The participants were allocated randomly to the truth/lie condition. Half of the passengers were requested to tell the truth while answering every single question during the interview, whereas the other half were asked to tell the truth about the destination they were flying to but lie about the purpose of the trip. The experimenter then asked the participants whether they needed preparation time. If the participant expressed a need to prepare (only two passengers, both liars, did), the experimenter gave them as much time as they wanted by asking them to return when they were ready to be interviewed, at which point the experimenter took the
participant to one of the two female interviewers. The interviewer introduced herself, invited the participant to take a seat, and conducted the interview.
The interview was recorded with a video camera and a thermal imaging camera; the distance between the cameras and participant was approximately three metres. After the interview, the participant completed a questionnaire. The
questionnaire asked for demographic information and, for each question, whether the participant found the question easy or hard to answer. After that they received £ 10.
Questionnaire results.
A 2 (Veracity) x 5 (Phase) Repeated Measures ANOVA was conducted. The results showed a significant Mauchly’s test of Sphericity, therefore the Greenhouse-Geisser statistics are reported here. The Veracity*Phase interaction effect was significant (F (2.11, 943.3) = 8.57, p < 0.001, partial η2 = .02). The main effects of Veracity and Phase were significant (Veracity: F (1, 447) = 9.62, p = 0.002, partial
η2 = .02; Phase: F (2.11, 943.3) = 138.45, p < 0.001, partial η2 = .23). See Table 3.1 for the means and standard deviations.
The Veracity*Phase interaction effect is more informative than the Veracity and Phase main effects. The Veracity*Phase interaction effect is therefore the only significant effect discussed here. Liars found the overall interview, phases one, two and four significantly harder than truth tellers (overall: T (463.13) = -3.01, p = 0.002; phase 1: T (388.03) = -4.9, p < 0.001; phase 2: T (471) = -4.1, p < 0.001; phase 4: T (472) = -4.54, p < 0.001). There is no significant difference between liars and truth tellers in phases three and five (phase 3: T (469.84) = -1.06, p = 0.29; phase 5: T (473) = 1.63, p =1.03). Phase five is considered the hardest phase, followed by phase
four, phase two, phase three and phase one. All five phases differ significantly from all others (All T > 3.18, all p < 0.002).
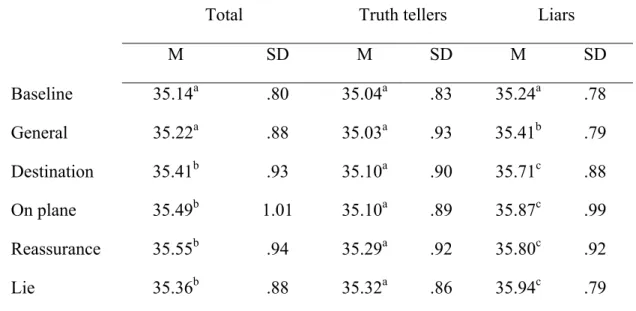
Table 3.1: The mean (SD) of difficulty per phase. Higher scores indicate more participants rated the questions in this category as difficult.
General Destination plans and past
Plans on plane
Reassurance Lie Overall
Truth tellers
.05 (.18) .20 (.23) .05 (.18) .16 (.21) .48 (.50) .19 (.16) Liars .16 (.29) .29 (.23) .07 (.19) .26 (.24) .41 (.49) .24 (.17)
Questionnaire discussion.
The findings show that the hypothesis was partially supported. Liars found, overall, the interview more difficult than truth tellers. This is an indication that lying may be more cognitively demanding than telling the truth. However, the Phase results show that this is dependent on the kind of question that is asked. Liars found phases one, two and four harder than truth tellers, as hypothesised, but there was no significant difference between truth tellers and liars in phase three and five, although the trends were in the hypothesised direction. Perhaps, if questions have a rather obvious answer, like those in the third phase (there is only so much one can plan to do on a plane), liars experience them as being as easy as truth tellers do. The “lie to me” question was found to be the hardest overall, and more truth tellers than liars found it hard. This may perhaps be because truth tellers had to change from truth telling to lying, which is associated with more cognitive load (Monsell, 2003). In contrast, liars had to do the same task again, although they had to do a new lie, they still lied.
Chapter four: Non-verbal Behaviour as a Lie Detection Tool
In Chapter 4 non-verbal cues to deception are introduced and the parts of Experiment 1 that concern non-verbal cues are reported. Non-verbal cues to deception have been studied extensively. For example, in their 2003 meta-analysis DePaulo, Lindsay, Malone, Muhlenbruck, Charlton and Cooper analysed 116 different articles, which together gave 1338 estimates of 158 different verbal and non-verbal cues. Non-verbal cues can be divided into visual and vocal cues (Vrij, 2008). Visual cues are in the body language of the participant: the way they move, the gestures they make, the body movements they make, their eye movements. Vocal cues are cues in the voice of the participant; the focus is on how they speak, such as speech rate and fluency of speech.
The present experiment focused on an array of visual and vocal cues, most have been used previously. The visual cues investigated were: hand movements (hand and finger movements, not associated with speech or arm movements), illustrators (hand movements that help illustrate speech), self-manipulations (touching parts of the body except the hands, the latter are classified as hand movements), leg and foot movements, blinking (how often the participant blinks), gaze aversion (the amount of time spent looking away from the interviewer) and laughing. The vocal cues were: latency (the amount of time before the answer), pausing (breaking speech by silence), uhmming (breaking speech with a meaningless vocalisation), stuttering (repeating words or parts of words), struggling (struggling to find a word or phrase) and speech rate (how fast the speech is). Three cues that concern the overall impression the interviewee gives were also investigated: whether the interviewee appears to be nervous, appears to be thinking hard and appears to be
outward signs of the interviewee’s arousal, cognitive load or attempt at controlling their behaviour respectively. Because these cues concern the impression the participant gives they may be more subjective than the others. How someone is perceived depends not only on their behaviour but also on the perceiver. High scores for hand movements, self-manipulations, leg and foot movements, stuttering, speech rate and appearing nervous are usually seen as signs of nervousness and arousal (Vrij, 2008). Low scores on hand movements, self-manipulation, leg and foot
movements, speech rate and controlling behaviour and high scores on gaze aversion, latency, pausing, uhmming, struggling and thinking hard are usually seen as signs of high cognitive load (Vrij et al. 2006). High scores on appearing to control behaviour and low scores on hand movements, illustrators and leg and foot movements and gaze aversion are usually seen as signs that the participant is trying to control his behaviour. This is because most people believe that liars fidget and look away, thus liars will try not to fidget and look away in order to appear convincing (Akehurst, Köhnken, Vrij & Bull 1996; Hartwig et al. 2007).
Some cues have been found to be somewhat diagnostic: liars make fewer hand movements and illustrators than truth tellers (De Paulo et al., 2003). For other cues the findings have been mixed. For example, liars made more self manipulations than truth tellers in Porter, Doucette, Woodworth, Earle, and MacNeill (2008), whereas liars made fewer self manipulations than truth tellers in Granhag and Strömwall, (2002). Leg and foot movements also show mixed results. For example, Vrij and colleagues (2008) found that liars make more leg and foot movements than truth tellers, while Levine Feeley, McCornack, Hughes, and Harms (2005) found that truth tellers make more leg and foot movements.
DePaulo et al.’s (2003) meta-analysis found no significant difference between liars and truth tellers in blinking, whereas individual studies have revealed mixed results. Leal and Vrij (2008) found a possible explanation for this discrepancy in the way that it is measured. They found that truth tellers and liars have different blinking patterns. They conducted a mock crime experiment in which all participants told the truth on baseline questions, whereas on the target questions half lied and half told the truth. They examined the blinks during the baseline and target questions and also directly after the target questions. They found that liars blinked less when answering target questions than when answering baseline questions but that directly after having answered those target questions liars blinked more than when answering baseline or target questions. Truth tellers blinked more when answering target
questions than when answering baseline questions and directly after answering target questions they blinked at the same rate as when answering target questions. Leal and Vrij (2008) found no difference between truth tellers and liars in blink rate when they examined the blinks during answering the target questions and directly after the target questions combined. So, although liars and truth tellers showed different blinking patterns, the overall rate in blinking did not differ.
The results of previous studies on gaze aversion are inconclusive. DePaulo et al. (2003) found no significant difference between liars and truth tellers in gaze aversion. Some studies have found that truth tellers look at the interviewer more than liars (Miller, de Turck & Kalbfleish, 1983), whereas others have found that liars look at the interviewer more than truth tellers (e.g. Granhag & Strömwall, 2002).
Laughing shows a mixed pattern again. Vrij, Edward and Bull (2001) found that truth tellers laugh more than liars, while others found no difference (e.g. Hocking &
between studies may be because there are two kinds of smiles: genuine smiles and smiles to mask other emotions. In Ekman et al.s (1988) experiment, truth tellers showed more genuine smiles than liars, whereas liars showed more masking smiles than truth tellers. When they observed smiles overall there was no difference
between liars and truth tellers. Latency, the time between the end of the question and the start of the answer, has been investigated in several studies. Some studies found longer latencies for truth tellers (Parliament & Yarmey, 2007), other studies found longer latencies for liars (Vendemia, Buzan and Green, 2005). Pausing did not emerge as a diagnostic cue to deceit in DePaulo et al. (2003) and DePaulo et al. (2003) where furthermore no difference was found in uhmming between truth tellers and liars either. However, some studies have found that truth tellers used more uhms than liars (e.g. Vrij et al. 2001b, 2007, 2008), whereas others found that truth tellers used uhm more often (e.g. Arciul, Mallard & Villar 2010). Arciuli et al. (2010) suggest that the prediction of whether truth tellers uhm more or less than liars
depends on how uhmming is examined. If uhmming is a filled pause then liars would be expected to uhm more, whereas liars would be predicted to uhm less if “uhm” is considered as a word, similar to other interjections.
DePaulo et.al. (2003) found in their meta-analysis that stuttering occurs more during lies than truths. For differences in struggling with speaking, DePaulo et al. (2003) found no effect. For speech rate, there are conflicting results again. For example Vrij et al. (2001b) found that truth tellers speak more slowly than liars, while Vrij et.al. (2008) found that liars speak slower. Regarding the overall impression cues, DePaulo et al. (2003) found that liars appear more nervous than truth tellers. The cognitive load approach predicts that liars should be thinking harder than truth tellers and this may be visible to an observer. This visibility is not based
on a particular cue, but rather on the overall impression the observer has of the participant (Vrij et.al, 2008). This Hartwig, Granhag and Strömwall (2007) found that liars are more likely to attempt to control their non-verbal behaviour. This attempted control may be visible to an observer.
The participants in our sample had many different ethnicities. Previous research has shown that non-verbal behaviour can differ between ethnicities, so it is important to test for any interaction effects between veracity and ethnicity on non-verbal behaviour. Some of the visual cues in this experiment have previously been investigated in people with different ethnic backgrounds. Johnson (2007) studied the non-verbal behaviour of guilty and innocent Americans of different ethnicities. He found that Caucasian Americans and Hispanic Americans who had committed a crime made more hand gestures than innocent Caucasians and Hispanics in interviews, while African Americans who had committed a crime made less hand gestures than those who had not. He also found that African Americans and
Hispanics, both guilty and innocent made more hand gestures than guilty or innocent Caucasians. This means that Hispanics and African Americans have a higher risk of being falsely accused, on the basis of their hand movements, since observers
typically associate more hand movements with deception (Akehurst, Köhnken, Vrij & Bull, 1996; Lakhani & Taylor, 2003). Johnson (2007) also found that guilty and innocent Caucasians made more eye contact with the interviewer than guilty or innocent Hispanics or African Americans whilst smiling was not affected by
ethnicity. Blinking is unlikely to be influenced by ethnicity since studies have shown that features like eye colour, which are correlated with ethnicity, do not affect the blink rate (Bentivoglio et al. 1997).
The effect of ethnicity on the vocal cues is difficult to predict, because the level of English a participant speaks will be a confounding factor. Speaking in a second language has been shown to affect cues to deceit (Caldwell-Harris &
Ayçiçeği-Dinn, 2009) and participants speaking in a second language are more likely to be judged as deceptive by observers (Da Silva & Leach, 2011). Presumably this is because speaking in a second language increases cognitive load. Since signs of cognitive load can be cues to deception, both truth tellers and liars speaking in a second language may show more cues to deceit than truth tellers and liars speaking in their native language. Participants of certain ethnicities are more likely to be native English speakers than people with other ethnicities. For example, the Northern European ethnicity includes native English speakers from the UK, while the Arabian ethnicity is less likely to contain native English speakers. By scoring each participant on how well they speak English we hope to be able to untangle the effects of
veracity, ethnicity and level of English. The previous research on the effects of veracity on these vocal cues is quite inconclusive suggesting that if there is an effect, it will be small. The effects of ethnicity and level of English on vocal cues may be larger.
In this experiment, we investigated the presence of the 17 non-verbal cues described above in truth telling and lying participants. For most of these cues there are no specific hypotheses since the previous research is not conclusive. However some hypotheses can be formulated (I) truth tellers will make more hand movements and illustrators than liars and there will be an interaction effect between veracity and ethnicity on hand movements and illustrators. Lying Caucasians will make more hand movements and illustrators than Caucasians who are telling the truth, while for Africans this will be reversed (DePaulo et al., 2003; Johnson, 2007); (II) Ethnicity
will affect gaze aversion, with North-Europeans averting their gaze less (Johnson, 2007); (III) liars will appear more nervous, hard thinking and controlling
independent of their ethnicity (Vrij et al., 2008) and (IV) ethnicity and level of English will affect vocal cues more than veracity will (Caldwell-Harris & Ayçiçeğ i-Dinn, 2009).
Method.
For the Participants, Design and Procedure sections of the method, please see Chapter three.
Dependent variables.
There are 17 dependent variables, the 16 nonverbal cues discussed above and interview length. The first variable is hand movements, the amount of hand
movements that could not be classified as illustrators or self-manipulations. The variable illustrators indicates the amount of hand and arm movements the participant uses to modify and supplement their speech. The variable self-manipulations
indicates the amount of time the participant touches a part of their body, clothing or hair, with their hands. Touching the hands was classified as hand movements rather than self-manipulations. The variable leg/foot movements indicates the amount of time moving the legs and feet. The variable blinking is the frequency with which the participant blinks. The variable gaze aversion indicates the amount of time the participant looks anywhere except at the interviewer. The variable laughing indicates the amount of time the participant laughs. The variable latency indicates how long it takes the participant to start answering each question. Pausing indicates how much the participant spent pausing in their answering. Uhmming indicates how often the participant makes meaningless sounds, like, uhm ah or oh. Stuttering indicates how much the participant stutters, i.e. repeats a word or a part of a word. Struggling
right word or expression. Speech rate indicates how fast the participant speaks. The variable nervous is an indication of how nervous the participant seems to be. Hard thinking indicates how hard the participant appears to be thinking about his or her answer and the variable control indicates how much the participant seems to be controlling his or her non-verbal behaviour, either by moving or by keeping still deliberately. Besides these variables the interview length was measured in seconds.
Coding and reliability coding.
The variable length was measured using the timer of the videos. The English ability variable was rated on a three point scale (poor, average, fluent) by the
interviewer who conducted the interview. They based their rating on how well the interviewee understood their questions and how well they answered. The other 16 dependent variables were coded by two separate coders on a 1-7 scale with higher scores indicating the behaviour occurred more. The coder was experienced with coding work and had been trained in using this coding system. The coder first watched some videos in order to get familiar with how a typical behavioural cue looked or sounded and how often the average person showed each cue. An independent secondary coder coded 50 of the participants. Both coders were Northern European, female psychologists and blind to the veracity status of the participants. The second coder learned the definition of each cue from the first coder. The first and the second coder watched several clips together, while the first coder stated how much each cue was present, so the second coder could learn to recognise them and see how often the participants showed them. The second coder then rated a few clips by herself, these ratings were compared with the ratings from the first coder and, where necessary, the second coder received further instructions on how to code the clips. Then the second coder rated the other clips. The correlation between
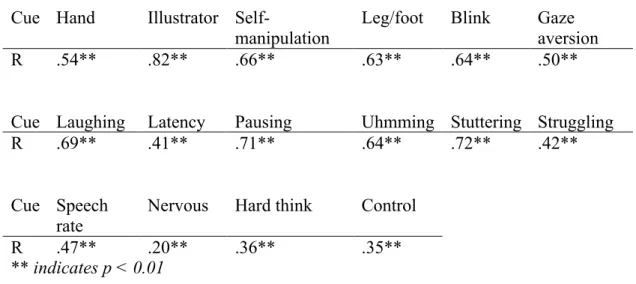
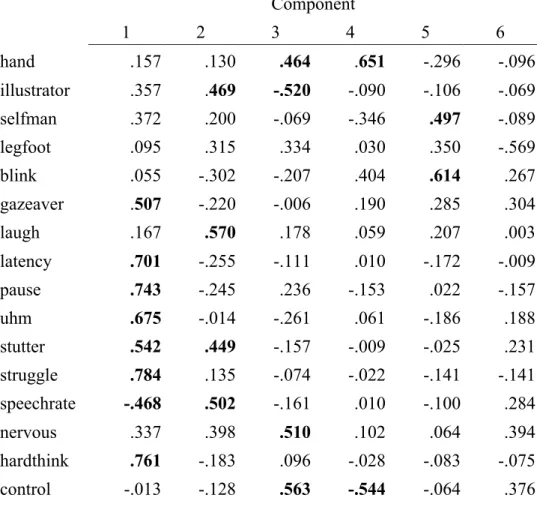
the first and the second coder are shown in Table 4.1. A score of .50 or higher is usually considered sufficiently reliable, while over .60 is considered good and over .75 excellent (Fleiss, 1981 (as cited in Vrij, 2005). Correlations were preferred, over kappa, because kappa can be affected by the base rate of a cue (Spitznagel & Helzer, 1985). Since some cues may be quite rare, this may affect kappa in this experiment. Table 4.1 shows that, although all cues are correlated significantly (all p < 0.01), only illustrators are in the excellent range with a correlation of .82.
Self-manipulation, leg and foot movements, laughing, pausing, uhmming, and stuttering have good correlations, while hand movements and gaze aversion are still reliable. Struggling, speech rate, nervousness, hard thinking and control are all under .50. In particular, nervousness is low with a correlation of .20. Since nervousness, thinking hard and control concern the overall impression the participant gives rather than a countable behaviour, it is perhaps not surprising that the correlation is lower for these variables. It does mean that the results for these variables should be viewed with great caution, but in order to be complete its results are reported further on in the thesis. The correlations for struggling and speech rate are also low, but higher than the impression variables. Speech rate can be measured objectively, by counting the number of words or syllables per minute, the fact that the two subjective coders did not correlate highly suggests that they were not very good at estimating how fast someone spoke. Perhaps certain accents give the impression that someone is
speaking quickly or slowly and this impression may be different for different observers. The low score for struggle perhaps reflects that each of the two coders tried to compensate for how well a person spoke English in their own way.
Table 4.1: The correlation between the first and second coder N = 480. Cue Hand Illustrator
Self-manipulation Leg/foot Blink Gaze aversion
R .54** .82** .66** .63** .64** .50**
Cue Laughing Latency Pausing Uhmming Stuttering Struggling
R .69** .41** .71** .64** .72** .42**
Cue Speech
rate Nervous Hard think Control
R .47** .20** .36** .35**
** indicates p < 0.01
Data analysis.
The 17 variables were analysed using a multivariate repeated measures analysis with the 5 phases as the repeating independent factor and Veracity,
Ethnicity and level of English as the between subject factors. Post-hoc tests (multiple comparisons) with Bonferroni adjustments were also used. All variables showed a multivariate significant Mauchly’s tests of sphericity. In order to mitigate this, the Pillai’s Trace statistic is reported, for multivariate test, because this statistic is the most robust against abnormal distributions in cases where all groups are of equal size. Because the data is on a seven point scale it was decided to deal with the abnormality statistically rather than by excluding outliers. The coders based their scores on their experience of the entire range of behaviours and the scale, so that the most extreme behaviour occupies the top and bottom and of the scale, regardless of whether the behaviour is actually extreme. Removing the outliers would simply cut the bottom and top end of the scale off and this would result in loss of information. For the univariate tests the sphericity assumed effects were reported, if Mauchly’s test of sphericity was non-significant. Where Mauchly’s test was significant, the
Greenhouse-Geisser effects are reported, because these are most conservative. In order to see whether the 16 cues could be condensed into fewer factors, the scores on all questions were averaged together so that each participant has an overall score for each variable. A principle component factor analysis was then performed on these summed variables. A discriminant analysis was conducted to test the usefulness of these factors for lie detection.
Results.
Multivariate.
The multivariate repeated measure analysis revealed that all main effects were significant: Veracity: F (17, 305) = 1.79, p = 0.03, partial η2 = .09; Ethnicity: F (187, 3465) = 1.59, p < 0.001, partial η2 = .08; level of English: F (34, 612) = 4.37, p < 0.001, partial η2 = .2; Phase: F (68, 254) = 30.98, p < 0.001, partial η2 = .89. Three interaction effects were significant: the three way Ethnicity*English*Phase effect (F (1496, 6050) = 1.12, p = 0.003, partial η2 = .22) and two two-way
interaction effects: the Ethnicity*Phase (F (748, 2904) = 1.31, p < 0.001, partial η2 = .25) and English*Phase effect (F (136, 510) = 1.38, p = 0.007, partial η2 = .27). The other interaction effects were all non significant (all F < 1.10, all p > .12). The univariate results for the significant main effects are described in the next paragraph. All interaction effect are either not significant or do not include veracity, the main interest of this thesis. Therefore they will not be discussed in further detail.
Univariate.
The univariate Veracity tests showed significant effects for struggling (F (1, 321) = 11.10, p = 0.001, partial η2 = .03), hard thinking (F (1, 321) = 6.52, p = 0.01,
partial η2 = .02) and control (F (1, 321) = 9.36, p = 0.002, partial η2 = .03), all others were not significant (F < 2.69, p > .10, partial η2 < 0.1). The estimated marginal means show that truth tellers (M = 2.19, SE = 0.08) struggled more than liars (M = 1.95, SE = 0.08); that truth tellers (M = 2.87, SE = 0.06) appeared to be thinking harder than liars (M = 2.85, SE = 0.07) and that liars (M = 2.55, SE = 0.07) appeared more controlled than truth tellers (M = 2.22, SE = 0.06). However as reported earlier, the reliability scores for these three variables were quite low. The consequences of this are mentioned in the discussion.
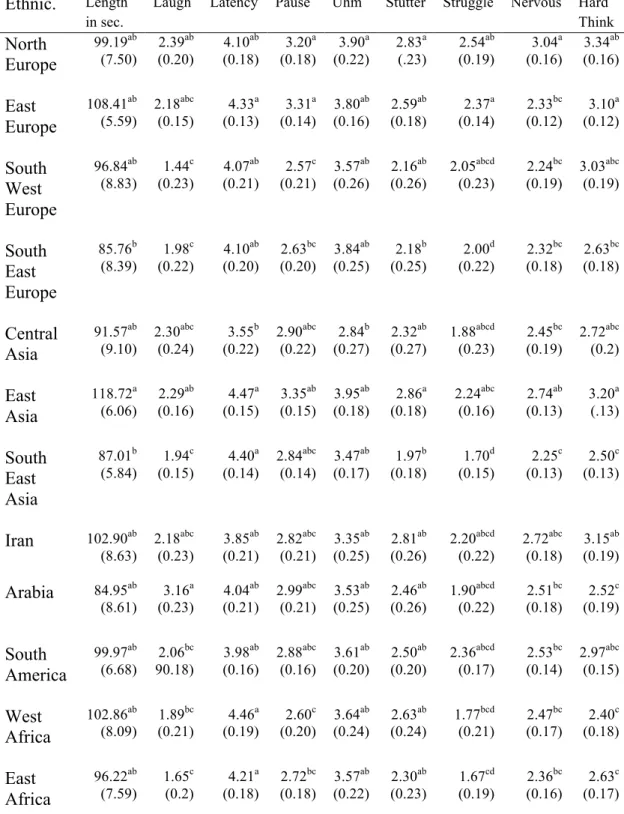
The univariate Ethnicity tests showed significant effects for length (F (11, 321) = 2.03, p = 0.03, partial η2 = .07), laughing (F (11, 321) = 3.75, p < 0.001, partial η2 = .11), latency (F (11, 321) = 1.93, p = 0.04, partial η2 = .06), pausing (F (11, 321) = 2.16, p = 0.02, partial η2 = .07), stuttering (F (11, 321) = 1.88, p = 0.04, partial η2 = .06), struggling (F (11, 321) = 2.35, p = 0.01, partial η2 = .07), nervousness (F (11, 321) = 1.9, p = 0.04, partial η2 = .06) and hard thinking (F (11, 321) = 3.9, p < 0.001, partial η2 = .12), all others are not significant (F < 1.64, p > .09, partial η2 < 0.6). The post hoc tests show (see Table 4.2 for means, standard errors and
indications of significant differences) that there are significant differences between the different ethnicities. The ranking of the ethnicities is relatively stable over the different variables. Northern Europeans, Eastern Europeans and East Asians score significantly higher than other ethnicities on most variables, while South East Europeans and South East Asians score significantly lower than other ethnicities on most variables. South West Europeans, Central Asians, Iranians and South
Americans tend to be between these two groups, while Arabs and West and East Africans show a less clear pattern scoring high on some variables and low on others.
In order to get a clearer view of the difference a factor analysis is conducted (see page 53).