THE EFFECT OF INVESTOR SENTIMENT ON
SOVEREIGN RISK PREMIUMS
Master’s Thesis
Erik Mäkelä
Aalto University School of Business
Information and Service Management
Spring 2017
Aalto University, P.O. BOX 11000, 00076 AALTO www.aalto.fi
Abstract of master’s thesis
i
Author Erik Mäkelä
Title of thesis The Effect of Investor Sentiment on Sovereign Risk Premiums
Degree Master of Science in Economics and Business Administration
Degree programme Information and Service Management
Thesis advisor(s) Timo Kuosmanen
Year of approval 2017 Number of pages 57 Language English
Abstract
The question of whether investor sentiment affects asset prices has been actively debated in the finance literature. This master´s thesis examines the effect of investor risk appetite on asset returns in the market segment that has not received much attention in the existing literature; investment grade government bonds.
In order to identify the impact of investor sentiment, this study controls the effects of time-varying fundamentals by focusing on the yield spreads to Germany in 10-year government bonds of other triple-A-rated Eurozone countries. The main finding of the empirical analysis is that the sovereign yield spreads are positively related to the level of risk aversion.
This study applies fairly recent and novel measure for investor risk aversion, the equity variance premium that is obtained with a decomposition method developed by Bekaert and Hoerova, and Lo Duca (2013). The variance premium for European financial markets is defined as a difference between the squared VDAX index and an estimate of the conditional variance of the German stock market, the DAX index. The decomposition of the volatility index provides measures for investor risk appetite and expected stock market uncertainty which have been identified as important drivers of asset price dynamics in recent structural dynamic asset pricing literature.
The results suggest that during the times of low investor risk appetite, the sovereign yield spreads to Germany increase. This finding holds for both pre- and post-crisis periods and also when the identification assumption of constant fundamental based risk premium to Germany is relaxed by controlling the differences in CDS (credit default swap) prices.
Aalto-yliopisto, P.O. BOX 11000, 00076 AALTO www.aalto.fi
Maisterintutkinnon tutkielman tiivistelmä
ii
Tekijä Erik Mäkelä
Työn nimi The Effect of Investor Sentiment on Sovereign Risk Premiums
Tutkinto Kauppatieteiden maisteri
Koulutusohjelma Information and Service Management
Työn ohjaaja(t) Timo Kuosmanen
Hyväksymisvuosi 2017 Sivumäärä 57 Kieli englanti
Tiivistelmä
Markkinasentimentin ja arvopaperien hintojen välinen yhteys on ollut pitkään rahoitusmarkkinatutkimuksen mielenkiinnon kohteena. Tämä maisterintutkielma käsittelee sijoittajien riskinottohalukkuuden vaikutuksia matalan luottoriskin omaavien valtionlainojen hintoihin. Kyseinen markkinasegmentti on jäänyt aiemmissa tutkimuksissa verrattain vähälle huomiolle.
Tutkielman empiirinen analyysi keskittyy 10-vuoden valtionlainojen tuottoeroihin AAA-luottoluokituksen omaavien euromaiden ja Saksan välillä. Tällä tavoin pyritään kontrolloimaan ajassa muuttuvat fundamenttitekijät ja identifioimaan sijoittajien riskiaversion vaikutukset valtionlainojen tuottovaatimukseen. Tutkielmassa havaitaan että valtionlainojen tuottoerot ovat positiivisesti yhteydessä markkinoiden yleisen riskiaversion tasoon.
Tutkielma hyödyntää tuoretta mittaria sijoittajien riskinottohalukkuudelle, joka estimoidaan käyttämällä Bekartin, Hoerovan ja Lo Ducan (2013) kehittämää volatiliteetti-indeksihajotelmaa. Tässä menetelmässä Saksan osakemarkkinoiden riskiaversiota heijastava varianssiriskilisä määritellään neliöidyn VDAX-indeksin ja DAX-indeksin estimoidun ehdollisen varianssin erotuksena. Menetelmä tuottaa mittarit sekä sijoittajien riskinottohalukkuudelle että osakemarkkinoiden odotetulle epävarmuudelle, joiden merkitystä modernit rakenteelliset ja dynaamiset hinnoittelumallit ovat korostaneet arvopaperien hinnanmuodostuksessa.
Tutkimuksen mukaan matalan riskinottohalukkuuden aikoina valtioluottojen korkoerot suhteessa Saksaan kasvavat. Tämä tulos pätee sekä viimeisintä finanssikriisiä edeltäneenä että sitä seuranneena ajanjaksona. Positiivinen yhteys korkoerojen ja riskiaversion välillä säilyy myös silloin kun fundamenttiperusteisen tuottoeron sallitaan muuttua ajassa kontrolloimalla CDS (credit default swap)-hintojen erot suhteessa Saksaan.
iii
Table of Contents
1 Introduction ... 1
2 Theoretical motivation and literature review ... 4
3 Measures for risk aversion and uncertainty ... 11
3.1 Data ... 11
3.2 Method ... 11
3.3 Validating the measures ... 14
4 Estimating the effect of investor sentiment on sovereign yield spreads ... 21
4.1 Identification and empirical strategy ... 22
4.2 Descriptive evidence ... 26
4.3 Baseline results ... 29
4.4 Causality ... 31
4.5 Forecasting ability of the investor sentiment model ... 35
4.6 Discussion ... 40
5 Conclusions ... 44
iv
List of Tables
Table 1: OLS-estimates for risk-aversion and uncertainty on to-liquidity and flight-to-quality measures ... 20 Table 2: Descriptive statistics, yield spread to Germany, risk aversion and uncertainty, whole
sample ... 27 Table 3: Average spreads to Germany, correlations between spreads, risk aversion and
uncertainty, period when a country is included to the sample ... 27 Table 4: OLS coefficients for risk aversion, uncertainty, lagged yield spread and difference
in CDS price on yield spread and corresponding p-values ... 29 Table 5: Out-of-sample forecasting accuracy of the benchmark and sentiment models, daily
frequency, whole panel ... 36 Table 6: Out-of-sample forecasting accuracy of the benchmark and sentiment models, daily
frequency, individual countries ... 38 Table 7: Out-of-sample forecasting accuracy of the benchmark and sentiment models,
v
List of Figures
Figure 1. Actual and forecasted variance for German stock market. ... 13
Figure 2. Risk aversion and uncertainty measures for German stock market. ... 14
Figure 3. Economic Sentiment index for the Eurozone and uncertainty for German stock market. ... 15
Figure 4. Risk aversion and European Central Banks measure for global risk aversion. ... 16
Figure 5. Uncertainty and difference between European small and large cap total return indices. ... 17
Figure 6. Risk aversion and difference between European small and large cap total return indices. ... 18
Figure 7. Uncertainty and difference between European BBB- and AAA-rated corporate bond total return indices. ... 19
Figure 8. Risk aversion and difference between European BBB- and AAA-rated corporate bond total return indices. ... 19
Figure 9. Expected payoffs from high and low credit quality bonds with respect to expected economic fundamentals. ... 23
Figure 10. Average yield spread to Germany in AAA-rated Eurozone countries and risk aversion. ... 26
Figure 11. Average yield spreads to Germany in AAA-rated Eurozone countries and uncertainty. ... 26
Figure 12. Spreads in individual AAA-rated countries. ... 28
Figure 13. Impulse responses, daily frequency. ... 33
Introduction 1
1 Introduction
The question of whether investor sentiment affects asset prices has been actively debated in the finance literature. After the historical price run-up in the US stock markets and subsequent collapse in the late 1920´s, John Maynard Keynes argued that markets can be affected from investors’ animal spirits, which move prices in a way unrelated to fundamentals. According to classical asset pricing theories, asset returns are determined by rational expectations on changes in economic fundamentals. In contrast, the behavioral branch of literature suggests that the sentiment and trading behavior of market participants significantly affect asset returns in financial markets (see e.g. Baker and Wurgler, 2007 and Brown and Cliff, 2004). Recently, structural dynamic asset pricing models, such as Campbell and Cochrane, 1999 and Bansal and Yaron, 2004, also identifies risk aversion and economic uncertainty as important drivers of asset price dynamics.
A bulk of empirical studies find that investor sentiment significantly affects stock returns (see e.g. Brown and Cliff, 2004, Brown and Cliff, 2005, Baker and Wurgler, 2006, Baker and Wurgler, 2007, Schmeling, 2009 and Baker et al., 2012). While the majority of studies focus on the stock markets, some authors such as Blommestein et al. (2012) and De Grauwe and Ji (2013) consider that during the latest European sovereign debt crisis the increase in yield spreads in sovereign bonds was more driven by market sentiment than expected fundamentals.
This master´s thesis examines the effect of investor risk appetite on asset returns in the market segment that has not received much attention in the existing literature; investment grade government bonds. In order to identify the impact of investor sentiment, this study controls the effects of time-varying fundamentals by focusing on the yield spread to Germany in 10-year government bonds of other triple-A-rated Eurozone countries. Compared to previous studies on determinants of sovereign yield spreads (see e.g. Schuknecht et al., 2010 and De Grauwe and Ji, 2013), this design does not require the inclusion of low frequency macroeconomic or fiscal variables, and hence it allows to conduct the analysis with daily data.
The identification strategy stems to the fact that investment grade sovereign bonds have been considered as the safest assets in the world (Fontana and Scheicher, 2016). Due to concave payoff pattern of the debt claim (Hong and Sraer, 2013), it could be expected that
Introduction 2 the difference in default risk between Germany and triple-A-tranche Euro-sovereigns should not be much affected by idiosyncratic fiscal or macroeconomic developments. If the investor holds the bond to the maturity, the expected nominal return from the investment is likely to be certain. From the historical perspective it is extremely unlikely that a country with triple-A-rating ends up to default during the next 10 year period. In addition the analyzed countries have common monetary policy and hence, the yield spreads do not contain exchange rate risk. Intuitively this empirical design relates to Froot`s and Dabora`s (1999) study on mispricing between twin-companies.
This master´s thesis contributes to the existing literature by providing new evidence that the sentiment phenomena can be observed also in the asset class that is often considered as a safe haven in the European financial markets. The main finding of this study is that the sovereign yield spreads are positively related to the level of risk aversion, which is line with theoretical prediction of presented consumption based asset pricing model.
Previous studies often utilize volatility index (such VIX for US stock markets) as a proxy for investor sentiment (Bekaert and Hoerova, and Lo Duca, 2013). Recent literature, however, suggests that volatility index harbors information on both risk aversion and uncertainty (see e.g. Carr and Wu, 2009). This study applies fairly recent and novel measure for investor risk aversion, the equity variance premium that is obtained with a decomposition method developed by Bekaert and Hoerova, and Lo Duca (2013).
The variance premium for European financial markets is defined as a difference between the squared VDAX index and an estimate of the conditional variance of the German stock market, the DAX index. The decomposition of the volatility index provides a measures for investor risk appetite and expected stock market uncertainty. The descriptive validation of these measures shows that during the analyzed time period, from 2002 to 2014, both measures are highly correlated with the observed flight-to-quality and flight-to-liquidity tendencies. These phenome have been traditionally associated with changes in investor sentiment in the market place.
The results suggest that during the times of low investor risk appetite, the sovereign yield spreads to Germany increase. This finding holds for both pre- and post-crisis periods and also when the identification assumption of constant fundamental based risk premium to Germany is relaxed by controlling the differences in CDS (credit default swap) prices. The positive relationship between risk aversion and spreads seems to be robust and persistent during the analyzed time period from 2002 to 2014. Moreover, the estimated magnitude of the effect of investor sentiment is economically significant. For example, if the risk aversion
Introduction 3 measure increases by one standard deviation from its average level, which is fairly common movement during the sample period, the average yield spread to Germany increases by 20 percent points. In relative terms, this increase would result over 5 percent points higher average sovereign borrowing costs compared to Germany for the analyzed triple-A-rated countries. In 2008, when the risk aversion reached its highest levels, the average impact of the investor sentiment was over 40 basis points which corresponds about 10 percent points higher sovereign borrowing costs compared to Germany in long maturity government bonds. In order to study the causal link between risk aversion, uncertainty and spreads, the VAR analysis is also conducted. It is plausible that the regression analysis suffers from the endogeneity problem that might arise for example from the fact that the spreads could also reflect the expectations on the future of the euro system. It might be the case that the yield spreads in the Eurozone´s sovereign debt markets are affected from investor risk appetite and expected uncertainty in the German stock markets. The VAR analysis finds that there are causal relationship between yield spread and risk aversion, i.e. increase in risk aversion leads to higher yield spread. The magnitude of this effect is clearly higher compared to the OLS estimates.
Last it is studied whether the sentiment model that contains information on risk aversion and uncertainty provides better forecasts for yield spreads compared to simple AR(1) model. According to the results the sentiment model provides better predictions for the next day´s yield spreads only during the turbulent times. With monthly data frequency the sentiment model outperforms the AR(1) model also during the pre-crisis periods. The forecasting evaluations suggest that risk aversion and uncertainty have significant long run predictive power on spreads whereas in short run these measures do not provide valuable information for the forecasts.
The remainder of this thesis is organized as follows: the next reviews existing literature on the relationship between investor sentiment and asset prices and provides theoretical framework for the empirical analysis. Section 3 introduces the dataset and presents the decomposition method which results the measures for risk aversion and uncertainty from the VDAX index. Section 4 introduces the empirical strategy and results from regression- and VAR-analyzes and forecasting evaluations. Also internal and external validity and limitations of the study are shortly discussed. The last section provides a conclusion and suggestions for future research.
Theoretical motivation and literature review 4
2 Theoretical motivation and literature review
This section reviews existing literature on the relationship between investor sentiment and asset prices. I present a simple consumption based asset pricing model that provides a framework for the empirical analysis on yield spreads in European sovereign debt markets. This model suggests that when the fundamental based risk premium between two risky assets is time-invariant, changes in observed spreads are determined by investor risk aversion and economic uncertainty. In addition, this section discusses about behavioral finance theories that deal with short-selling constraints and investor disagreement. These theories provide an alternative viewpoint for the relationship between investor sentiment and asset prices.
The link between asset valuation and investor sentiment is the subject of considerable debate in the finance literature (Brown & Cliff 2005). According to the traditional asset pricing theories, competition among rational investors leads to an equilibrium in which asset prices equal the rationally discounted value of expected future cash flows. These theories argue that the demands of irrational investors are offset by arbitrageurs and thus irrational behavior should not significantly affect prices (Baker & Wurgler 2006).
On the other hand, as early as 1936 John Maynard Keynes argued that investors’ animal spirits can move prices in a way unrelated to fundamentals and cause wild fluctuations in the financial markets. More recently, Baker and Wurgler (2007) define investor sentiment as a belief about future cash flows or investment risks that is not justified by the facts at hand.
During the last decades behavioral finance literature has examined this phenomena by assuming that financial markets can be understood by using models in which some agents are not fully rational. This branch of literature has two building blocks: limits to arbitrage and psychology (Barberis and Thaler, 2003). Typically this literature suggests that sentiment affects the expectations on future cash flows and risks and thus has an effect on investment decisions and stock returns. Positive sentiment (also referred as excessive optimism or animal spirits) enforces investors´ confidence on their abilities to evaluate investment opportunities and makes them more willing to take risks. Brown and Cliff (2005) argue that sentiment is fairly persistent phenomena; people become more optimistic as they are reinforced by others joining on the bandwagon.
The behavior of financial asset prices in relation to consumption has been widely examined in the field of theoretical macroeconomics. This approach provides a cornerstone for the modern consumption based asset pricing theory. It assumes that investors are rational
Theoretical motivation and literature review 5 in a sense that they maximize their expected utility given the utility function and budget constraint. I present this theory with a simple textbook framework.
Consider a complete market economy as in Lucas (1978) where representative investor makes portfolio choices over one risk-free and one risky assets, 𝐴𝑡 and 𝑆𝑡 respectively. By using the arbitrage condition, I illustrate how the difference between rates of returns of these assets, the equity premium, can be computed.
Representative investor chooses consumption stream {𝐶𝑡+𝑖}𝑖=0∞ in order to:
max 𝐸𝑡 ∑ 𝛽𝑖𝑈(𝐶 𝑡+𝑖), 𝛽 ∈ (0,1) ∞ 𝑖=0 (1) s.t 𝑆𝑡+1+ 𝐴𝑡+1 = 𝑅𝑡𝑠𝑆 𝑡+ 𝑅𝑡𝑎𝐴𝑡+ 𝑊𝑡− 𝐶𝑡 lim 𝑖→∞ 𝑅𝑡+1𝑠 𝑆𝑡+𝑗 ∏𝑗=1𝑖 𝑅𝑡+𝑗𝑠 = 0 lim 𝑖→∞ 𝑅𝑡+1𝑎 𝐴𝑡+𝑗 ∏𝑗=1𝑖 𝑅𝑡+𝑗𝑎 = 0
It is assumed that returns from risk-free and risky assets, 𝑅𝑡𝑎 and 𝑅𝑡𝑠, follow first order Markov process that is exogenous to the investor. Moreover, the risk-free return 𝑅𝑡+1𝑎 is known already in period t. 𝑊𝑡 represents wage (or other) incomes that investor receives at time t and β is the subjective discount factor. The Bellman equation for this maximization problem can be written as:
𝑉(𝑅𝑡𝑠𝑆
𝑡, 𝑅𝑡𝑎𝐴𝑡) = 𝑀𝑎𝑥𝑆𝑡+1,𝐴𝑡+1{𝑈(𝑅𝑡𝑠𝑆𝑡+ 𝑅𝑡𝑎𝐴𝑡+ 𝑊𝑡− 𝑆𝑡+1− 𝐴𝑡+1) +
𝛽𝑉(𝑅𝑡+1𝑠 𝑆
𝑡+1, 𝑅𝑡+1𝑎 𝐴𝑡+1)} (2)
And the first order conditions are:
𝐴𝑡+1 : 𝑈′(𝐶𝑡) = 𝛽𝐸𝑡{𝑉𝐴′{𝑅𝑡+1𝑠 𝑆𝑡+1, 𝑅𝑡+1𝑎 𝐴𝑡+1}} (3) 𝑆𝑡+1 : 𝑈′(𝐶𝑡) = 𝛽𝐸𝑡{𝑉𝑆′{𝑅𝑡+1𝑠 𝑆𝑡+1, 𝑅𝑡+1𝑎 𝐴𝑡+1}} (4)
By differentiating the Bellman equation with respect to 𝐴𝑡 and 𝑆𝑡, using envelope conditions for 𝑉𝐴 and 𝑉𝑆, shifting one period forward, taking expectations and plugging back into first order conditions, we end to the well-known consumption beta-theory (see e.g. Campbell, 2003) :
Theoretical motivation and literature review 6 𝑅𝑡+1𝑎 𝐸 𝑡{𝛽𝑈 ′(𝐶 𝑡+1) 𝑈′(𝐶𝑡) } = 1 (5) 𝛽𝐸𝑡{𝑅𝑡+1𝑠 𝑈 ′(𝐶 𝑡+1) 𝑈′(𝐶𝑡) } = 1 (6)
By equating (5) and (6), the equity premium can be expressed as: 𝐸𝑡{𝑅𝑡+1𝑠 }−𝑅𝑡+1𝑎
𝑅𝑡+1𝑎 = 𝐶𝑜𝑣{𝑅𝑡+1𝑠 ,
𝛽𝑈′(𝐶𝑡+1)
𝑈′(𝐶𝑡) } (7)
Equation 7 shows that if the investor is risk-averse, the risky asset must offer premium over the risk-free asset. The premium is proportional to the covariance of its return with respect to the marginal rate of transformation of consumption from today to tomorrow. Moreover, for equity premium to be positive, it must be that consumption itself is positively correlated with returns from risky asset (since 𝑈′(𝐶) < 0 ). Higher the covariance between consumption and returns of risky asset, higher the premium should be in order for investor to hold risky asset.
By assuming CRRA (constant relative risk aversion) utility function (𝑈′(𝐶) = 𝐶−𝛾, where γ is a coefficient for risk aversion) and denoting 𝐶𝑡+1
𝐶𝑡 = ∆𝐶𝑡+1, second order Taylor
approximation for (7) yields following expression for the equity premium: log 𝐸𝑡{𝑅𝑡+1𝑠 } − 𝑙𝑜𝑔𝑅𝑡+1𝑎 = 𝛾𝐶𝑜𝑣(𝑙𝑜𝑔𝑅𝑡+1𝑠 , 𝑙𝑜𝑔∆𝐶𝑡+1) ≈
𝛾𝐶𝑜𝑟𝑟(𝑙𝑜𝑔𝑅𝑡+1𝑠 , 𝑙𝑜𝑔∆𝐶
𝑡+1)𝜎𝑙𝑜𝑔𝑅𝑡+1𝑠 𝜎𝑙𝑜𝑔∆𝐶𝑡+1 (8)
Where 𝜎𝑙𝑜𝑔𝑅𝑡+1𝑠 denotes the variation of the return from the risky asset and
𝜎𝑙𝑜𝑔∆𝐶𝑡+1represents the variation in consumption growth (i.e. economic uncertainty).
According to the equation 8, if the performance of the risky asset is positively correlated with consumption growth (i.e. macroeconomic development or state of the economy), the equity premium is positive. The higher the risk aversion, the more sensitive the equity premium is to the co-movements of risky returns and consumption growth. In addition, the uncertainty on consumption growth and returns increase the required premium.
In order to motivate the empirical analysis of this thesis, I will extent this setup by assuming that there exists two risky assets in the economy, 𝑆1 and 𝑆2. The spread between two risky assets can be expressed as:
Theoretical motivation and literature review 7 log 𝐸𝑡{𝑅𝑡+1𝑠1 } − 𝑙𝑜𝑔𝐸𝑡{𝑅𝑡+1𝑠2 } ≈ 𝛾𝜎𝑙𝑜𝑔∆𝐶𝑡+1(𝐶𝑜𝑟𝑟(𝑙𝑜𝑔𝑅𝑡+1𝑠1 , 𝑙𝑜𝑔∆𝐶 𝑡+1)𝜎𝑙𝑜𝑔𝑅𝑡+1𝑠1 − 𝐶𝑜𝑟𝑟(𝑙𝑜𝑔𝑅𝑡+1 𝑠2 , 𝑙𝑜𝑔∆𝐶 𝑡+1)𝜎𝑙𝑜𝑔𝑅𝑡+1𝑠2 ) (9)
Equation 9 shows that the spread between two risky assets depends on differences in asset specific fundamental factors, namely the correlations between pay-offs and consumption growth (i.e. the risk that arises from the macroeconomic sensitivity of the asset´s returns) and the deviations in asset returns. The more asset 1´s return is correlated with consumption growth and the higher is the uncertainty on of its return compared to asset 2, the higher is the spread between assets. In addition, investor´s risk aversion and the level of uncertainty on consumption (economic) growth enforce this fundamental-based premium.
This simple framework leads to very intuitive prediction; if the representative investor in highly risk-averse and there is high uncertainty on consumption growth, the required premium for safer asset is lower to riskier, compared to the case with low risk aversion and low economic uncertainty.
In this framework, risk aversion can be associated to the phenomena that behavioral economists call for investor sentiment. However, presented type of consumption based models typically assume that risk aversion is a constant parameter, which suggests that investor sentiment does not cause time variation to the asset prices. Due to empirically observed equity premium- and volatility-puzzles, Campbell (2003) suggests that a more realistic model for asset markets should contain high market price of risk that is time-varying and correlated with the state of the economy. In line with this view, recent structural dynamic asset pricing models have identified time-varying risk aversion and economic uncertainty as potential drivers of asset price dynamics (see e.g. Campbell and Cochrane 1999, Bansal and Yaron 2004 and Bekaert, Engstrom and Xing 2009).
For example Campbell and Cochrane (1999) present a model were the utility of a representative agent is a power function of the difference between consumption and so called habit term that is a slow-moving nonlinear average of past aggregate consumption. In this framework the agent becomes more risk-averse in bad times than in good times, because the consumption is lower relative to its past history. According to their model the equity premium can be explained with high average level of risk aversion and high stock market volatility.
Theoretical motivation and literature review 8 Motivated by the above mentioned asset pricing models, the subsequent empirical analysis in section 4 is based on the reduced form version of the model (9) where investor´s risk-aversion 𝛾 is allowed to be time-varying 𝛾𝑡. Moreover, it is assumed that the fundamental part of the risk premium between some AAA-rated Eurozone-country (i) and Germany (G) is time-invariant constant 𝑟𝑖:
𝐶𝑜𝑟𝑟(𝑙𝑜𝑔𝑅𝑡+1𝑠𝑖 , 𝑙𝑜𝑔∆𝐶
𝑡+1)𝜎𝑙𝑜𝑔𝑅𝑡+1𝑠1 − 𝐶𝑜𝑟𝑟(𝑙𝑜𝑔𝑅𝑡+1𝑠𝐺 , 𝑙𝑜𝑔∆𝐶𝑡+1)𝜎𝑙𝑜𝑔𝑅𝑡+1𝑠𝐺 = 𝑟𝑖 (10)
If this identification assumption holds, the yield spread for a country i at time t is an increasing function of constant country specific fundamental risk (𝑟𝑖), risk aversion (𝛾𝑡) and economic uncertainty (𝜎𝑙𝑜𝑔∆𝐶𝑡+1) :
𝑌𝑖𝑒𝑙𝑑 𝑆𝑝𝑟𝑒𝑎𝑑𝑖𝑡 = 𝐹(𝑟𝑖, 𝛾𝑡, 𝜎𝑙𝑜𝑔∆𝐶𝑡+1) (11)
Although the behavioral and structural (or rational) theories examine financial markets from different viewpoints, it can be seen that the new developments in the consumption based asset pricing models have converged the predictions of these literatures. Both model families recognize that changes in investor sentiment (or risk aversion) might affect asset prices.
The stock returns predictability in the cross-section is well established by the empirical literature. According to Campbell (2000) some firm characteristics, such as the book-to-market equity ratio, have predictive power on future returns. What causes this predictability continues to be debated in the literature. For example, Nagel (2005) suggests that the predictability might arise from the variation in rational expected returns across firms. An alternative explanation could be mispricing which results overpriced firms to generate lower returns than what have been expected whereas the returns of underpriced firms are higher. Overall, the observed predictability has been one of the key drivers for the developments of the both structural and behavioral asset pricing theories during the last decades.
From the rational viewpoint the main weakness of mispricing stories is that why these abnormal returns are not arbitraged away. Shleifer and Vishny (1997) highlight the role of limits to arbitrage for mispricing to persist in the presence of sophisticated
Theoretical motivation and literature review 9 professional investors. Short-sales1 constraints are often considered as one of the main limit
to arbitrage in the behavioral finance literature (these constraints might arise for example from some institutional and psychological reasons, short selling can be costly or restricted by the authorities).
According to Miller (1977) stocks can become overpriced if some investors are too optimistic and short-sell constraints are binding. The assumption of binding short-sell constraints and investor disagreement are the core building blocks for various theories of bubbles in behavioral finance literature. For example, Miller (1977) and Chen, Hong and Stein (2002) show that disagreement combined with binding short-sales constraints lead to over-pricing as pessimists sit out of the market. Alternatively Harrison and Kreps (1978) and Scheinkman and Xiong (2003) consider that due to short-sell constraints investors might value the re-sell potential to other investor who might have higher valuation. This kind of frameworks generate a bubble or overpricing in which price exceeds the fundamental value. Empirical studies suggests that constraints on short-selling can lead to an optimism-bias in prices (see e.g. Chen et al., 2002; Jones and Lamont, 2002; Lamont, 2004; Reed, 2003).
Theoretical literature provides alternative mechanisms for the relationship between investor sentiment and asset prices. The behavioral branch of theories suggest that investors may form flawed beliefs and therefore incorrectly evaluate assets which causes deviations from the intrinsic values (see, e.g., De Long et al., 1990 and Kumar and Lee, 2006). If the mispricing gets corrected when sentiment wanes (or the economic fundamentals are revealed), this literature predicts that there is negative relationship between market sentiment and future asset returns. Qualitatively, consumption based asset pricing models with time-varying risk aversion also result similar relationship.
However, Brown and Cliff (2005) point out that the existence of systematic mispricing is hard to reveal because of the difficulty in examining the issue empirically. Unfortunately, there is not clear consensus on how the fundamental value of an asset should be measured. For this reason a researcher has a joint test for mispricing and model of discount rates which makes the identification of mispricing difficult (Barberis and Thaler, 2003). Correspondingly, the definition and proper measurement of investor sentiment are somewhat ambiguous and debated.
1 Short-selling is a transaction where investor profits if the price of a stock decreases. Short
seller borrows the stock and sell it expecting that the price is lower when the stock needs to be repurchased and returned to the lender.
Theoretical motivation and literature review 10 The questions of whether the sentiment affects asset prices has been examined with various empirical strategies. Several studies that rely on the market level analysis find that investor sentiment has significant effect on stock returns in general (see e.g. Brown and Cliff 2004, Brown and Cliff 2005, Baker and Wurgler, 2006, Baker and Wurgler, 2007, Schmeling, 2009 and Baker et al., 2012). Another branch of behavioral studies show that the assumption of rational evaluation in asset pricing does not always hold by identifying individual cases which violates the law of one price (see e.g. Lamont and Thaler, 2003 (3Com’s spinoff of Palm) and Froot and Dabora, 1999 (twin-companies)).
Traditionally researchers have relied survey-based indices for investor sentiment or market-based measures such as option implied volatilities, mutual fund flows and trading and IPO volumes. Recently, Da, Engelberg and Gao (2014) utilize daily internet search volume from millions of households to reveal market-level sentiment. They find that the search-based sentiment measure predicts short-term return reversals, temporary increases in volatility and mutual fund flows out of equity funds and into bond funds. In addition, studies that examine non-economic events find that sentiment-changing events cause changes in asset prices (see e.g. weather conditions; Hirshleifer and Shumway, 2003, sports; Edmans, Garcia, and Norli, 2007, seasonal affective disorder; Kamstra, Kramer, and Levi, 2003, aviation disasters; Kaplanski and Levy, 2010)
Measures for risk aversion and uncertainty 11
3 Measures for risk aversion and uncertainty
Consumption based asset pricing model in section 2 suggests that yield spread between two risky assets depends positively on difference in fundamental risk, the level of investor risk aversion and economic uncertainty. This section provides measures for the two latter determinants which are utilized in empirical analysis for sovereign yield spreads in section 4. Also data for empirical analyses is introduced.
3.1 Data
The dataset is unbalanced panel containing daily 10-year government bond yield spreads to Germany for the Eurozone countries which hold AAA-rating from Standard & Poors rating agency. These countries are namely Austria, Finland, France, Ireland, the Netherlands and Spain. The sample period starts at 01/03/2002 and ends at 10/10/2014, when the last country (Finland) lost its triple-A rating. A down-graded country is excluded from the sample day before the official announcement, giving 14053 observations. Data for 10-year government bond yields has been collected from Macrobond.
Measures for risk aversion and uncertainty are calculated by using daily values of VDAX index and daily realized variances (calculated from 5-minute intra-day returns) for DAX index. The data for VDAX and realized daily variance are collected from Macrobond and Oxford-Man Institute of Quantitative Finance Realized Library (Gerd et. al, 2009), respectively. Data for CDS prices has been collected from Macrobond.
3.2 Method
Behavioral finance literature and financial institutions have provided a variety of indicators for risk aversion and market sentiment (Coudert and Gex, 2008). This study utilizes fairly recent and novel measure for investor risk aversion, the equity variance premium. In this study, variance premium in German stock market is defined as a difference between the squared VDAX index and an estimate of the conditional variance of the stock market, the DAX index.
The VDAX index is the risk-neutral expected stock market variance for the DAX contract and is computed from a panel of options prices. The American equivalent, VIX for S&P500 index, has been considered as a fear index for asset markets (Whaley, 2000). These volatility indices reflect physical expected volatility (stock market uncertainty) and variance risk premium. The variance premium is based on the objective financial market information
Measures for risk aversion and uncertainty 12 and purifies option-implied volatility from the effect of uncertainty and physical volatility. For this reason the variance premium leaves a measure that is correlated with risk aversion (Bekaert, Hoerova, and Lo Duca, 2013).
Bollerslev, Tauchen and Zhou (2009) provide evidence on predictive power of the variance premium on stock returns. Bekaert, Hoerova, and Lo Duca (2013) find strong interactions between monetary policy and the variance premium which suggests that monetary policy may actually affect risk aversion in the market place. Subsequently, Bekaert and Hoerova (2014) find that the variance premium predicts stock returns whereas the conditional stock market variance predicts economic activity. Moreover, they find that the conditional variance has relatively higher predictive power for financial instability than does the variance premium.
In order to decompose the VDAX index into risk aversion and uncertainty measures, this study utilizes the approach developed by seminal paper of Bekaert and Hoerova, and Lo Duca (2013) for VIX index. The variance risk premium (VP) for German stock market is defined as:
𝑉𝑃𝑡 = 𝑉𝐷𝐴𝑋𝑡2− 𝐸
𝑡[𝑅𝑉𝑡+1(22)] (12)
Here the VDAX is the implied option volatility of the DAX index for contracts with a maturity of one month, and 𝑅𝑉𝑡+1(22) is the DAX realized variance measured over the next month (22 trading days) using 5 minute returns. Here the time index t denotes daily observations.
The squared VDAX can be interpreted as conditional return variance that uses risk-neutral probability measure, whereas the conditional variance is based on the actual physical probability measure. Theoretically the risk-adjusted measure shifts probability mass is shifted to states with higher marginal utility (bad states) and this implies that the variance premium will be increasing in the economy’s risk aversion (Bekaert and Hoerova, 2014)
In the first phase of the decomposition the expected future realized variance needs to be estimated. Bekaert, Hoerova, and Lo Duca (2013) obtained the estimates by projecting future realized monthly variances (computed using squared 5-minute returns) onto the squared VIX, the dividend yield and the real three-month T-bill rate. They conducted a horserace between eight volatility forecasting models and ended up to following model for S&P500 index´s future realized variance:
Measures for risk aversion and uncertainty 13
𝑅𝑉𝐴𝑅𝑡 = 𝛼 + 𝛽1𝑉𝐼𝑋𝑡−222 + 𝛽
2𝑅𝑉𝐴𝑅𝑡−1(22)+ 𝜀𝑡 (13)
The fitted value from the two-variable projection was their estimated conditional variance and their measure of “uncertainty.” The difference between the squared VIX and the conditional variance they defined as a measure of “risk aversion”, corresponding to VP in (12). Bekaert and Hoerova (2014) examined alternative specifications and suggested following forecasting model which adds the lagged weekly and daily variances to model 11:
𝑅𝑉𝐴𝑅𝑡 = 𝛼 + 𝛽1𝑉𝐼𝑋𝑡−222 + 𝛽2𝑅𝑉𝐴𝑅𝑡−1(22)+ 𝛽3𝑅𝑉𝐴𝑅𝑡−22(5) + 𝛽4𝑅𝑉𝐴𝑅𝑡−22(1) + 𝜀𝑡 (14)
In order to obtain 𝐸𝑡[𝑅𝑉𝑡+1(22)] for DAX index, I estimate the models 11 and 12 for German stock markets by using daily variances from 5-minute intra-day data. Based on the in- and out-off-sample forecasting abilities, the model 12 is selected for VDAX decomposition. The correlation coefficient (adjusted R-squared) between actual and forecasted variances is about 0.61 during the period 2002 to 2014. Figure 1 illustrates the developments in realized and forecasted variances (RVAR and RVARF, respectively) and the forecasting model seems to perform fairly well during the sample period.
0 100 200 300 400 02 03 04 05 06 07 08 09 10 11 12 13 14 RVARF RVAR
Measures for risk aversion and uncertainty 14
3.3 Validating the measures
In this section I provide descriptive evidence for risk aversion and uncertainty measures and examine how these are related to some alternative measures and to-quality and flight-to-liquidity phenomena.
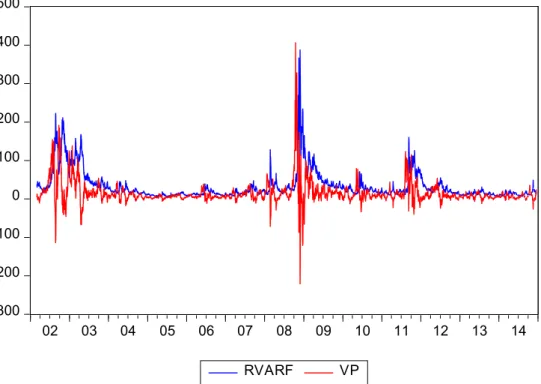
Figure 2 shows the developments in risk aversion and uncertainty measures obtained from (10). The measure for uncertainty (RVARF) increases significantly during U.S corporate scandals and war of Iraq (2002 and 2003), after Lehman (autumn 2008) and during the different phases of European sovereign debt crisis (early 2010´s). The risk aversion measure (VP) follows fairly similar pattern. However, it seems that the peaks in risk aversion leads to some extent the corresponding peaks in uncertainty. In daily frequency, the correlation between the measures is low, only 0.04. Although the measures seem to have positive long run relationship, in short run the measures are almost orthogonal. VDAX index itself is more correlated with uncertainty than risk aversion, the correlations being 0.8 and 0.6, respectively. -300 -200 -100 0 100 200 300 400 500 02 03 04 05 06 07 08 09 10 11 12 13 14 RVARF VP
Figure 2. Risk aversion (VP) and uncertainty (RVARF) measures for German stock market.
Figure 3 illustrates the developments in RVARF and Economic Sentiment Index for the Eurozone (monthly frequency). The Economic Sentiment index is a composite indicator
Measures for risk aversion and uncertainty 15 published by European Commission. It is made up of five sectoral confidence indicators with different weights: Industrial confidence indicator, Services confidence indicator, Consumer confidence indicator, Construction confidence indicator and Retail trade confidence indicator. Stock market uncertainty and Economic sentiment index seem to be negatively correlated. During the high stock market uncertainty in Germany the Eurozone aggregate real economic sentiment is low. This is in line with the well-known observation that stock market volatility is high during the economic downturn (see e.g. Bloom 2009).
0 100 200 300 400 500 -40 -30 -20 -10 0 10 02 03 04 05 06 07 08 09 10 11 12 13 14 RVARF Esindex
Figure 3. Economic Sentiment index for the Eurozone (Esindex, right scale) and uncertainty for German stock market (RVARF, left scale).
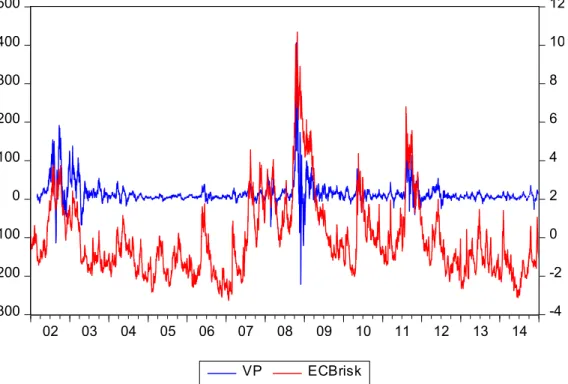
Figure 4 shows that the estimated variance premium for German stock market co-moves with European Central Bank´s (ECB) measure for global risk aversion indicator. However, the global risk aversion indicator is clearly more volatile. The indicator is constructed as the first principal component of five risk aversion indicators, namely Commerzbank Global Risk Perception, UBS FX Risk Index, Westpac’s Risk Appetite Index, BoA ML Risk Aversion Indicator and Credit Suisse Risk Appetite Index. A rise in the indicator denotes an increase in risk aversion.
Measures for risk aversion and uncertainty 16 -300 -200 -100 0 100 200 300 400 500 -4 -2 0 2 4 6 8 10 12 02 03 04 05 06 07 08 09 10 11 12 13 14 VP ECBrisk
Figure 4. Risk aversion (VP, left scale) and European Central Banks measure for global risk aversion (ECBrisk, right scale).
It can be concluded that the estimated measures for variance premium (risk-aversion) and conditional variance (uncertainty) seems plausible. The forecasting model for realized variance performs fairly well and the measures have intuitive developments during the crises periods. Moreover, descriptive evidence suggests that VP and RVARF are correlated with alternative measures.
Next I examine the relationships between risk aversion and uncertainty measures to the phenomena which the literature has often connected to the investor sentiment, namely flight-to-liquidity and flight-to-quality. According to Baele et al (2013), a flight-to-liquidity arises when risk averse investment managers fear redemptions during high volatility periods. Then an increase in volatility may increase the demand for assets with high liquidity. Caballero and Krishnamurthy (2008) show that knightian uncertainty may lead investors to shed risky assets in favor of safe assets when aggregate liquidity is low. Increase in risk aversion leads to higher risk premiums, which in turn drives down the prices of risky assets (flight-to-quality).
Measures for risk aversion and uncertainty 17 0 100 200 300 400 500 0.0 0.2 0.4 0.6 0.8 1.0 02 03 04 05 06 07 08 09 10 11 12 13 14 RVARF Sldif
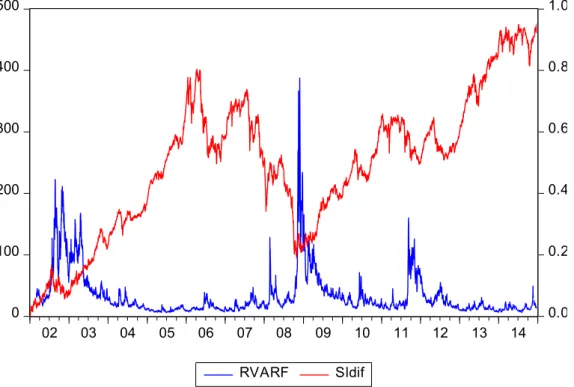
Figure 5. Uncertainty (RVARF, left scale) and difference between European small and large cap total return indices (Sldif, right scale, 02/01/2002=0).
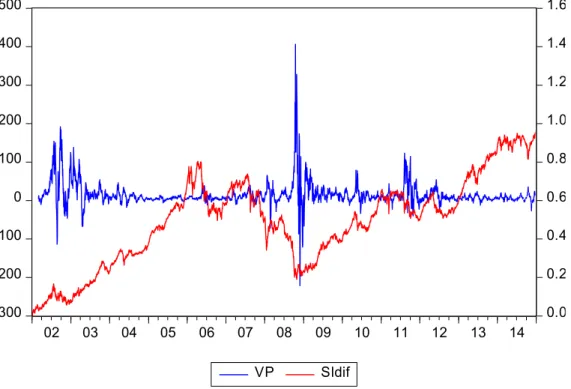
The difference between small and large cap total return indices illustrates the flight-to-liquidity tendency in European stock markets. Figure 5 shows that during the high uncertainty periods, the relative returns from small and less liquid stocks decrease. This suggests that volatility increases demand for liquid stocks which increases prices and returns from these assets. Figure 8 illustrates similar relationship between risk aversion and flight-to-liquidity tendency.
Measures for risk aversion and uncertainty 18 -300 -200 -100 0 100 200 300 400 500 0.0 0.2 0.4 0.6 0.8 1.0 1.2 1.4 1.6 02 03 04 05 06 07 08 09 10 11 12 13 14 VP Sldif
Figure 6. Risk aversion (VP, left scale) and difference between European small and large cap total return indices (Sldif, right scale, 02/01/2002=0).
Figures 7 and 8 suggest that uncertainty and risk aversion are positively related to the flight-to-safety tendency. Difference between total returns in BBB- and AAA-rated European corporate bond indices illustrates the investors’ willingness to hold risky assets. Due to fact that the bonds are issued by relatively large companies, the measure probably lacks the flight-to-liquidity effect. During the high risk aversion and uncertainty periods investors shift their demand from riskier to safer bonds. After the latest financial crisis there is persistent shift in the difference. However, the negative correlation between series seems to hold during the post-crisis period.
Measures for risk aversion and uncertainty 19 0 100 200 300 400 500 600 700 -.2 -.1 .0 .1 .2 .3 .4 .5 02 03 04 05 06 07 08 09 10 11 12 13 14 RVARF BBB-AAA
Figure 7. Uncertainty (RVARF, left scale) and difference between European BBB- and AAA-rated corporate bond total return indices (BBB-AAA, right scale, 02/01/2002=0).
-300 -200 -100 0 100 200 300 400 500 -.2 -.1 .0 .1 .2 .3 .4 .5 .6 02 03 04 05 06 07 08 09 10 11 12 13 14 VP BBB-AAA
Figure 8. Risk aversion (VP, left scale) and difference between European BBB- and AAA-rated corporate bond total return indices (BBB-AAA, right scale, 02/01/2002=0).
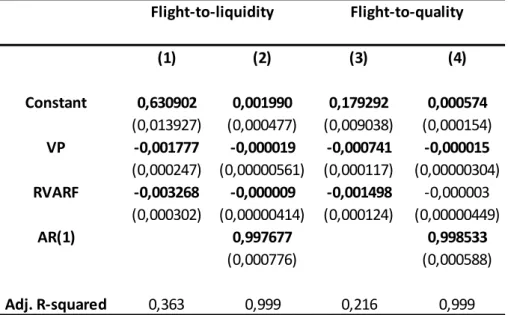
Measures for risk aversion and uncertainty 20 Table 1: OLS-estimates for risk-aversion and uncertainty on flight-to-liquidity (Sldif) and flight-to-quality (BBB-AAA) measures (sample 2002-2014, 3320 observations, robust standard errors are reported in parenthesis, bolded values are statistically significant at 5 percent level)
The regression analysis supports previous descriptive evidence for the relationships between the measures and flight-to-quality and flight-to-liquidity phenomena. Regression 1 and 2 in table 1 estimate the effect of risk-aversion and uncertainty on difference between small and large cap indices. Both high risk-aversion and uncertainty measures are statistically significantly related to the flight-to-liquidity tendency. Regressions 3 and 4 suggest that similar conclusion applies also for the flight-to-quality (difference between returns in BBB and AAA-rated corporate bonds). However, in regression 4 the change in flight-to-quality tendency is enforced only by the risk aversion, the coefficient for uncertainty being statistically insignificant.
Regressions 1 and 3 show that compared to risk aversion, uncertainty is more related to the levels of both phenomena. However, regressions 2 and 4 that estimate the change in flight-to-liquidity and flight-to-quality tendencies suggest that risk aversion is more important determinant. This suggest that risk-appetite might be more important driver for the shifts in investor preferences in terms of liquidity and safety of the assets. However, the overall evaluation of the relative importance of the measures on the phenomena is somewhat ambiguous.
This section concludes that, in terms of alternative measures and observed shifts in investor preferences, both VP and RVARF react to the changes in investor sentiment and expected uncertainty in the European financial markets. Next section studies whether these measures can explain sovereign yield spreads in triple-A-rated Eurozone countries.
(1) (2) (3) (4) Constant 0,630902 0,001990 0,179292 0,000574 (0,013927) (0,000477) (0,009038) (0,000154) VP -0,001777 -0,000019 -0,000741 -0,000015 (0,000247) (0,00000561) (0,000117) (0,00000304) RVARF -0,003268 -0,000009 -0,001498 -0,000003 (0,000302) (0,00000414) (0,000124) (0,00000449) AR(1) 0,997677 0,998533 (0,000776) (0,000588) Adj. R-squared 0,363 0,999 0,216 0,999 Flight-to-liquidity Flight-to-quality
Estimating the effect of investor sentiment on
sovereign yield spreads 21
4 Estimating the effect of investor sentiment on
sovereign yield spreads
The vast majority of previous empirical studies on investor sentiment and asset prices is based on the evidence from US stock markets (Schmeling 2009). This master thesis contributes to the existing literature by studying the effects of sentiment phenomena in the asset class that is often considered as a safe haven in the European financial markets; the triple-A-rated long maturity government bonds. Some authors (see e.g. De Grauwe and Ji, 2013) consider that during the Euro crisis, many sovereign borrowers in the Eurozone have paid significant risk premiums that cannot be justified by fiscal or macroeconomic fundamentals. This section examines whether these premiums are related to the levels of aversion and uncertainty in the Eurozone financial markets.
Empirical studies that examine whether some asset is mispriced to its fundamentals due to investor sentiment face significant challenges. For example, in a panel framework all relevant cross-section specific fundamental factors need to be controlled. In practice, it is hard to estimate plausible counterfactual scenario that answers to the question; what would have been the price of some asset if the sentiment in the market place would have been different? In addition the definition and measurement for sentiment are probably always somewhat questionable. For example, interpretation of the coefficient of simple volatility index is ambiguous since, in theory, it contains information on both risk aversion and stock market uncertainty.
By keeping these issues in mind, the analysis in this section aims to control the effects of time-varying fundamentals by focusing on yield spreads to Germany in other triple-A-rated Eurozone countries. Intuitively this empirical design is related to Froot`s and Dabora`s (1999) study on mispricing between twin-companies. Compared to other studies on sovereign yield spreads (see e.g. Schuknecht et al., 2010 and De Grauwe and Ji, 2013), this design does not require the inclusion of macroeconomic or fiscal variables and it allows to conduct the analysis with higher data frequency. In addition, this analysis utilizes VDAX-decomposition (from the previous section) that enables to separate the impacts of risk aversion and uncertainty on yield spreads.
The empirical analysis is threefold. First, regression analysis studies whether the yield spreads to Germany are related to the estimated risk aversion and uncertainty measures. Second, the sign of the causality is examined in VAR framework. Last the forecasting ability of the measures on yield spreads is studied.
Estimating the effect of investor sentiment on
sovereign yield spreads 22
4.1 Identification and empirical strategy
This study is conducted with 10-year government bonds issued by Eurozone countries which hold triple A-rating from Standard & Poors rating agency. According to Standard & Poors, an obligor rated AAA (highest issuer credit rating assigned by S&P Global Ratings) has extremely strong capacity to meet its financial commitments. The five key factors that form the foundation of their sovereign credit analysis are institutional effectiveness and political risks, economic structure and growth prospects, external liquidity and international investment position, fiscal performance and flexibility (as well as debt burden) and monetary flexibility (Standard & Poors, 2011).
The rationale for the identification strategy stems to the fact that investment grade sovereign bonds have been considered as the safest assets in the world. The lack of defaults among developed country governments underpinned the widely used assumption that government bonds provide a good proxy for the long-horizon risk-free rate (Fontana and Scheicher, 2016). It could be expected the difference in default risk between Germany and triple-A-tranche Euro-sovereigns should not be much affected by fiscal or macroeconomic developments. If the investor holds the bond to the maturity, the expected nominal return from the investment is likely to be certain. From the historical perspective it is extremely unlikely, although possible, event that a country with triple-A-rating ends up to default during the next 10 year period.
Eurozone countries in general, are fairly similar with respect to economic fundamentals; countries locate in the same geographical area, share similar economic and institutional structures and the economies are highly inter-connected. Due to single currency, countries have common monetary policy and hence, the yield spreads do not contain exchange rate risk. Moreover, the sovereign risk premiums converged rapidly after the introduction of the single currency, which could be interpreted as some kind of expected joint liability of government debts in the union.
The empirical evidence on the role of fiscal and economic fundamentals determining the realized sovereign bond spreads is mixed. Some papers attribute the importance of sovereign's fiscal position for risk premiums (e.g., Codogno et al., 2003; Schuknecht et al., 2010; Aizenman et al., 2013). In contrast, authors such as Favero et al. (2010) and Manganelli and Wolswijk (2009) consider that bond yield spreads are significantly affected by international factors that reflect global investor risk aversion. Blommestein et al. (2012)
Estimating the effect of investor sentiment on
sovereign yield spreads 23
and De Grauwe and Ji (2013) argue that during the European sovereign debt crisis the increased risk premiums are mostly driven by market sentiment.
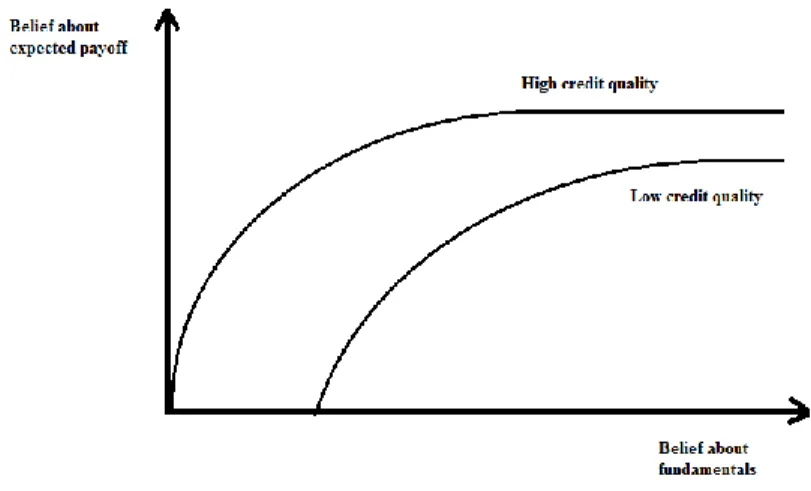
The main difference between German and other triple-A Eurozone government bonds is that the German bonds are considered as the benchmark in the Eurozone. Like US Treasuries, the Swiss franc, the Japanese Yen and gold, German Bund have had a safe haven status in the global financial markets (Santis, 2012) Generally the yield spreads to Germany have been positive. This has been the case since German bonds are the most liquid ones and investor pays smaller transaction and information costs when buying German bonds compared to other Euro sovereigns. It is plausible to expect that the fundamental based yield spread to Germany is positive although fairly time-invariant. Due to fact that debt claim´s up-side payoffs are capped at some constant, the payoff pattern is concave in the investor beliefs about fundamentals (Hong and Sraer, 2013).
Figure 9. Expected payoffs from high and low credit quality bonds with respect to expected economic fundamentals.
Figure 9 illustrates the differences between high and low risk debt claims´ payoff patterns with respect to expected state of the economy. Due to concave payoff pattern, the value of the safe asset is less affected by the fundamentals compared to the riskier one. It can be assumed that the Eurozone countries holding the best credit rating have fairly similar payoff patterns to fundamentals. Moreover, if it is assumed that AAA-countries won´t default under any circumstances, then the payoff patterns are vertical to economic fundamentals.
Recall that the consumption based asset pricing model in section 2 suggests that yield spread between two risky assets depends positively on difference in fundamental risk, the level of investor risk aversion and economic uncertainty (equation 9). Therefore, the
Estimating the effect of investor sentiment on
sovereign yield spreads 24
empirical analysis requires two identification assumptions. First, the fundamental based risk premiums to Germany should be constant (equation 10). Second, the estimated measures for risk aversion and uncertainty, 𝑉𝑃𝑡 and 𝑅𝑉𝐴𝑅𝐹𝑡 respectively, should correspond their theoretical counterparts 𝛾𝑡 and 𝜎𝑙𝑜𝑔∆𝐶𝑡+1.
If these assumptions hold, the yield spread for country i at time t is an increasing function of constant country specific fundamental risk, variance premium and conditional variance:
𝑌𝑖𝑒𝑙𝑑 𝑆𝑝𝑟𝑒𝑎𝑑𝑖𝑡 = 𝐹(𝑟𝑖, 𝑉𝑃𝑡, 𝑅𝑉𝐴𝑅𝐹𝑡) (15)
This section studies whether these measures have explanatory power on observed yield spreads as the theoretical motivation suggests. The estimated baseline model is:
𝑌𝑖𝑒𝑙𝑑 𝑆𝑝𝑟𝑒𝑎𝑑𝑖𝑡 = 𝛼 + 𝛽1𝑉𝑃𝑡+ 𝛽2𝑅𝑉𝐴𝑅𝐹𝑡+ 𝜀𝑖𝑡 (16)
Where 𝛼 is constant and 𝜀𝑖𝑡 is the error term.
Although the empirical analysis is based on consumption based asset pricing model, it should acknowledged that also behavioral theories can lead to the corresponding conclusions for the role of risk aversion. In the presence of binding short-sales constraints country i`s bond can get over-priced as pessimists sit out of the market, which leads smaller spread to Germany when risk aversion is low. Alternatively, during the time of decreasing risk aversion investors might value the potential to re-sell at a higher price to someone with a higher valuation due to binding short-sales constraints which also decreases the spread. According to both arguments, high sentiment combined with investor disagreement and short-selling constraints, can generate a bubble or overpricing in which the yield of country
i´s bond is below its fundamental value 𝑟𝑖.
Previous studies suggest that there are significant limits to arbitrage in European sovereign debt markets, which makes the above mentioned behavioral mechanism plausible. For example, Fontana and Scheicher (2016) observe a relationship between the derivatives market and the underlying cash market characterized by sizable deviations from the no-arbitrage relationship. They show that short-selling frictions explain the persistence of positive basis deviations. Duffie (2010) reports that even during the latest financial crisis, the short positions were not common in the Eurozone´s sovereign debt markets. For example
Estimating the effect of investor sentiment on
sovereign yield spreads 25
the ratio of net CDS positions to Finnish government debt was under three percent. However, the speculation with naked CDSs and short bond positions were associated to the turbulence in the European bond market. In 2010, Germany prohibited naked CDSs of euro-denominated sovereign bonds and naked short sales2 based on those bonds. The regulation
aimed to drive down the rising bond yields and suppress the volatility in the market (Pu and Zhang 2012).
As a robustness check, it is studied whether the baseline results hold when the assumption of constant fundamental based risk premium is relaxed. This is done by controlling differences in CDS prices relative to Germany. A CDS contract protects investor against the default of the issuing sovereign. The premium which the protection buyer pays to the protection seller is determined in CDS market and reflects the expected default risk of the respective country (see e.g. Aizenman et al., 2013). Fontana and Scheicher (2016) find that CDSs correlate with country-specific economic covariates. In this sense, differences in CDS prices between Germany and other triple-A Eurozone countries provide a market based proxy for differences in expected default risk (i.e. in fiscal and macroeconomic fundamentals). Compared to actual fiscal and macroeconomic fundamentals, the main benefit of CDS data is that it available in a daily frequency. Unfortunately, when CDS prices are controlled, the number of observations decreases. This is due to fact that the CDS prices are available for the majority of analyzed sovereigns from 2006 or 2007 onwards.
Estimating the effect of investor sentiment on
sovereign yield spreads 26
4.2 Descriptive evidence
-0.2 0.0 0.2 0.4 0.6 0.8 1.0 1.2 1.4 -300 -200 -100 0 100 200 300 400 500 02 03 04 05 06 07 08 09 10 11 12 13 14 Mean yield_dif VPFigure 10. Average yield spread to Germany in AAA-rated Eurozone countries (right scale) and risk aversion (left scale). -0.2 0.0 0.2 0.4 0.6 0.8 1.0 1.2 1.4 0 100 200 300 400 500 600 700 800 02 03 04 05 06 07 08 09 10 11 12 13 14
Mean yield_dif RVARF
Figure 11. Average yield spreads to Germany in AAA-rated Eurozone countries (right scale) and uncertainty (left scale).
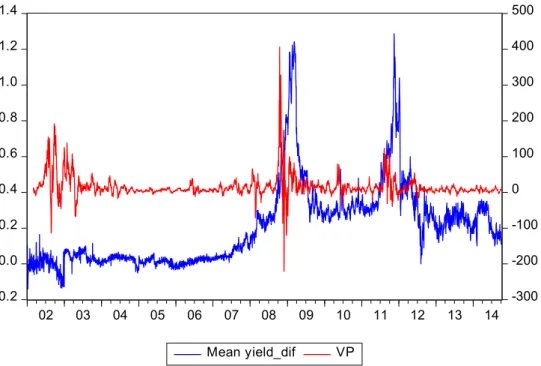
Figures 10 and 11 illustrate the developments in average yield spread and risk aversion and uncertainty measures. During the period 2002 to 2007 sovereign risk was almost equally
Estimating the effect of investor sentiment on
sovereign yield spreads 27
priced in the Eurozone, the yields spreads to Germany being near zero. In early 2008 the spreads increased rapidly breaching the 1 percent (100 basis point) level in May 2009 and November 2011. The low levels in spreads coincide with low levels in risk aversion and uncertainty measures. In addition, peaks in risk aversion seem to lead peaks in spread whereas the developments in spreads and uncertainty are more coincident.
Table 2: Descriptive statistics, yield spread to Germany, risk aversion and uncertainty, whole sample
Table 3: Average spreads to Germany, correlations between spreads, risk aversion and uncertainty, period when a country is included to the sample
Table 2 shows that the average yield spread has been about 18 basis points (0,18 percent) and the spreads have been varied between 7 and 280 basis points. Moreover, table 3 reports that the average spreads have been fairly similar in individual countries, which suggests that the country specific heterogeneity in economic fundamentals does not lead to significantly different sovereign risk premium in the triple A-tranche. For example in 2005 government debt-to-GDP-ratios varied from 32 (Ireland) to 82 (France) percent. This finding supports the identification assumption of concave pay-off-pattern.
One might consider the magnitudes of the yield spreads as economically insignificant at the first sight. However, taking into account the fact that the average yield in German
10-Spread VP RVARF Mean 0,18 16,45 36,18 Median 0,07 9,21 21,22 Maximum 2,82 406,23 387,72 Minimum -0,20 -221,29 5,88 Std. Dev. 0,27 33,29 40,40
Country Spread VP RVARF
Austria 0,25 0,09 0,28 1.3.2002 12.1.2012 Finland 0,18 0,14 0,30 1.3.2002 9.10.2014 France 0,17 0,05 0,20 1.3.2002 12.1.2012 Ireland 0,15 0,20 0,37 1.3.2002 27.3.2009 Netherlands 0,13 0,11 0,28 1.3.2002 12.1.2012 Spain 0,11 0,26 0,72 12.3.2004 9.1.2009 Average 0,17 0,14 0,36 Time period
Estimating the effect of investor sentiment on
sovereign yield spreads 28
year government bonds has been about 320 basis points during the sample period, the spreads (in relative terms) have been significant from the sovereign borrowing viewpoint.
-0.5 0.0 0.5 1.0 1.5 2.0 2.5 3.0 02 03 04 05 06 07 08 09 10 11 12 13 14
Austria Finland France
Ireland Netherlands Spain Figure 12. Spreads in individual AAA-rated countries.
As mentioned earlier, the data is unbalanced panel. Ireland and Spain lost their AAA-rating during the aftermath of the latest financial crisis whereas Austria, France and the Netherlands were downgraded in early 2012. During the last two years of the sample period, Finland was the only country in the Eurozone (in addition to Germany) that held its triple-A rating.
Figure 12 shows that the yield spreads follow similar pattern in all AAA-rated countries during the sample period. On the other hand there can be seen clear anticipation in spreads of Ireland, Austria and the Netherlands before the downgrading whereas corresponding development cannot be observed for Spain, France and Finland. CDS prices, however, help to control the possible effects of anticipated idiosyncratic changes in default risk before the rating event.
Simple correlations in table 3 suggest that spreads are positively related to the risk aversion and uncertainty measures, the average correlation coefficients being 0,14 and 0,36, respectively. The correlations between investor sentiment and spreads are highest in Spain and Ireland and lowest in France and Austria.
Estimating the effect of investor sentiment on
sovereign yield spreads 29
4.3 Baseline results
This section provides OLS estimates for risk aversion on yield spreads controlling the level of uncertainty. It is studied whether the risk aversion and uncertainty measures have explanatory power on observed yield spreads as the theoretical motivation suggests.
As a robustness check, I allow the fundamental part of risk premium to be time varying by controlling the spreads with differences in CDS prices to Germany. In that exercise it is assumed that CDS prices reflect only the default risk and are not affected by uncertainty or risk aversion (i.e. CDS is considered as an insurance).
In addition, the corresponding analysis is conducted with different subsamples of the data. Several studies (see e.g. Ureche-Rangau and Burietz, 2013, Acharya, Dreschler and Schnabl, 2011 and Candelon and Palm, 2010) highlight the role of the feedback loop between the governments and national banking sectors during the European sovereign debt crisis. Especially for Ireland and Spain this is relevant issue since the fiscal stance of these countries deteriorated significantly and rapidly, when governments attempted to save their banking systems during the financial crisis. This gives a rationale to examine whether the baseline results hold when Ireland and Spain are excluded from the sample. In addition, it is studied whether the results change when the crises periods (the latest financial crisis and the European sovereign debt crisis) are excluded. This sample period also omits downgrading activities.
Table 4: OLS coefficients for risk aversion (VP), uncertainty (RVARF), lagged yield spread (AR(1)) and difference in CDS price on yield spread and corresponding p-values (based on White heteroscedasticity robust standard errors, bolded values are statistically significant at 5 percent level)
Model (1) (2) (3) (4) (5) (6) (7) (8) (9) Constant 0,08646 0,00019 0,12361 0,12087 0,00114 0,13172 0,05635 0,00366 -0,02338 (0,024821) (0,000668) (0,033883) (0,004663) (0,000763) (0,005646) (0,006138) (0,001138) (0,011748) VP 0,00100 0,00006 0,00110 0,00062 0,00005 0,00119 0,00003 0,00002 0,00272 (0,000278) (0,00000713) (0,000182) (0,00015) (0,0000237) (0,000195) (0,000116) (0,00000743) (0,000373) RVARF 0,00203 0,00002 0,00187 0,00150 0,00002 0,00228 -0,00019 -0,00002 0,00416 (0,000387) (0,00000666) (0,000537) (0,000141) (0,0000149) (0,000184) (0,000136) (0,0000085) (0,000629) AR(1) 0,99203 0,98743 0,93760 (0,004832) (0,004155) (0,016344) CDS_dif 0,00682 0,00592 0,00587 (0,00118) (0,000154) (0,001133) Adjusted R-squared 0,11 0,98 0,73 0,07 0,97 0,65 0,01 0,88 0,58 Observations 14103 14103 7996 10996 10996 6781 9706 9706 3599