University of Arkansas, Fayetteville
ScholarWorks@UARK
Theses and Dissertations7-2015
Information Propagation in Financial Markets
Garrett A. McBrayerUniversity of Arkansas, Fayetteville
Follow this and additional works at:http://scholarworks.uark.edu/etd
Part of theEconomic Theory Commons,Finance Commons, and theOther Economics Commons
This Dissertation is brought to you for free and open access by ScholarWorks@UARK. It has been accepted for inclusion in Theses and Dissertations by an authorized administrator of ScholarWorks@UARK. For more information, please [email protected], [email protected].
Recommended Citation
McBrayer, Garrett A., "Information Propagation in Financial Markets" (2015).Theses and Dissertations. 1182. http://scholarworks.uark.edu/etd/1182
Information Propagation in Financial Markets
A dissertation submitted in partial fulfillment of the requirements for the degree of Doctor of Philosophy in Business Administration
by
Garrett A. McBrayer Appalachian State University
Bachelor of Science in Communications, 2002 Kennesaw State University
Master of Business Administration, 2010
July 2015 University of Arkansas
This dissertation is approved for recommendation to the Graduate Council.
_________________________ Dr. Wayne Y. Lee
Dissertation Director
_________________________ _________________________
Dr. Alexey Malakhov Dr. Timothy J. Yeager
Abstract
This dissertation consists of three essays which examine information flows through financial markets and across firms, and investigates the factors affecting the process of information dissemination. The first essay examines whether the announcement of a credit rating change for a given firm contains information pertinent to the valuations of intra-industry peer firms. I identify an information spillover effect on peer firms surrounding credit rating downgrades. Further, I find that the post-announcement spillover effects are indicative of an overreaction in the market’s response to the downgrade announcement. Peer firms exhibit predictability in their post-announcement returns as a function of their relative transparency.
The second essay explores the relation between instances of credit rating initiations and stock market liquidity. Traditional finance literature holds the view that liquidity is impaired as a function of information asymmetry. Additionally, that credit ratings have been shown to reduce information asymmetry. This study uses instances of new credit ratings to examine the change in stock market liquidity surrounding the announcement of the new rating. My results suggest that rating initiations improve in the liquidity of the newly rated firm’s equity and that managers exploit this price support through seasoned equity offerings.
The third essay investigates information flows through the social networks of board members. I find that the degree to which a CEO and her directors overlap in social communities affects the governance of the firm and that these effects are conditional upon the adverse
reputation costs faced by the board. For firms whose boards face relatively lower (higher) potential adverse reputation costs to bad behavior, clustering is associated with poorer (better) governance and greater (lesser) expropriation by managers.
Acknowledgments
My academic indebtedness is an obligation which will never be fully satisfied. I owe a great deal to the generosity, humanity, tutelage, and unwavering support of Dr. Wayne Lee, Dr. Tim Yeager, and Dr. Alexey Malakhov. Without whom, the completion of my studies would have been much less certain. Special thanks are due to the rest of the Finance Department at the Walton College of Business as well as to the faculty members from other departments who help to shape my research and learning. The academic environment fostered by the Walton College encourages academic exploration through the sharing of ideas, the willingness to invest in its students, and the collaborative learning opportunities afforded therein. In addition, my views in finance research more generally and information propagation more particular were shaped by numerous discussions with fellow PhD students at the University of Arkansas. I owe a great debt of thanks to Bill McCumber, Santiago Barraza, and Jun Duanmu for their willingness to give towards the development of this body of work and towards my own, academic development.
In addition to my academic debts, I owe a great deal to those who supported me personally in developing this body of knowledge. My wife, Crystal, has been a source of unyielding support and provision during this arduous process. My daughters, Greenlee and Leland June, never withheld their love and encouragement even when the workload necessitated my temporary absence. My family for their support and understanding. And, to my cherished friends who were always there to keep me grounded.
Dedication
Table of Contents
I. Introduction ... 1
II. Essay 1: Spillover Valuation Effects of Credit Rating Changes: ‘Shoot First, Ask Questions Later’... 3
A. Abstract ... 3
B. Introduction ... 4
C. Background and Hypotheses... 8
1. Earnings Transparency ... 8
2. Return Synchronicity... 9
3. Hypotheses ... 11
D. Empirical Design ... 11
1. Sample Selection ... 11
2. Abnormal Equity Returns... 14
3. Peer Firm Characteristics ... 16
E. Empirical Results ... 19
1. Announcement Event CARs ... 19
2. Post-Announcement Event CARs ... 20
3. Uncertainty Resolution ... 22
4. Changes in Profitability ... 25
F. Conclusion ... 27
G. References ... 28
III. Essay 2: Credit Rating Initiations, Liquidity, and Seasoned Equity Offerings ... 50
A. Abstract ... 50
B. Introduction ... 51
C. Concept Development and Related Literature ... 55
1. Credit Ratings and Liquidity ... 56
2. Liquidity and Seasoned Equity Offerings ... 58
D. Data Description, Summary Statistics, and Methodology ... 59
1. Data Description ... 60
2. Summary Statistics ... 61
3. Methodology ... 63
1. Univariate Results ... 66
2. Multivariate Results ... 67
F. Empirical Results – Seasoned Equity Offerings ... 69
1. Univariate Results ... 69
2. Multivariate Results ... 72
G. Conclusion ... 76
H. References ... 78
IV. Essay 3: Social Clustering, Informal Contracting, and Firm Governance ... 96
A. Abstract ... 96
B. Introduction ... 96
C. Concept Development and Related Literature ... 103
1. Reputation Effects ... 104
2. Informal Contracting ... 107
D. Data and Variable Construction ... 109
1. Data and Variable Construction ... 109
2. Detection of Social Clustering ... 111
3. CEO-Director Clustering at Firm Level ... 115
4. Proxy for Reputation Costs ... 116
5. Other Key Variables ... 117
E. CEO-Board Clustering and Governance ... 120
1. Clustering and Governance ... 120
2. Clustering, CEO Compensation, and CEO Entrenchment ... 123
3. Clustering and Board Effectiveness ... 126
4. Clustering and CEO Turnover... 127
F. Conclusion ... 131
G. References: ... 134
1
I.Introduction
The efficacy of managers and the price setting mechanisms of financial markets are, ultimately, reliant upon the transfer and assimilation of information. Information fidelity is paramount to the functioning of efficient financial markets and to the effectiveness of firm managers. The three essays in this dissertation examine information flows through financial markets and across firms and investigate the factors affecting the processes of information dissemination. What impediments affect information flows in financial markets? Under what circumstances will restrictions on the flow of information cause price deviations from intrinsic values? How can individuals or firms mitigate the problems associated with restrictions in the transfer of information?
In the first essay, I examine the spillover effects of credit ratings changes on the intra-industry peers of the rated firm. To the extent that credit ratings contain information about the industry in which the firm operates, changes in the rating of a given firm should have valuation consequences for like firms. I analyze both the contemporaneous and long-term valuation impacts on peer firms and identify an information spillover effect on peer firms surrounding credit rating downgrades. The equity values of peer firms suffer, on average, at the
announcement of an intra-industry downgrade. Furthermore, the post-announcement spillover effects are indicative of an overreaction in the market’s response to the downgrade
announcement. Peer firms exhibit predictability in their equity returns post-announcement as a function of their relative transparency. Information induced overreaction seems to be present at the announcement of an intra-industry credit downgrade.
The second essay builds on prior literature that examines the correlation between equity liquidity and credit ratings. Traditional finance literature holds the view that liquidity is impaired
2
as a function of information asymmetry. Additionally, credit ratings have been shown to reduce information asymmetry. Using instances of new, long-term issuer credit rating initiations, I examine contemporaneous movements in stock market liquidity surrounding the announcement of the new credit rating. Controlling for contemporaneous changes in market/industry-wide liquidity by propensity matching firms who obtain a rating with those who do not, my findings show that credit rating initiations are associated with statistically significant increases in the liquidity of a firm’s equity. Additionally, managers capitalize on this price support through increased seasoned equity offering activity.
While my research primarily focuses on information propagation in financial markets, I also investigate information flows through networks of individuals. Using BoardEx, an extensive database which covers the social networks of business executives, I investigate the effects that networks impart upon firm governance. I identify “social clustering” (roughly defined as close-knit communities within a network) and study its effects on the information environment of firms and on the incentives, behaviors, and outcomes of network participants. The degree to which a CEO and her directors overlap in social communities affects the governance of the firm and that these effects are conditional upon the adverse reputation costs faced by the board. For firms whose boards face relatively lower (higher) potential adverse reputation costs to bad behavior, clustering is associated with poorer (better) governance and greater (lesser) expropriation by firm managers.
3
II.Essay 1: Spillover Valuation Effects of Credit Rating Changes: ‘Shoot First, Ask
Questions Later’1
Wayne Y. Lee and Garrett A. McBrayer
A. Abstract
Opacity hinders information efficiency. When information is asymmetric, investors use credit downgrades to infer adverse changes in the creditworthiness of similar firms in the same industry. Intra-industry cumulative abnormal equity returns (CARs) over the seven-day event window around announcements of rating downgrades from investment to speculative grade average -1.23%, and -1.30%, controlling for rating, firm characteristics, as well as year and industry fixed effects. Overreaction results when price contagion is dominated by noise trading.
CARs over three, six, and twelve-month windows starting four days after downgrade
announcements average 1.45%, 5.02%, and 5.47%, respectively. The reversals in price declines are predominantly on shares of transparent industry peers. For opaque peers, share price declines continue post announcement. Significant average increases in the return on assets, profit margin, and earnings per share of industry peers from the preceding to subsequent fiscal year around downgrade announcement years corroborate the post announcement rise in share prices. Lastly, we show that transparency is priced. Transparent firms have lower systematic risks and lower costs of capital.
JEL Classification: G14, G24
Keywords: contagion, market efficiency, credit ratings, opacity
1 We thank seminar participants at the University of Arkansas and the 2015 Eastern Finance
Association Annual meetings for their invaluable comments and suggestions. We thank especially Tim Yeager and Alexey Malakhov for their comments. All errors remain our own.
4
B. Introduction
Credit rating agencies play critical roles in alleviating informational asymmetries
between borrowers and lenders and apportioning risks in financial markets. The value of the risk certification process depends on its objectivity, informativeness, and timeliness. Credibility is uncertain when issuers pay to be rated and can shop competing rating agencies. High regulatory costs of cheap talk and reputation considerations safeguard the trustworthiness of credit signals (Ottaviani and Sorensen, 2006). To assess creditworthiness, rating agencies count on their specialized access to non-public information about firms. Regulation Fair Disclosure Act (Reg FD) enacted in 2000 preserved the selective disclosures of private information by management to certified rating agencies.2 The exclusion of equity analysts and other market participants from opportunities to obtain confidential information enhanced the informational advantage of ratings agencies. Following initial ratings, ratings agencies monitor firms for changes in
creditworthiness and the threat of adverse rating changes motivates firms to take corrective actions (Boot, Milbourn, and Schmeits, 2006). Meetings with management (at least annually) are used to review past performance, discuss potential problems, and stay apprised of future plans. Explanations regarding ratings changes, as with initial ratings, refer only to public information to ensure the confidentiality of sensitive information provided by rated firms.
Public announcements of unexpected changes in credit ratings can convey latent but economically significant revisions in the private information that ratings agencies have about firms. Moreover, because ratings agencies recognize that risk management responses to ratings changes necessitate costly portfolio adjustments, ratings changes are more likely to anticipate longer term permanent rather than volatile market-driven changes in credit risk.
2Section 102(b)(2).
5
Performance based compensation and likelihood of dismissal induce managers to
advance or voluntarily disclose good news, and delay or avoid the disclosure of bad news (Chen, Hong, and Stein, 2001). Market reactions to credit rating downgrades and upgrades are
asymmetric. Holthausen and Leftwich (1986) find significant negative abnormal equity returns on one or more rating class credit downgrades of straight debt averaging -2.66% over a two-day window ending one day after announcement.3 On credit upgrades, equity share price changes are positive, but are negligible and insignificant. Announcements of credit upgrades appear to be largely anticipated.
Jorion, Liu, and Shi (2005) examine the impact of Reg FD on the information content of credit rating changes. Their findings suggest the special exemption granted credit rating agencies to management disclosures of confidential information reduced the informativeness of prices. As Odders-White and Ready (2006) point out, firms more exposed to shocks initially observed by “insiders” will incur higher adverse selection costs that deters informed trading in equity. The rise and fall in equity share prices in reaction to credit rating upgrades and downgrades were larger and more significant post Reg FD. The exclusion of analysts and other market
professionals had a greater impact on firms with more analysts as well as larger sized firms that were more likely to make use of selective disclosures to institutional investors.4 Heflin,
Subrahmanyam, and Zhang (2003) find, however, that voluntary disclosures by firms
3For example, a change from A+, A, A- to BBB+, BBB, or BBB-. Holthausen and Leftwich (1986)
do not find significant abnormal equity returns around announcements of credit downgrades within a rating class. Hand, Holthausen, and Leftwich (1992) also find that bond and stock prices react to unexpected additions of firms to the S&P Credit Watch List. In the three-day event window around the credit watch announcement, bonds decline relative to benchmark Treasuries by -1.39%, and CRSP equally-weighted market adjusted stock returns by -1.78%.
4The authors acknowledge the limitations of their event study. Sample period was confined to the
26 months prior and subsequent to the enactment of Reg FD on October 23, 2000 that coincided with an economic recession in 2001.
6
significantly increased post Reg FD and earnings forecast accuracy (actual from consensus) was relatively unchanged. A reduction in the adverse component of the bid-ask spread post Reg FD noted by Eleswarapu, Thompson, and Venkataraman (2004) points to improved information efficiency.
Observed drifts in equity share prices post credit downgrade announcements suggest that markets are not information efficient. When rated firms have the opportunity to take corrective actions, delays in credit downgrade announcements can mislead investors about the gravity of a firm’s financial condition. Investors underestimate the longer-term real costs of financial distress associated with credit downgrades. Dichev and Piotroski (2001) find statistically significant negative abnormal equity returns of 10% to 14% in the first year, and an annualized 4% to -6% over the two and three years following credit ratings downgrades. The performance deficit is especially pronounced for firms with non-investment grade debt and small firms where analyst following and investor interest are low. A lack of transparency impedes investors’ inferences.
This study focuses on the impact of long-term issuer credit ratings downgrades by Standard and Poor’s (S&P) from investment-grade (>=BBB-) to speculative-grade (<=BB+) on similar firms in the same industry as credit-downgraded firms. Our motivation for examining these events stems, in part, from S&P’s literature on the information employed in determining
credit ratings:
"Credit ratings are forward-looking opinions about credit risk. Standard & Poor’s credit ratings express the agency’s opinion about the ability and willingness of an issuer, such as a corporation or state or city government, to meet its financial obligations in full and on time. The reasons for ratings adjustments vary, and may be broadly related to overall shifts in the economy or business environment or more narrowly focused on circumstances affecting a specific industry, entity, or individual debt issue. The likelihood of default is the single most important factor in our assessment of creditworthiness." 5
7
To the extent credit rating agencies are better informed about business and financial risks, investors will use credit downgrade announcements to infer changes in the creditworthiness of similar firms within the same industry.6 The unstructured and qualitative nature of the
disclosures and differences in transparency make it difficult, however, for investors to discriminate across firms. We conjecture that when investors are asymmetrically informed, opacity exacerbates the variability in beliefs about an asset’s fundamental value. Increased price uncertainty requires arbitrageurs to bear greater risk. The limits to informed arbitrage creates space for noise trading (Delong, Shleifer, Summers and Waldman, 1989 and 1990). An
overreaction results when price contagion at credit downgrade announcements is dominated by noise trading. The resolution of information uncertainty and resumption of informed trading following credit downgrade announcements leads to price reversals. When investors are poorly informed, the market reaction at announcement is characterized by 'shoot first, ask questions later'.
Our main findings can be briefly summarized as follows. First, we document significant negative intra-industry cumulative abnormal equity returns over the three-day to seven-day event windows around announcements of credit rating downgrades from investment to speculative grade. Intra-industry equity price declines are notably greater when the credit downgrades are unexpected, and only slightly smaller, the more severe is the competitive impairment of the credit downgraded firm.
Second, cumulative average abnormal equity returns on transparent industry peer firms
6Previously unknown future changes in business and financial risk factors may be implied in
credit downgrade announcements. Business risk factors include country risk, industry condition, competitive position, business and geographic diversification, management, regulatory
environment and strategy. Financial risk factors include capitalization, leverage, earnings, funding, liquidity, cash flow, risk management, and accounting.
8
are less negative than on opaque industry peer firms. At best, however, a small percentage of transparent peer firms avoid a negative cumulative abnormal equity return at credit downgrade announcements. Investors overreact to potential adverse changes in the creditworthiness of similar firms in the same industry as credit-downgraded firms.
Third, we find significant positive intra-industry cumulative abnormal returns in the six-month and one-year event windows post announcement. Share price declines at credit
downgrade announcements are reversed for transparent peer firms but continue their decline for opaque peer firms post announcement as information uncertainty is resolved and informed trading resumes. Taking the Fama-French (1993) and Carhart (1997) momentum asset pricing factors into account, more transparent firms have lower systematic risks and lower cost of capital. Transparent firms experience higher profitability in the year post-announcement.
The remaining sections of this paper are organized as follows. Section 2 reviews related literature and presents our hypotheses. Section 3 describes the data used for our analysis and our empirical design. Section 4 reports and discusses the spillover valuation effects at announcement and post-announcement. Robustness tests are presented in section 5. Section 6 concludes.
C. Background and Hypotheses 1. Earnings Transparency
Barth, Konchitchki, and Landsman (2013) argue that earnings transparency reflects the extent to which earnings disclosures are credible public signals about the fundamental value of firms. Lower uncertainty about intrinsic asset values diminishes the return investors require. The reduced cost of capital increases firm value. Investors will seek private information when the predictive content of earnings about firm value is poor, however, acquisition costs can be high when firms are complex entities. Moreover, gains to informed trading require sufficient market
9
liquidity. Earnings transparency will remain important in mitigating the informational asymmetry between inside managers and outside investors.
The sum of explanatory powers ( 2
R ) from a two-step estimation procedure of the returns-earnings relation capture the intertemporal industry and industry-neutral cross-sectional variations in earnings transparency. A significant negative relation between earnings
transparency and subsequent excess and portfolio mean returns is documented. Taking Fama-French (1993) and Carhart (1997) momentum asset pricing factors into account, firms with more earnings transparency enjoy a lower cost of capital.
2. Return Synchronicity
Earnings as signals of economic value have limitations. Reporting standards and adoption can differ across firms as well as change over time. Earnings are historical rather than forward-looking. Innovation, expansion, acquisitions or divestitures can alter a firm’s business and earnings power. The quality and clarity of disclosures can vary by firms as well. Last but not least, differences in performance based incentives influence when, what, and how managers exercise discretion.
Roll (1988) notes the extent to which stock returns move together will reflect macroeconomic, industry, as well as firm-specific factors. He finds however that firm size, industry, and the impact of unique industry or firm-specific news cannot explain the low degree of co-movement ( 2
R ). Low return synchronicity, he concludes, can be due to “either the
existence of private information or else occasional frenzy unrelated to concrete information (p.56)”.
Morck, Yeung, and Yu (2000) find that emerging markets exhibit highly synchronous stock price movements. Moreover, return synchronicity is not related either to the size of the
10
stock market or economy. Rather, the inadequate protection of property rights makes informed risk arbitrage unattractive. And as Delong, Shliefer, Summers, Waldmann (1989 and 1990) show, the reduction in informed trading can increase market-wide noise trading. Further, in countries that provide poor investor protection from corporate insiders, e.g. from earnings expropriation or risk-shifting behaviors, can render firm-specific information less useful. The reduction in firm-specific information in stock prices increases stock return synchronicity.
Durnev, Morck, Yeung, and Zarowin (2003) confirm that high firm-specific return variation as a fraction of total variation signals more informative stock prices. Regressions of current stock returns against future earnings are estimated to infer how much information stock prices contain about future earnings. Aggregated coefficients on future earnings and the marginal variation of current stock returns explained by future earnings capture the informativeness of stock prices. They find that firms and industries with lower market model R2exhibit higher association between current stock returns and future earnings. Markets are more information efficient.
Jones, Lee, and Yeager (2012a) argue that opacity exacerbates the variability in beliefs about an asset’s fundamental value. Increased price uncertainty requires arbitrageurs to bear greater risk. The limits to informed arbitrage creates space for noise trading (Delong, Shleifer, Summers and Waldman, 1989 and 1990) that engenders positive feedback loops where the misconceptions of noise traders can prolong deviations of price from fundamental value. The inability of investors to discriminate across firms leads to return synchronicity (Roll 1998; Morck, Yeung, and Yu, 2000; Durnev, Morck, Yeung, and Zarowin, 2003). Investors use the information revealed about a specific firm to update their price expectations of similar but opaque firms. Using bank merger announcements, Jones, Lee, and Yeager (2012b) find that
11
between 2000 and 2006, revaluations of banks not involved in the mergers were higher for more opaque banks. The most opaque non-merger banks with the highest revaluations prior to the financial crisis also experienced the largest price declines in the 2007-2008 financial crisis.
Further, the “separation of brains and capital” (Shleifer and Vishny, 1997) weakens the effectiveness of market discipline. Jones, Lee, and Yeager (2012b) find that valuation discounts associated with investments in opaque assets fell in the period 2000 to 2006. The fall in the required returns increased risk-taking in the years preceding the 2007 financial crisis. The resulting rise in return synchronicity, which peaked in 2007, created systemic risk.
3. Hypotheses
In this study, we conjecture that opacity impairs information efficiency. Investors will use public disclosures of credit downgrades to infer future changes in business and financial risks that confront similar firms in the same industry. But uncertainty about the causal risk factors that contributed to credit downgrades makes accurate assessments difficult and enables noise trading. Investors overreact to the potential adverse change in the creditworthiness of firms in the same industry as credit-downgraded firms. The contagion in equity share price declines of industry peer firms at credit downgrade announcements are reversed post announcement for transparent industry peer firms. For opaque industry peer firms, equity share price declines at credit downgrade announcements continue post announcement.
D. Empirical Design 1. Sample Selection
Our sample period starts in January 2000 and ends in December 2010. We excluded the years prior to the enactment of Reg FD in 2000. As noted earlier, a special exemption on selective disclosures of confidential information under Reg FD enhanced the informational
12
advantage of credit ratings agencies. The enactment of the Dodd-Frank Wall Street and
Consumer Protection Act of 2010 (Section 939B), however, removed the special exemption from Reg FD accorded statistical rating organizations and credit rating agencies for the purpose of determining or monitoring credit ratings.7 Ending in 2010 also allowed us to examine the effects of credit rating changes in the year(s) following credit rating changes. A comprehensive list of Standard and Poor’s (S&P) credit rating changes was compiled from Bloomberg Data Services. From this list, we focused on credit rating downgrades from investment grade (>=BBB-) to speculative grade (<=BB+) and conversely for upgrades. The list of event firms were then matched to the Center for Research in Securities Price (CRSP) database to obtain equity share prices around announcements of credit ratings changes.
To alleviate problems posed by thinly traded, illiquid securities and to ensure reliable estimates of abnormal returns, we required the equity shares of event firms to be traded at least 90% of the 282 days prior to the event date and 252 days following the event date. Moreover, to avoid potential biases with serial credit ratings changes, firms with more than one credit change event within a 366-day period were removed. Credit ratings changes by differing firms that occurred within the same industry over a period less than 15 days were also eliminated. Further, to avoid the potential for confounding effects of other corporate events in our abnormal returns calculations, we excluded any event firm which also had a merger announcement in the one month preceding or following the credit rating change. Event firms with share prices below $5 were also excluded. Lastly, financial firms with two-digit SIC codes in the interval 60-69 inclusive were discarded. The final sample contains 133 downgrade events and 84
7Dimitrov, Palia, and Tang (2013) find that the increase in legal and regulatory penalties under
Dodd-Frank made optimistic ratings costlier. As a result, credit ratings agencies issued lower ratings and gave more false warnings. Downgrades that were less informative because investors rationally discounted the private information of credit rating agency analysts.
13 upgrade events.8
As in prior studies, firms in the Compustat Annual database operating in the same three-digit Standard Industrial Classification code (SIC-3) as the event firm in the fiscal year immediately preceding the year of the ratings change announcement are considered peer firms.9 Equity share prices for the 4,799 and 2,951 peer firms associated with credit downgrade and upgrade events respectively were obtained from the CRSP database. As with event firms, we required the equity shares of peer firms to be traded at least 90% of the 282 days prior to the event date and 252 days following the event date, and also that share prices of peer firms were greater than $5.
[Insert Table 1 here.]
The top panel of Table 1 reports, by year, the distribution of credit downgrade (upgrade) events, the mean number of peers, the mean CAR[-3,3] for the event firm, and the mean number of notches crossed in rating changes. As expected, macroeconomic conditions affect the frequency of credit downgrades. Credit downgrades occurred with greater frequency following the tech bubble collapse in 2000 as well as during the economic recession in 2001 and recovery in 2002 and 2003 that ensued. Credit upgrades are fewer in number and more likely in years of strong economic growth. The mean CAR for credit-downgraded event firms is negative regardless of the year and ranges from -23.16% in 2002 to -1.07% in 2007. The bottom panel of Table 1 shows considerable heterogeneity in the distribution of credit rating changes and peer firms across industries. Credit downgrades cluster in retail, machinery, and utility industries. Credit upgrades cluster in machinery and utilities industries. The mean number of peer firms per
8Our sample selection procedure is detailed in Appendix B.
9In unreported, random sample checks, we find the SIC codes given by Compustat better reflect
the parent firm’s SIC designation. However, our results are robust whether we use Compustat
14
industry are highest in the oil, machinery, cars, and utility industries and are lowest in
transportation, construction, and clothing industries. On average, the number of peer firms in credit downgrades are roughly one-third less than in credit upgrades.
[Insert Table 2 here.]
Table 2 presents the pattern of credit upgrades and downgrades in our sample. The rows and columns of the matrix are the credit ratings of the event firms before and after the change, respectively. The numbers of ratings changes meeting the pre and post rating level are reported in the cells. For both upgrades and downgrades, the majority of credit change events involve a one-notch change across rating categories; e.g. from BBB- (BB+) to BB+ (BBB-). Note, however, that approximately 48.8% of the credit downgrades span more than one than one notch, and 31.5%, for credit upgrades. Altogether the pattern of credit upgrades and downgrades as well as the distribution across industries and over time show considerable variation in credit ratings changes.
2. Abnormal Equity Returns
To compute daily abnormal equity returns, a Fama-French (1993) three-factor plus Carhart (1997) momentum factor returns model is estimated over the period 282 days to 30 days prior to announcement date.10
𝑅𝑖,𝑡− 𝑅𝑓,𝑡 = 𝛼𝑖+ 𝛽𝑖,𝑅𝑀(𝑅𝑀,𝑡− 𝑅𝑓,𝑡) + 𝛽𝑖,𝑆𝑀𝐵𝑅𝑆𝑀𝐵,𝑡+ 𝛽𝑖,𝐻𝑀𝐿𝑅𝐻𝑀𝐿,𝑡 +𝛽𝑖,𝑀𝑂𝑀𝑅𝑀𝑂𝑀,𝑡+ 𝜀𝑖,𝑡 (1)
Daily abnormal equity returns summed over three-day, five-day, and seven-day event windows around announcement yield cumulative abnormal equity returns, CAR[-1,1], CAR[-3,1] and
10Our results are robust to various methods of calculating abnormal returns including a simple
market adjustment, a one-factor market model, as well as a Fama-French (1993) three-factor returns model.
15
CAR[-3,3].11 We use two proxies for the news content of credit rating changes. Event Firm CAR[-3,3]is the seven-day cumulative abnormal return of the credit ratings change firm at announcement. As in Holthausen and Leftwich (1986), Notches is a categorical variable that reflects the severity of the credit downgrade by the numerical drop in rating steps. For example, a ratings change from BBB- BB+ BB generates a Notches value of -2. Summary descriptive statistics are reported in Table 3.
[Insert Table 3 here.]
CARs at announcement for credit downgraded and upgraded firms reported in the top panel of Table 3 are consistent with Holthausen and Leftwich (1986) and Dichev and Piotroski (2001). Credit-downgraded firms experience significantly negative abnormal equity returns. The mean CAR[-1,1], CAR[-3,1] and CAR[-3,3] are -5.26%, 6.89%, and -7.59% respectively; and, median CARs, are -2.13%, -2.82%, and -2.54% respectively. For upgrades, mean CAR[-1,1],
CAR[-3,1] and CAR[-3,3] are positive, but are only significant in the three-day and five-day event windows and are much smaller in magnitude than for downgrades. Median CARs are not statistically significant.
Announcement CARs for peer firms exhibit a similar pattern. For credit ratings
downgrades, mean (median) CAR[-1,1], CAR[-3,1], and CAR[-3,3] of -0.70% (-0.27%), -1.01% (-0.45%), and -1.09% (-0.44%), respectively are negative and statistically different from zero at better than the 1% level. For credit upgrades, mean and median CARs are considerably smaller in magnitude than for downgrades and largely indistinguishable from zero.
Credit ratings upgrades are largely anticipated. Regressions of peer firm CARs on event firm CARs and Notches with fixed effects for year and industry corroborate that spillover
11We also allowed our event window to range from as much as 10 days prior to 5 days after the
event and found that our results remain qualitatively unchanged.
16
valuation effects are more significant for credit downgrades than credit upgrades. The
information contagion is greater the more adverse is investor reaction to the credit downgrade. Peer firms benefit more when the competitive impairment of credit-downgraded firms is severe. From here on, we focus our analysis on credit ratings downgrades from investment to speculative grade.12
The remainder of Table 3 examines announcement returns around credit rating
downgrades within investment grade and within speculative grade. Two key findings should be noted. First, our results support the findings of Jorion and Zhang (2010). Intra-industry
revaluations at credit downgrades within investment grade reflect information contagion, and competitive effects for credit downgrades within speculative grade. Secondly, peer firms exhibit statistically significant, negative CARs at credit downgrades within investment grade. But as the regression results show, average CARs though negative are statistically insignificant when event firm CARs and Notches with fixed effects for year and industry are taken into account.
3. Peer Firm Characteristics
To examine how opacity impacts information efficiency, we construct proxies for the transparency of peer firms. As Roll (1998), Morck, Yeung, and Yu (2000), and Durnev, Morck, Yeung, and Zarowin (2003) argue, higher firm-specific return variation as a fraction of total variation implies a more informative equity share price. We use R2 from a Fama-French (1993) three-factor plus Carhart (1997) momentum factor returns model estimated over the period 282 days to 30 days prior to the event date to capture the return synchronicity of peer firms. We compute Return Synchronicity, as the difference between the peer firm’s R2 and the
12In unreported analysis, we repeat all our subsequent tests on the sample of credit-upgraded
firms and find no consistent announcement or post-announcement spillover valuation effects on peer firms.
17
median across all peers in the same event, to proxy for the informativeness of price. Peer firms are relatively more opaque (transparent) when their Return Synchronicity is positive (negative).
As a second measure of transparency, we also compute earnings transparency following Barth, Konchitchki, and Landsman (2013) as the summation of two R2. The first R2 is obtained from an earnings-returns relation regression shown in (2) estimated for each year (t = 2000, …,
2010) and for each Fama-French 17 industry. 𝑅𝐸𝑇𝑖,𝑗,𝑡 = 𝛼0𝐼 + 𝛽
1𝐼𝐸𝑖,𝑗,𝑡⁄𝑃𝑖,𝑗,𝑡−1+ 𝛽2𝐼∆𝐸𝑖,𝑗,𝑡/𝑃𝑖,𝑗,𝑡−1+ 𝜀𝑖,𝑗,𝑡 (2)
Subscripts i, j, and t denote firm, industry, and year, respectively. 𝑅𝐸𝑇 is the annual equity return of a firm measured beginning three months after the firm’s fiscal year end, 𝐸𝑡/𝑃𝑡−1 is the
earnings before extraordinary items and discontinued operations scaled by the beginning of year price, and ∆𝐸 is the change in earnings from year t-1 to t. Coefficients in (1), 𝛼0𝐼, 𝛽1𝐼, and 𝛽2𝐼 , are the same for firms within industry j in year t. R2 in (2) captures the industry variation in returns in response to permanent and transitory components in earnings.
The magnitude of the residuals in the industry-year regressions (2) are then used each year to sort firms in each industry into quartiles to form portfolios p (p = 1, …, 4). Portfolios 1 and 4 have the largest negative and largest positive residuals respectively. A second earnings-return regression shown in (3) is estimated for each year and each portfolio.
𝑅𝐸𝑇𝑖,𝑝,𝑡 = 𝛼0𝐼𝑁+ 𝛽
1𝐼𝑁𝐸𝑖,𝑝,𝑡⁄𝑃𝑖,𝑝,𝑡−1+ 𝛽2𝐼𝑁∆𝐸𝑖,𝑝,𝑡/𝑃𝑖,𝑝,𝑡−1+ 𝜀𝑖,𝑝,𝑡 (3) R2 in (3) captures the temporal variation in the industry neutral component of earnings
transparency.
For each peer firm, Earnings Transparency, is the sum of their R2 from (2) and (3).
Higher values of Earnings Transparency are associated with greater firm transparency. As with return synchronicity, we subtract the median earnings transparency of all peers in the same event.
18
Positive (negative) values are associated with more transparent (opaque) peer firms.
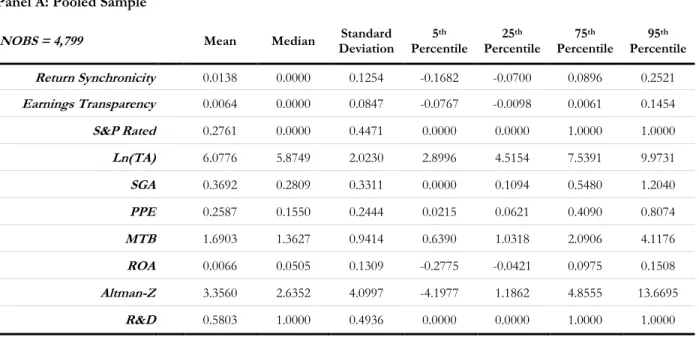
Investor assessments of changes in creditworthiness from credit downgrades can differ between rated and unrated peer firms. Alissa, Bonsall, Koharki, and Penn (2013) use the log of total assets (Ln(TA)), sales and general administrative expenses scaled by revenue (SGA), asset tangibility (PPE), market-to-book (MTB), return on assets (ROA), solvency (Altman-Z), as well as research and development expenses scaled by total revenue (R&D), as surrogates for expected credit ratings.13Table 4A reports descriptive statistics for our sample of peer firms.
[Insert Table 4 here]
Median values for firm transparency, Return Synchronicity and Earnings Transparency, are zero by construction but show considerable heterogeneity. Return Synchronicity ranges from -0.3947 to 0.5670, and Earnings transparency, from -0.4064 to 0.7614. Approximately 27.6% of our sample of peer firms are rated by S&P.
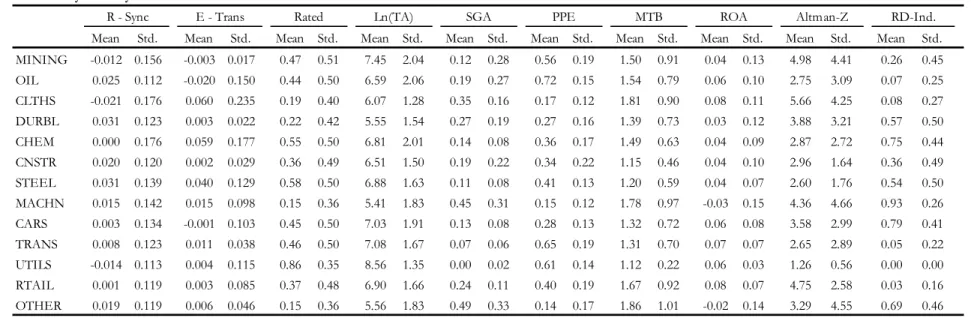
Table 4B presents summary statistics by Fama-French 17 industries. The clothing industry is the most transparent industry with the lowest Return Synchronicity and highest Earnings Transparency. The most opaque industries are durables and steel with the highest Return Synchronicity, and oil, with the lowest Earnings Transparency. The percentage of peer firms with S&P rating is highest and lowest in the utilities and machinery industries.
Table 4C presents the Pearson (below diagonal) and Spearman rank correlations (above diagonal). Return Synchronicity and Earnings Transparency are negatively but not significantly rank correlated. The transparency measures capture distinct factors that contribute to information asymmetry.14 Earnings Transparency reflects the quality of public disclosures by firms to
13Variable definitions are provided in appendix A.
14For Pearson correlation, t-statistic = 𝜌/𝑠𝑞𝑟𝑡[(1 − 𝜌2)/(𝑁 − 2)] is distributed Students t with
19
investors. Return Synchronicity reflects the private information that investors have about the intrinsic values of firms.
Significant negative and positive correlations with Return Synchronicity and Earnings Transparency suggest that peer firms with high SGA tend to be more transparent. Peer firms that are larger, with higher asset tangibility and profitability, are more likely to be S&P rated.
Conversely, peer firms with higher SGA, growth opportunities, solvency, and R&D expenditures are less likely to be S&P rated.
E. Empirical Results
1. Announcement Event CARs
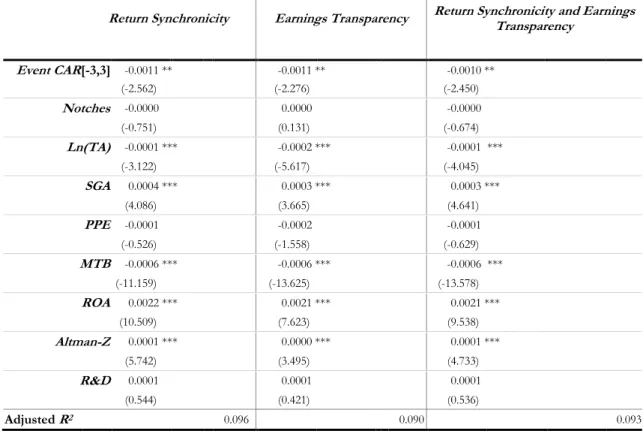
Table 5 reports the results of cross-sectional OLS regressions of peer firm CAR[-3,3] with fixed effects for year and industry and robust standard errors clustered by industry. In these regressions, Return Synchronicity and Earnings Transparency examine the effects of opacity.
The impact of S&P rating, Event FirmCAR[-3,3] and Notches, as well as the characteristics of the peer firms are taken into account.
[Insert Table 5 here]
Across model specifications, there is a significant negative intra-industry average CAR [-3,3] of about 1.24% at credit downgrade announcements. The share price decline corroborates an earlier finding in Table 3. Investors infer meaningful adverse changes in the creditworthiness of similar firms in the same industry.
The significant negative coefficient on Return Synchronicity and significant positive coefficient on Earnings Transparency show that share price declines are notably lower (higher) for transparent (opaque) firms. However, at best a small percentage of peer firms avoid a negative CAR[-3,3] at credit downgrade announcements. A one standard deviation change in
20
ReturnSynchronicity and Earnings Transparency implies about a -0.56% and 0.14% change in
CAR[-3,3]. Given an average negative CAR[-3,3] of 1.24%, even peer firms whose Return Synchronicity are two standard deviations lower than median will experience a share price decline.
Credit downgrade announcements exacerbate investor beliefs about the creditworthiness and intrinsic value of similar firms in the same industry. Increased uncertainty and limits to arbitrage enables noise trading. On balance, investors overreact to potential adverse changes in creditworthiness of peer firms at credit downgrade announcements.
Further, at credit downgrade announcements, investors do not discriminate between S&P
rated and unrated peer firms. Coefficients on S&P Rated and Investment Rated are positive but mainly insignificant. The positive significant Event CAR[-3,3] coefficient suggests information contagion is greater the more adverse is investor reaction to the credit downgrade. A one standard deviation change in Event CAR[-3,3] results in about a 1.66% change in CAR[-3,3]. Moreover, the negative significant Notches coefficient implies that peer firms benefit more when the competitive impairment of credit-downgraded firms is severe. The competitive effect is, however, small in magnitude. A one standard deviation change in Notches results in about a -0.28% change in CAR[-3,3].
Lastly, share price declines are significantly smaller for peer firms that are more
profitable (ROA) and have lower SGA. A one standard deviation change in profitability and SGA
results in about a 0.76% and -0.17% change in CAR[-3,3].
2. Post-Announcement Event CARs
To examine intra-industry post-announcement cumulative abnormal returns, we compute CARs over three-month, six-month, and one-year event window: CAR[4,68], CAR[4,130], and
21
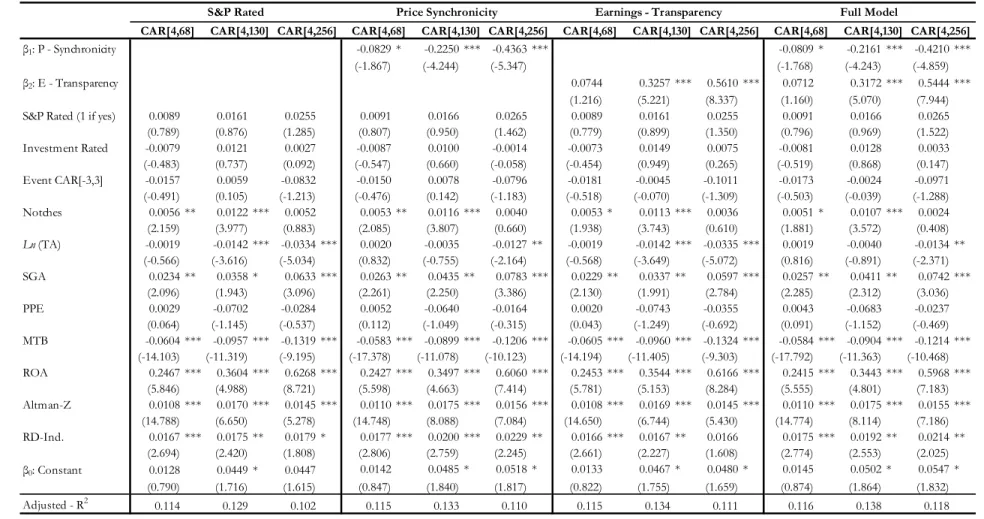
CAR[4,256]. Table 6 reports the results of cross-sectional OLS regressions of peer firm post-announcement CARs with fixed effects for year and industry and robust standard errors clustered by industry. In these regressions, Return Synchronicity and Earnings Transparency examine the effects of opacity. The impact of S&P rating, Event FirmCAR[-3,3] and Notches, as well as the characteristics of the peer firms are taken into account.
[Insert Table 6 here]
Significant negative Event FirmCAR[-3,3] at credit downgrade announcements are reversed post announcement. Across model specifications, three-month CAR[4,66] is a positive though insignificant 1.4% average. Six-month CAR[4,130] rises to a significant positive 4.7% average. Twelve-month CAR[4,130] evens out at a significant positive 4.9% average. Informed trading post announcement corrects investor overreaction at announcement.
The negative significant Return Synchronicity and positive significant Earnings Transparency coefficients indicate the reversal primarily benefit transparent peer firms. Share price declines continue for opaque peer firms with higher than median ReturnSynchronicity and lower than median Earnings Transparency. A one standard deviation change in Return
Synchronicity and Earnings Transparency implies about a -2.76% and 2.72% change in
CAR[4,130] and about a -5.37% and 4.68% change in CAR[4,256]. Given an average negative
CAR[4,256] of 4.9%, opaque peer firms whose Return Synchronicity or Earnings Transparency
are one standard deviation higher or lower than median will experience a share price decline post-announcement.
The information contagion associated with credit downgrades are fully reflected in Event FirmCAR[-3,3]. The benefits to peer firms from the competitive impairment of
22
correlation table in Table 4C, coefficient signs on significant firm characteristics suggest that post-announcement returns are higher for unrated and more creditworthy peer firms. The former are smaller in size (Ln(TA)), high SGA, high solvency (Altman-Z), and invest in R&D. The latter are lower growth (MTB) and higher profitability (ROA).
3. Uncertainty Resolution
Post-announcement abnormal equity returns are computed on the assumption that systematic risk (beta) exposures estimated in the pre-announcement period remain unchanged following credit downgrades. But heightened uncertainty about the creditworthiness and intrinsic value of similar firms in the same industry as credit-downgraded firms may raise investors’ perceptions of systematic risks. Positive post-announcement CARs may simply reflect a latent change in systematic risk (beta) exposures.
We conjecture, however, that information uncertainties are gradually resolved post-announcement. The release of quarterly earnings reduces the informational asymmetry between firms and outside investors. When Earnings Transparency is high (low), disclosures are
informative about the creditworthiness and intrinsic values of peer firms. Further, credit downgrade announcements that intensity investor uncertainties also enhance the incentives to acquire private information. Share price changes post announcement are more likely to signal informed trading.
We examine our conjecture in an asset pricing framework. At each event, peer firms are assigned into quartiles sorted by their values of ReturnSynchronicity, Earnings Transparency, and summed ranks on ReturnSynchronicity and Earnings Transparency. ReturnSynchronicity
and Earnings Transparency are both estimated in the pre-announcement period. By each measure of transparency, peer firms sorted into portfolios 1 to 4 represent the least transparent
23 and most transparent respectively across all events.
Using a Fama-French (1993) three factor and Carhart (1997) momentum factor returns model, we estimate seemingly unrelated regressions (Zellner, 1962).
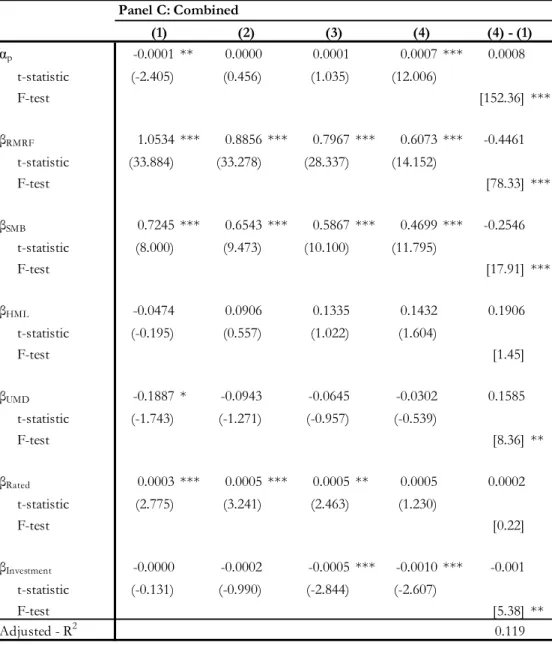
𝑅𝑖𝑡− 𝑅𝑓𝑡 = 𝛼𝑝+ 𝛽𝑅𝑀𝑅𝐹,𝑝(𝑅𝑀𝑡− 𝑅𝑓𝑡) + 𝛽𝑆𝑀𝐵,𝑝𝑆𝑀𝐵𝑡+ 𝛽𝐻𝑀𝐿,𝑝𝐻𝑀𝐿𝑡+ 𝛽𝑈𝑀𝐷,𝑝𝑈𝑀𝐷𝑡 + 𝛽𝑅𝑎𝑡𝑒𝑑,𝑝𝑆&𝑃 𝑅𝑎𝑡𝑒𝑑𝑖 + 𝛽𝐼𝐺,𝑝𝐼𝑛𝑣𝑒𝑠𝑡𝑚𝑒𝑛𝑡 𝐺𝑟𝑎𝑑𝑒𝑖 + 𝛽𝑍𝑍𝑖 + 𝜀𝑖𝑡 (4)
𝑖 denotes peer firms in portfolio 𝑝. Beta coefficients for peer firms differ only across portfolios. We include proxies for rating – 𝑆&𝑃 𝑅𝑎𝑡𝑒𝑑𝑖 and 𝐼𝑛𝑣𝑒𝑠𝑡𝑚𝑒𝑛𝑡 𝐺𝑟𝑎𝑑𝑒𝑖, as well as 𝑍𝑖, a vector of event and peer firm characteristics – Event CAR[-3,3], Notches, Ln(TA), SGA, PPE, MTB, ROA,
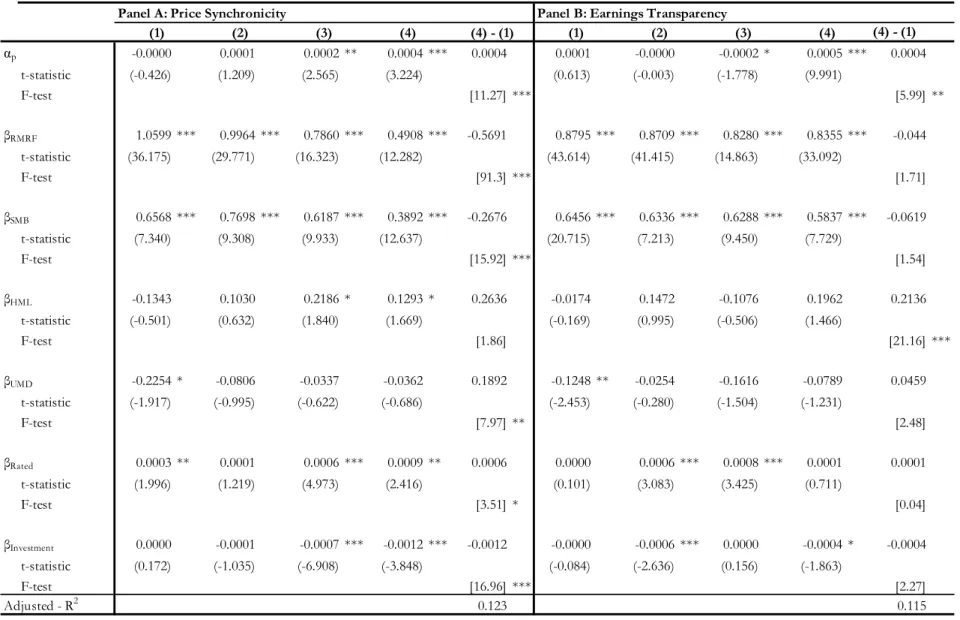
Altman-Z, and R&D. Regressions control for year and industry fixed effects and compute robust standard errors clustered by industry. In (4), 𝛽𝑅𝑀𝑅𝐹,𝑝, 𝛽𝑆𝑀𝐵,𝑝, 𝛽𝐻𝑀𝐿,𝑝, and 𝛽𝑈𝑀𝐷,𝑝 characterize the systematic risk exposures on the least to most transparent quartile portfolios across events over the one-year post-announcement event window [4,256]. 𝛼𝑝 denotes the excess risk-adjusted returns on the least to most transparent quartile portfolios of peer firms across events over the one-year post-announcement event window [4,256]. Results are presented in Table 7.
[Insert Table 7 here]
The left-hand panel of Table 7 utilize portfolios formed by Return Synchronicity. The 2 basis point abnormal daily return (alpha) on portfolio (1) with the least transparent peer firms is not significantly different from zero. As expected, daily abnormal returns increase monotonically in magnitude and statistical significance with transparency. The 8 basis point abnormal daily return on portfolio (4) is significant. Moreover, the positive difference in abnormal daily return between portfolio (4) and (1) of 6 basis points is significant at better than the 1% level (F -statistic = 17.9).
24
Further, note that systematic risks are significantly higher for opaque peer firms. 𝛽𝑅𝑀𝑅𝐹 is 1.09 for portfolio (1) and decreases monotonically to 0.51 for portfolio (4). Similarly, 𝛽𝑆𝑀𝐵 is 0.66 for portfolio (1) and declines to 0.42 for portfolio (4). A negative significant 𝛽𝑈𝑀𝐷 for portfolio (1) suggests that returns on opaque peer firms exhibit reversals rather than momentum.
Lastly, positive significant 𝛽𝑅𝑎𝑡𝑒𝑑 and negative significant 𝛽𝐼𝑛𝑣𝑒𝑠𝑡𝑚𝑒𝑛𝑡 𝐺𝑟𝑎𝑑𝑒 coefficients suggest that S&P speculative grade peer firms are more risky than S&P investment grade peer firms. S&P speculative grade peer firms tend to be opaque. S&P investment grade peer firms tend to be transparent.
The results in the middle panel of Table 7 based on portfolios formed by Earnings Transparency are qualitatively similar. The 3 basis point abnormal daily return (alpha) on portfolio (1) with the least transparent peer firms is not significantly different from zero. As in Barth, Konchitchki, and Landsman (2013), daily abnormal returns increase (non-monotonically) in magnitude and statistical significance with transparency. The 9 basis point abnormal daily return on portfolio (4) is significant. Moreover, the positive difference in abnormal daily return between portfolio (4) and (1) of 6 basis points is significant at better than the 1% level (F -statistic = 15.4).
Again, note that systematic risks are higher for opaque peer firms. 𝛽𝑅𝑀𝑅𝐹 is 0.90 for portfolio (1) and decreases monotonically to 0.86 for portfolio (4). Similarly, 𝛽𝑆𝑀𝐵 is 0.66 for portfolio (1) and declines to 0.60 for portfolio (4). A negative significant 𝛽𝑈𝑀𝐷 for portfolio (1) corroborates that returns on opaque peer firms exhibit reversals rather than momentum. Lastly, positive significant 𝛽𝑅𝑎𝑡𝑒𝑑 and negative significant 𝛽𝐼𝑛𝑣𝑒𝑠𝑡𝑚𝑒𝑛𝑡 𝐺𝑟𝑎𝑑𝑒 coefficients substantiate that S&P speculative grade peer firms are more risky than S&P investment grade peer firms.
25
middle panels of Table 7 shows a post-announcement reversal of the information contagion associated with investors’ reaction to credit downgrades consistent with a resolution of
information uncertainty. From the correlation table in Table 4C, coefficient signs on significant firm characteristics indicate that post-announcement returns are higher for unrated and more creditworthy peer firms. The former are smaller in size (Ln(TA)), high SGA, high solvency (Altman-Z), and invest in R&D. The latter are lower growth (MTB) and higher profitability (ROA).
The results in the right-hand panel of Table 7 confirm the left-hand and middle panels of Table 7. Overall, the findings support the thesis that post-announcement abnormal returns reflect a resolution of information uncertainty and informed trading. At credit downgrade
announcements, investors overreact to the potential adverse changes in the creditworthiness and intrinsic values of similar firms in the same industry. The overreactions are corrected post-announcement for transparent peer firms.
4. Changes in Profitability
Credit rating changes signal revisions in the beliefs of rating agencies about the latent intrinsic values of rated firms. Ederington and Goh (1998) find that analysts forecast declines (growth) in quarterly earnings per share prior and subsequent to credit rating downgrades (upgrades). Further, there are significant decreases in actual earnings per share prior and subsequent to credit downgrades, but insignificant increases, for credit upgrades. Similarly, Dichev and Piotroski (2001) find strongly (weakly) significant decreases (increases) in annual earnings following credit downgrades (upgrades).
In this section we examine three proxies for post-announcement changes in the
[-26
1,1], and ∆EPS[-1,1]. Each proxy is constructed as the difference in profitability between the fiscal year following and fiscal year prior to the fiscal year of the ratings change. For example, for a ratings change that occurred in fiscal year 2003, the difference is the profitability in fiscal year end 2004 and fiscal year end 2002. Variable definitions are provided in Appendix A.
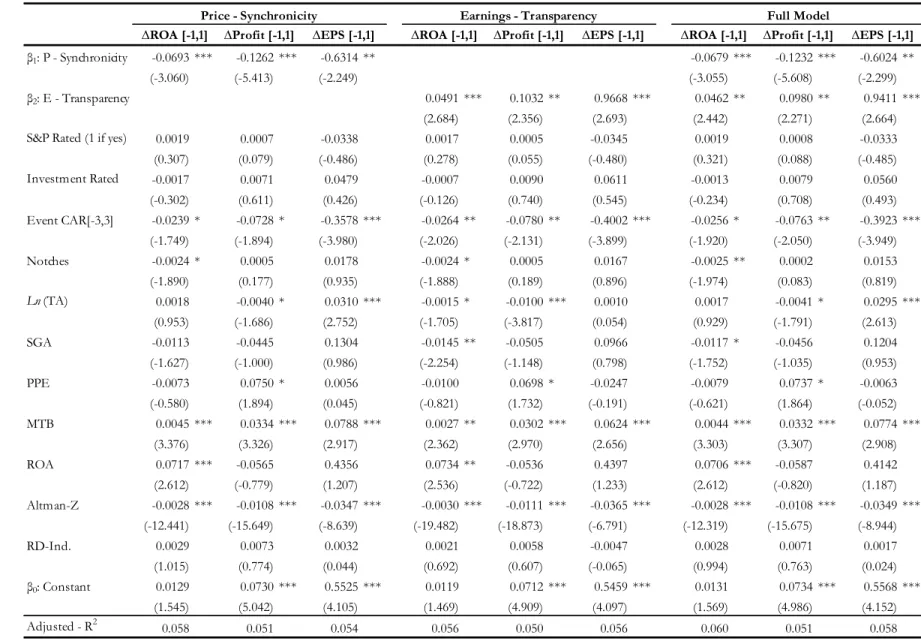
Table 8 reports the results of cross-sectional OLS regressions of peer firm post-announcement profitability with fixed effects for year and industry and robust standard errors clustered by industry. In these regressions, Return Synchronicity and Earnings Transparency examine the effects of opacity. The impact of S&P rating, Event Firm CAR[-3,3] and Notches, as well as the characteristics of the peer firms are taken into account.
[Insert Table 8 here]
Across model specifications, ∆ROA[-1,1], ∆Profit[-1,1], and ∆EPS[-1,1], average 1.2%, 7.2%, and 0.55 respectively. ∆Profit[-1,1] and ∆EPS[-1,1] are significant at better than the 1% level; ∆ROA[-1,1] is marginally significant at the 15% level. The changes in profitability are consistent with uncertainty resolution and informed trading post announcement which corrects investor overreaction at announcement.
The negative significant Return Synchronicity and positive significant Earnings Transparency coefficients indicate improved profitability post-announcement are primarily focused on transparent peer firms. Profitability declines continue for opaque peer firms with higher than median ReturnSynchronicity and lower than median Earnings Transparency. A one standard deviation change in ReturnSynchronicity and Earnings Transparency imply about a -0.86%, -1.56%, and -7.73% and about a 0.40%, 0.85%, and 8.07% change in ∆ROA[-1,1],
27
Lastly, negative and significant Event CAR[-3,3] and Notches coefficients show that the impaired competitiveness of credit-downgraded firms improve the profitability of peer firms. Post-announcement profitability is higher for high growth (MTB), and lower for more solvent (Altman-Z), peer firms.
F. Conclusion
This paper examines the spillover effects of long-term issuer credit-downgrades on similar firms in the same industry. We show the opacity of firms hinders information efficiency. Investors infer adverse changes in the creditworthiness and intrinsic values of peer firms at credit downgrade announcements. Increased uncertainty among investors about economic
fundamentals, however, limits arbitrage and enables noise trading. The inflated share price declines at credit downgrade announcements are reversed post announcement as information uncertainties about peer firms are resolved. Transparent firms benefit the most from the reduction in information asymmetry and increased informed trading post announcement.
28
G. References
Alissa, W., Bonsall, S., Koharki, K., Penn, M., 2013, Firms’ Use of Discretion to Influence their Credit Ratings, Journal of Accounting and Economics 55: 129-147.
Barth, M., Konchitchki, Y., Landsman, W., 2013, Cost of Capital and Earnings Transparency, Journal of Accounting and Economics 55: 206-224.
Boot, A., Milbourn, T., Schmeits, A., 2006, Credit Ratings as Coordination Mechanisms,
Review of Financial Studies 19: 81-118.
Carhart, M., 1997, On Persistence in Mutual Fund Performance, Journal of Finance 52: 57-82.
Chen, Joseph, Harrison Hong, and Jeremy Stein, 2001, Forecasting Crashes: Trading Volume, Past Returns, and Conditional Skewness in Stock Prices, Journal of Financial Economics 61, 345-381.
Delong, J., Shleifer, A., Summers, L., Waldman, R., 1989, The Size and Incidence of the Losses from Noise Trading, Journal of Finance 44: 681-696.
Delong, J., Shleifer, A., Summers, L., Waldman, R., 1990, Noise Trader Risk in Financial Markets, Journal of Political Economy 98: 703-738.
Dichev, L., Piotroski, J., 2001, The Long-Run Stock Returns Following Bond Ratings Changes, Journal of Finance 56: 173-203.
Dimitrov, V., Palia, D., Tang, L., 2015, Impact of Dodd-Frank Act on Credit Ratings,
Journal of Financial Economics 115: 505-520.
Durnev, A., Morck, R., Yeung, B., Zarowin, P., 2003, Does Greater Firm-Specific Return Variation Mean More of Less Informed Stock Pricing?, Journal of Accounting Research 41: 797-836.
Ederington, L.H., Goh, J.C., 1998. Bond Rating Agencies and Stock Analysts: Who Knows What When? Journal of Financial and Quantitative Analysis 33, 569–585.
Eleswarapu, V., Thompson, R., Venkataraman, K., 2004, The Impact of Regulation Fair Disclosure: Trading Costs and Information Asymmetry, Journal of Financial and Quantitative Analysis 39, 209-225.
Fama, E., French, K., 1993, Common Risk Factors in the Returns on Stocks and Bonds,
Journal of Financial Economics 33: 3-56.
Fama, E., French, K., 1997, Industry Costs of Equity, Journal of Financial Economics 43: 153-193.
29
Hadlock, C., Pierce, J., 2010, New Evidence on Measuring Financial Constraints: Moving Beyond the KZ Index, Review of Financial Studies 23: 1909-1940.
Hand, J., Holthausen, R., Leftwich, R., 1992, The Effect of Bond Rating Agency Announcement on Bond and Stock Prices, Journal of Finance 47: 733-752.
Heflin, F., Subramanyam, K.R., Zhang, Y., 2003, Regulation FD and the Financial Information Environment: Early Evidence, Accounting Review 78, 1–37.
Holthausen, R., Leftwich, R., 1986, The Effect of Bond Rating Changes on Common Stock Prices, Journal of Financial Economics 17: 57-89.
Jones, J., Lee, W., Yeager, T., 2012a, Valuation and Systemic Risk Consequences of Bank Opacity, Journal of Banking & Finance 37: 693-706.
Jones, J., Lee, W., Yeager, T., 2012b, Opaque Banks, Price Discovery, and Financial Instability, Journal of Financial Intermediation 21: 383-408.
Jorion, P., Liu, Z., Shi, C., 2005, Informational Effects of Regulation FD: Evidence from Ratings Agencies, Journal of Financial Economics 76: 309-330.
Jorion, P., Zhang, G., 2010, Information Transfer Effects of Bond Rating Downgrades,
Financial Review 45: 683-706.
Morck, R., Yeung, B., Yu, W., 2000, The Information Content of Stock Markets: Why Do Emerging Markets have Synchronous Stock Price Movements? Journal of Financial Economics 58: 215-260.
Odders-White, E., Ready, M., 2006, Credit Ratings and Stock Liquidity, Review of Financial Studies 19: 119-157.
Ottaviani, M., Sorenson, P., 2006, Reputational Cheap Talk, Rand Journal of Economics 37: 115.175.
Roll, R., 1988, R2, Journal of Finance 43: 541-566.
Shleifer, A., Vishny, R., 1997, The Limits of Arbitrage, Journal of Finance 52: 35-55. Zellner, A., 1962, An Efficient Method for Estimating Seemingly Unrelated Regressions and Tests for Aggregation Bias, Journal of the American Statistical Association 57: 348-368.
30
Table 1: Distribution of Credit Events
Sample events are long-term credit rating downgrades (upgrades) from investment (speculative) to speculative (investment) grade over the period January 1, 2000 through December 31, 2010. Peers are firms in Compustat that operate in the same three-digit SIC code as the credit rating change firm in the announcement year. Top and bottom panels report the distribution of events, average number of peer firms, average 7-day cumulative abnormal return on credit rating change firms, and average number of notches involved in credit rating changes by year and industry, respectively. Daily abnormal returns for credit change firms are computed using the Fama-French (1993) three-factor plus Carhart (1997) momentum factor returns model estimated over the period 282 to 30 days prior to announcement.
31
Table 1: Distribution of Credit Events (Cont.)
Credit Rating Downgrades
Investment to Speculative Grade Speculative to Investment Grade Credit Rating Upgrades
Year No. of Events Average Number of Peers Average Event Firm CAR[-3,3] Average No. of Notches No. of Events Average Number of Peers Average Event Firm CAR[-3,3] Average No. of Notches 2000 9 21.3 -0.0746 -1.78 7 35.1 0.0278 1.57 2001 23 56.8 -0.1040 -2.43 4 49.5 0.0194 1.75 2002 16 25.9 -0.2316 -1.88 4 18.8 0.0136 1.00 2003 22 21.6 -0.0503 -1.50 4 35.0 0.0270 1.50 2004 9 77.0 -0.0215 -1.56 8 25.4 0.0276 1.13 2005 12 15.9 -0.0470 -1.25 13 77.8 0.0016 1.31 2006 11 54.8 -0.0269 -1.64 6 73.5 -0.0048 1.17 2007 11 19.1 -0.0107 -1.82 13 43.2 -0.0085 1.31 2008 13 54.2 -0.0317 -1.31 9 23.0 0.0222 1.11 2009 5 4.4 -0.1202 -1.40 7 69.9 0.0004 1.29 2010 2 14.0 -0.0183 -1.50 9 12.8 0.0005 1.00 Total 133 36.4 -0.0759 -1.72 84 43.9 0.0089 1.26 Fama-French
Industries EventsNo. of
Average Number of Peers Average Event Firm CAR[-3,3] Average No. of Notches No. of Events Average Number of Peers Average Event Firm CAR[-3,3] Average No. of Notches FOOD - - - -MINING 2 10.0 -0.0340 -2.00 2 12.5 0.0656 2.00 OIL 4 72.0 -0.2640 -1.25 4 85.3 0.0151 1.00 CLTHS 4 6.5 -0.0112 -1.50 2 17.5 -0.0142 1.00 DURBL 7 14.3 -0.0289 -1.43 2 14.5 0.0234 1.00 CHEM 6 10.8 -0.0405 -1.00 2 12.0 0.0491 1.00 CNSUM - - - - 3 8.7 -0.0377 1.00 CNSTR 7 4.1 -0.1225 -1.71 4 4.3 0.0342 1.25 STEEL 5 16.6 -0.1536 -2.00 1 23.0 0.0779 1.00 FABPR - - - -MACHN 13 59.2 -0.0350 -1.54 16 74.3 0.0062 1.19 CARS 7 33.4 -0.0309 -1.71 4 32.3 0.0148 1.25 TRANS 5 8.4 -0.1059 -1.20 1 13.0 -0.0534 1.00 UTILS 13 32.3 -0.2134 -3.38 10 29.2 -0.0086 1.50 RTAIL 19 15.2 -0.0248 -1.47 7 18.9 0.0141 1.14 OTHER 41 60.4 -0.0588 -1.61 26 54.4 0.0084 1.35 TOTAL 133 36.4 -0.0759 -1.72 84 43.9 0.0089 1.26
32
Table 2: Credit Rating Change Matrix
This table reports the distribution of S&P long-term credit rating downgrades (upgrades) from investment (speculative) to speculative (investment) grade over the period January 1, 2000 through December 31, 2010. The rows and columns are the long-term credit ratings before and after the rating change events.
Panel A: Credit Rating Downgrades
New Rating Old Rating BB+ BB BB- B+ B B- CC C A+ 0 0 0 0 0 0 0 0 A 0 0 0 0 0 0 0 0 A- 0 0 0 0 0 0 0 0 BBB+ 4 0 0 0 0 0 0 0 BBB 14 5 3 1 0 0 0 0 BBB- 76 25 3 0 0 0 2 0
Panel B: Credit Rating Upgrades
New Rating
Old Rating AAA AA- A+ A A- BBB+ BBB BBB-
BB+ 0 0 0 0 0 0 11 63 BB 0 0 0 0 0 0 0 9 BB- 0 0 0 0 0 0 0 1 B+ 0 0 0 0 0 0 0 0 B 0 0 0 0 0 0 0 0 CCC 0 0 0 0 0 0 0 0
33
Table 3: Announcement Returns
Table reports descriptive statistics on cumulative abnormal equity returns around credit
downgrades and upgrades over the sample period January 1, 2000 through December 31, 2010. Daily abnormal returns for event (credit ratings change) firms and associated peers are computed using the Fama-French (1993) three-factor plus Carhart (1997) momentum factor returns model estimated over the period 282 to 30 days prior to announcement. Peers are firms in Compustat
that operate in the same three-digit SIC code as the event (credit rating change) firm in the announcement year. Cross-sectional OLS regressions of cumulative abnormal returns (CARs) of peers control for fixed effects by year and industry using Fama-French (1997) 17-industry classification and robust standard errors clustered by industries. Event FirmCAR[-3,3] and
Notches are demeaned by cross-sectional average. t-statistics are presented in parentheses. p -values on joint coefficient restriction tests are reported in brackets. *, **, ***, denote