Universität Augsburg
Fakultät für Angewandte Informatik Institut für Geographie
Traffic Pattern Analysis Framework with Emphasis on
Floating Car Data (FCD)
Inauguraldissertation zur Erlangung des Doktorgrades
vorgelegt von
Andreas Keler
Gutachter:
Prof. Dr. Jukka M. Krisp
Prof. Dr. Sabine Timpf
I
Acknowledgements
During the time of writing the present work, I received a lot of support and inspiration from different people. First, I would like to thank Prof. Dr. Jukka M. Krisp for his advices and for giving me the chance of writing a dissertation. His encouragement helped me in developing my research. As a result, our collaboration resulted in numerous joined publications.
Additionally, I would like to thank Prof. Dr. Sabine Timpf for exciting discussions and for supporting me at my very first presentation at an international conference (GIScience’14), where I have talked about our joined research.
Furthermore, I thank the two other examiners, namely Prof. Dr. Peter Fiener and Prof. Dr. Jörg Hähner, for their challenging questions during my examination and for respectively representing the two disciplines geography and computer science.
A special thank goes to Dr. Linfang Ding, who supported me since the supervision of my masters’ thesis, for being a nice colleague and friend. I want also to thank the second supervisor of my masters’ thesis at Technical University of Munich Dr. Stefan Peters, who recently works in Australia.
Besides Dr. Linfang Ding, I am grateful to my other former colleagues at the geoinformatics group in Augsburg. I thank Nicole Bedacht (former Karrais) for joined research resulting in my first paper acceptance and for the nice time in our vislab. The other colleague during my time in the vislab is Dr. Jean Damascene Mazimpaka, who helped me with various insights on data processing issues and technical problems. Our joined research resulted in a journal paper, for which I am very grateful. For their mental support and for numerous humorous conversations, I thank Dr. Carolin von Groote-Bidlingmaier and Dr. David Jonietz. Additionally, I thank our visiting professor Prof. Dr. Xiang Li and his wife Lina Wang from Zhengzhou Institute of Surveying and Mapping for exciting conversations and showing me a little bit more of Augsburg by joined activities.
Finally yet importantly, I thank the Keler family including my parents Johann and Elena, my brother Eugen, my sister-in-law Katrin Keler and of course my sweet little niece Nina Lucia Keler. All of you supported me during the time of finishing my dissertation.
III
Abstract
Vehicle traffic in urban environments consists of a variation of traffic phenomena. Defining and measuring these traffic phenomena is challenging, since traffic sensors can still not observe the traffic situation of one city entirely over a period of time. One possibility to get general overviews is analyzing data coming from tracked vehicle movements. In the best cases, tracked vehicles are numerous and part of vehicle fleets that represent a big proportion of traffic participants in the investigation area. Traffic data in the form of movement trajectories is producible via the Floating Car Data (FCD) technology, which uses mobile devices that allow positioning and recording on-board information in every tracked vehicle. In case of operating taxis, these devices are part of already installed dispatcher systems and are able to produce Floating Taxi Data (FTD). One type of applications with FCD and FTD consists of inferring traffic situations with numerous different computational techniques. This thesis introduces a traffic pattern analysis framework for FCD with the emphasis on detecting specific vehicle traffic patterns. The extracted patterns should define urban traffic congestion as the detectable traffic phenomenon, which is the focus of this work. In general, tracking numerous moving entities participating in traffic is part of a large body of ongoing research. By reviewing traditional traffic data acquisition techniques from different domains, this work aims to provide a connection to various research disciplines connected with research on moving objects. Those fields are coming from physics, computer science, GIScience and geography to mention a few. In contrast to traffic phenomena on highways, which are well studied, this work focus on urban traffic in highly populated cities with dense transportation infrastructure. By selecting, modifying, and applying various methodological aspects, this work shows the establishment of a traffic pattern analysis framework that allows extracting typical periodical and unusual traffic patterns for each day of the week. Traffic congestion can be seen as a daily event, since it has starting and end points, that occurs on specific rush hours of the day, but as well as traffic anomalies that are caused by different events in the urban environment. The distinguishing between different types of traffic congestion events is challenging, especially when relying on classified movement patterns from FCD, which is only a fraction of all traffic participants. The first step is to clarify the various terminologies and to associate them with respective formalizations of each appearance, as the terms road capacity and traffic bottlenecks. Additionally, there are different aspects of traffic congestion detection, which includes reasoning on FCD representations, preprocessing and analytical possibilities. The last mentioned include map matching on road segments and density-based clustering of vehicle movement. Preceding steps of the framework consist of adjusted preprocessing of the data. The following six framework techniques aim to reveal specific traffic patterns from the preprocessed FCD by different forms of representing urban traffic congestion events. The underlying computational methods of the framework enable the possibility to apply various computations as a sequence that reveal an increasing number of details on urban traffic congestion events. The results of the framework computations include mainly three different products that are subsequently inferable: congestion polygons, congestion propagation polylines (CPP) and bundles of associated road segments. The affected road segments result from previous matching between road segments and congestion polygons, or congestion propagation polylines. The evaluation of the framework outcomes consists of visual analysis methods. A test FTD set from taxis in Shanghai from 2007 serves for the framework evaluation. The results show selected parts of the urban investigation area influenced by recurrent and non-recurrent traffic congestion, which conclude to expected travel time variations during rush hours. Afterwards, the test results serve for extensive discussions on the usefulness and reasonability of the framework methods. A concluding outlook outlines ideas on future work, which mainly consists of proposed methodical extensions and finding suitable applications for the traffic pattern analysis framework.
V
Zusammenfassung
Der Fahrzeugverkehr in städtischen Umgebungen besteht aus einer Variation von Verkehrsphänomenen. Die Definition und Messung dieser Verkehrsphänomene ist eine Herausforderung, denn Verkehrssensoren können die Verkehrssituation einer Stadt immer noch nicht gänzlich über einen längeren Zeitraum beobachten. Eine Möglichkeit, allgemeine Übersichten zu erhalten, besteht aus der Analyse von beobachteten Fahrzeugbewegungen. Im besten Falle sind die beobachteten Fahrzeuge zahlreich und Teil von Fahrzeugflotten, die einen großen Anteil der Verkehrsteilnehmer im Untersuchungsgebiet ausmachen. Verkehrsdaten in Form von Bewegungstrajektorien sind produzierbar über die Technologie Floating Car Data (FCD), die über mobile Geräte Positionierung und Aufzeichnung von fahrzeugeigenen Informationen in jedem beobachteten Fahrzeug ermöglichen. Im Falle von operativen Taxis sind diese Geräte Teil von bereits installierten Dispatchersystemen und können Floating Taxi Data (FTD) produzieren. Eine Art von Anwendung mit FCD und FTD besteht darin, Verkehrssituationen mit zahlreichen verschiedenen rechnerischen Methoden abzuleiten. Diese Arbeit stellt ein Verkehrsmusteranalyse-Framework für FCD vor mit dem Schwerpunkt auf der Erkennung spezifischer Fahrzeugverkehrsmuster. Die extrahierten Muster sollten städtische Verkehrsstaus als das nachweisbare Verkehrsphänomen definieren, das im Mittelpunkt dieser Arbeit steht. Im Allgemeinen ist die Beobachtung zahlreicher bewegter Objekte, die am Verkehr teilnehmen, Teil einer großen laufenden Forschungsaktivität. Durch die Bewertung traditioneller Verkehrsdatenerfassungstechniken aus verschiedenen Forschungsgebieten soll mit dieser Arbeit eine Verbindung zu verschiedenen Forschungsdisziplinen hergestellt werden, die sich mit der Forschung von sich bewegten Objekten beschäftigen. Diese Disziplinen kommen aus Physik, Informatik, GIScience und Geographie, um nur einige zu nennen. Im Gegensatz zu Verkehrsphänomenen auf Autobahnen, die schon gut erforscht sind, konzentriert sich diese Arbeit auf den städtischen Verkehr in hoch bevölkerten Städten mit dichter Verkehrsinfrastruktur. Durch die Auswahl, Adaption und Anwendung verschiedener methodischer Aspekte zeigt diese Arbeit die Etablierung eines Verkehrsmusteranalyse-Frameworks, das es ermöglicht, typische periodische und ungewöhnliche Verkehrsmuster für jeden Tag der Woche zu extrahieren. Verkehrsstau kann als tägliches Ereignis gesehen werden, da es Anfangs- und Endpunkte hat und zu bestimmten Stoßzeiten des Tages auftaucht. Verkehrsstaus können auch Verkehrsanomalien sein, die durch verschiedene Ereignisse in der städtischen Umgebung verursacht werden. Die Unterscheidung zwischen verschiedenen Arten von Verkehrsstauereignissen ist besonders dann schwierig, wenn man sich auf klassifizierte Bewegungsmuster von FCD stützt, die nur einen Bruchteil aller Verkehrsteilnehmer ausmachen. Der erste Schritt besteht darin, die verschiedenen Terminologien zu klären und sie mit den jeweiligen Formalisierungen jedes Erscheinungsbildes zu verknüpfen, wie beispielsweise die Begriffe Straßenkapazität und Verkehrsengpässe. Darüber hinaus gibt es verschiedene Aspekte der Verkehrsstauerkennung, die Darstellung, Vorverarbeitung und analytische Möglichkeiten von FCD beinhalten. Letztgenannte beziehen sich auch auf Map-Matching mit Straßensegmenten und das dichtebasierte Clustering von Fahrzeugbewegungen. Die vorangehenden Schritte des Frameworks bestehen aus einer angepassten Vorverarbeitung der Daten. Die folgenden sechs Methoden des Framework zielen darauf ab, spezifische Verkehrsmuster aus den vorverarbeiteten FCD aufzudecken durch unterschiedliche Darstellungsformen von städtischen Verkehrsstauereignissen. Die zugrunde liegenden Berechnungsmethoden des Frameworks ermöglichen es verschiedene Berechnungen als Sequenz anzuwenden, die eine ansteigende Anzahl von Details über städtische Verkehrsstauereignisse aufdecken kann. Die Ergebnisse der Framework-Berechnungen umfassen vor allem drei verschiedene Produkte, die nacheinander ableitbar sind: Staupolygone, Stauausbreitungspolylinien (CPP) und Bündel von zugehörigen Straßensegmenten. Die
VI
betroffenen Straßensegmente resultieren aus einem vorherigen Matching zwischen Straßensegmenten und Staupolygonen oder Stauausbreitungspolylinien. Die Evaluierung der Ergebnisse der Framework-Anwendung besteht aus visuellen Analysemethoden. Ein Test-FTD-Satz von Taxis in Shanghai aus dem Jahre 2007 dient für die Evaluierung des Frameworks. Die Ergebnisse zeigen ausgewählte Teile des städtischen Untersuchungsgebietes, die durch wiederkehrende und nicht wiederkehrende Verkehrsstaus beeinflusst werden, die auf die zu den erwarteten Fahrzeitschwankungen während der Stoßzeiten rückschließen. Danach dienen die Testergebnisse für umfangreiche Diskussionen über den Nutzen und die Bedeutung der Framework-Methoden. Ein abschließender Ausblick skizziert Ideen für künftige Arbeiten, die vor allem aus methodischen Erweiterungen und geeignete Anwendungen für das Verkehrsmusteranalyse-Framework bestehen.
VII
Contents
1. INTRODUCTION ... 1
1.1 MOTIVATION –FOCUS OF THE WORK ... 3
1.2 EVENTS OF MOVING OBJECTS AND TRAFFIC PHENOMENA ... 7
1.3 HYPOTHESIS, RESEARCH QUESTIONS AND OBJECTIVES OF THE WORK ... 9
1.4 APPROACH AND METHODOLOGY ... 11
1.5 STRUCTURE OF THE THESIS ... 12
2. STATE OF THE ART ON VEHICLES AS MOVING OBJECTS – A REVIEW OF METHODS ... 15
2.1 COMPUTATION WITH DATA FROM MOVING OBJECTS ... 15
2.2 MOVEMENT AND CONTEXT – ANALYZING FIRST AND SECOND ORDER EFFECTS ... 18
2.3 TRAFFIC DATA ACQUISITION ... 20
2.4 VEHICLE ROAD NETWORKS – THEORETICAL ASPECTS AND APPLICATIONS ... 23
2.5 TRAFFIC FLOW THEORY ... 29
2.6 DEFINING TRAFFIC CONGESTION – A REVIEW ... 32
2.6.1 Theoretical background and taxonomy ... 32
2.6.2 Traffic congestion detection, classification and representation ... 36
2.6.3 Traffic bottlenecks and dynamic traffic state transitions on the road network ... 41
3. FLOATING CAR DATA (FCD) ... 45
3.1 FLOATING CAR DATA ACQUISITION – ERRORS, DATA SAMPLING AND DEVICE DEPENDENCIES ... 46
3.2 FCD FORMS OF REPRESENTATION ... 49
3.3 FCD PREPROCESSING POSSIBILITIES - A REVIEW OF METHODS ... 53
3.4 THE PARTICULARITY OF FLOATING TAXI DATA (FTD) ... 57
3.5 THE MAP MATCHING PROBLEM – STATE OF THE ART ... 60
3.6 DETECTING FCD ANOMALIES IN THE NETWORK SPACE – RESEARCH ON TRAFFIC ANOMALY DETECTION ... 64
3.7 CLUSTERING MOVEMENT - AS A DATA MINING TASK AND POSSIBLE FCD APPLICATION ... 69
4. DESIGNING A TRAFFIC PATTERN ANALYSIS FRAMEWORK FOR FCD ... 77
4.1 DESIGN SPECIFICATIONS ... 77
4.2 DATA PREPROCESSING STEPS ... 79
4.3 DATA HANDLING AND COMPUTATIONAL STEPS OF THE FRAMEWORK ... 82
4.3.1 Traffic congestion detection by global indices ... 82
4.3.2 Traffic congestion detection by shared nearest neighbor (SNN) clustering ... 83
4.3.3 Traffic bottleneck inference ... 85
4.3.4 Traffic congestion propagation by congestion propagation polylines (CPP) ... 88
4.3.5 Matching traffic phenomena on road networks ... 89
4.3.6 Traffic density estimation based on sparse FCD ... 90
VIII
5. TESTING THE TRAFFIC PATTERN ANALYSIS FRAMEWORK FOR TRAFFIC
CONGESTION IN URBAN ENVIRONMENTS ... 97
5.1 VALIDATION OF VEHICLE TRAFFIC CONGESTION MEASURES WITH FCD AND OSM OF SHANGHAI ... 97
5.1.1 Tracked taxis in Shanghai from 2007 – the SUVnet-Trace Data ... 98
5.1.2 Road network information from the OSM project as part of the transportation infrastructure ... 100
5.2 REPRESENTATION OF TRAFFIC CONGESTION AND ITS PROPAGATION WITH FLOATING TAXI DATA (FTD) FROM SHANGHAI ... 102
5.2.1 Traffic congestion detection by global index (TCD-GI) ... 103
5.2.2 Traffic congestion detection by SNN-Clustering (TCD-SNN) ... 105
5.2.3 Traffic bottleneck inference (TBI) ... 107
5.2.4 Traffic congestion propagation by congestion propagation polylines (TCP-CPP) ... 110
5.2.5 Matching traffic phenomena on road network segments (TP-MM) ... 113
5.2.6 Traffic density estimation based on sparse FCD (TDE-FCD) ... 114
6. DISCUSSION AND CONCLUSIONS ... 115
7. OUTLOOK ... 123
REFERENCES ... 125
IX
List of figures
Figure 1: Simplified overview of the FCD technique – positioning via GNSS, data upload via cell
towers and data storage. ... 2
Figure 2: Four different movement spaces ... 6
Figure 3: Selected real-world appearances of urban traffic congestions ... 8
Figure 4: Overview on the structure of this thesis ... 13
Figure 5: Four analysis levels for movement data ... 18
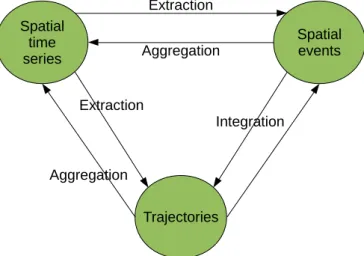
Figure 6: Transformations between different types of spatiotemporal data. ... 20
Figure 7: Different examples for traffic map views in Shanghai ... 26
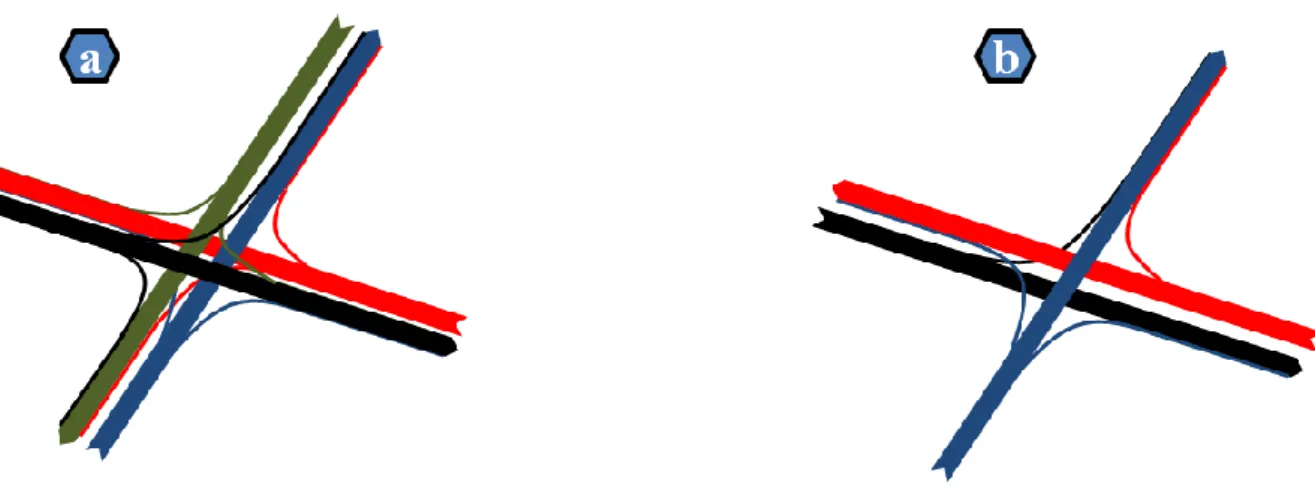
Figure 8: Example representations of the same intersection. ... 26
Figure 9: Workflow and pseudo code for detecting complicated crossings. ... 28
Figure 10: Two-dimensional trajectories within a Time-Space diagram ... 31
Figure 11: Survey results from experts about defining, and, measuring urban traffic congestion ... 33
Figure 12: Survey results from experts about accuracy of congestion measures, and, the change of urban traffic congestion. ... 44
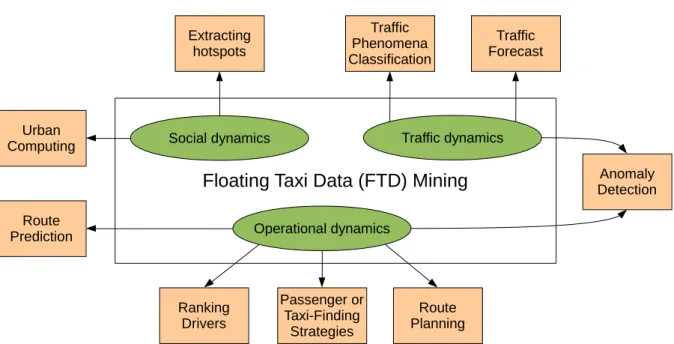
Figure 13: Classification of existing work on the analysis of Floating Taxi Data (FTD) Mining ... 58
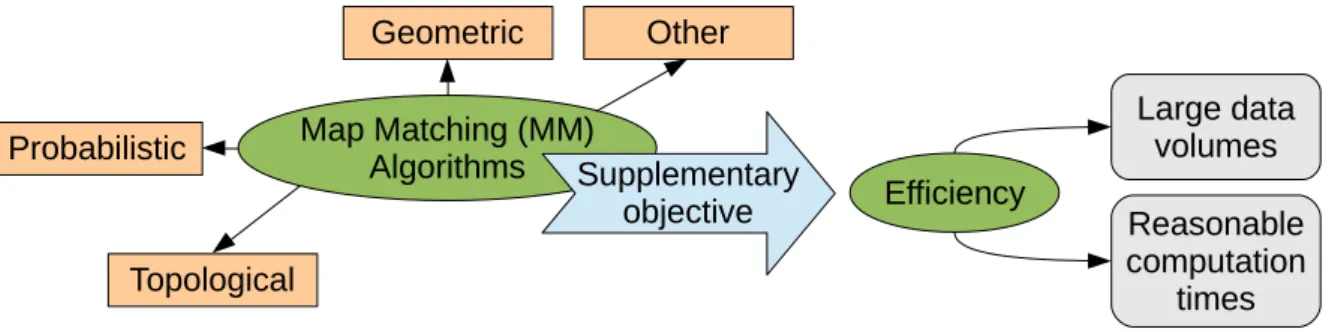
Figure 14: Grouping of available Map Matching algorithms ... 61
Figure 15: Speed profile for the middle ring road (MRR) in Shanghai for observation time of 20 minutes on one selected Wednesday in 2007. ... 66
Figure 16: Five general steps of a clustering task ... 70
Figure 17: Different groups of clustering techniques ... 70
Figure 18: Difference between next neighbors and shared nearest neighbors. ... 72
Figure 19: Group of points in space, with their convex hull and their concave hull ... 74
Figure 20: Components of the traffic pattern analysis framework for FCD. ... 78
Figure 21: Comparison of the unfiltered and filtered trajectory velocity visualization. ... 80
Figure 22: Creating congestion polygons with selecting taxi movement points of rush hours, point clustering based on similarity by SNN and creating congestion polygons. ... 84
X
Figure 23: Workflow of the approach (“TBI”) for defining complicated crossings, detecting traffic congestion and defining traffic bottleneck areas. ... 86 Figure 24: Workflow for traffic density estimation based on sparse FCD. ... 91 Figure 25: Comparison of clustered FCD points and, resulting convex hulls, representing traffic congestion events. ... 93 Figure 26: Comparison of the congestion propagation polyline (CPP) of moving polygon centroidsand, of individual taxi positions ... 94 Figure 27: Selected crossings in Shanghai classified by quality of traffic congestion (5 classes) based on taxi FCD. ... 99 Figure 28: Example for distribution plot of input information for defining global traffic congestion index values for 24 hours of FTD in Shanghai on Feb 22, 2007. ... 103 Figure 29: Example for distribution plot of the global traffic congestion index values for 24 hours of FTD in Shanghai on Feb 22, 2007... 103 Figure 30: Example of defined congestion events in the Center for Shanghai for a morning rush hour (8 to 9 AM) on the 19th of February with 6 proposed episodes. ... 105 Figure 31: Original SNN clusters for a selected 10 minute FTD partition colorized by variation in density. ... 106 Figure 32: Detected complicated crossings in the center of Shanghai, by applying the method by Krisp and Keler (2015) for OSM road network of Shanghai. ... 107 Figure 33: Congested areas, complicated crossings, and detected bottlenecks in Shanghai. ... 108 Figure 34: Geovisualization possibility for three consecutive traffic bottleneck polygons within a two-dimensional view. ... 109 Figure 35: Geovisualization possibility for three consecutive traffic bottleneck polygons within an extruded three-dimensional view. ... 109 Figure 36: Congestion propagation polylines (CPP) for the morning rush hour on February 12, 2007 with nine individual taxi drivers getting stuck in traffic congestion, and labeled CPP for the same time window with 4 individual taxi drivers getting stuck in traffic congestion. ... 111 Figure 37: Overview over created test CPP with taxi trajectories from the morning rush hour (8 to 9 AM) on February 19 with distribution of CPP in Shanghai, and the center of Shanghai with CPP showing long durations. ... 112 Figure 38: Selected example in congested areas of Shanghai for the morning rush hour with traffic congestion propagation below elevated segments, and congestion propagation at on-ramps. ... 113 Figure 39: Road network in the center of Shanghai influenced by traffic congestion events with
overlapping of traffic congestion polygons with road segments, and extracted influenced road
XI
List of tables
Table 1: Selection of introduced vehicle traffic congestion measures, mainly influenced by the listing
in Sofer et al. (2012). ... 37
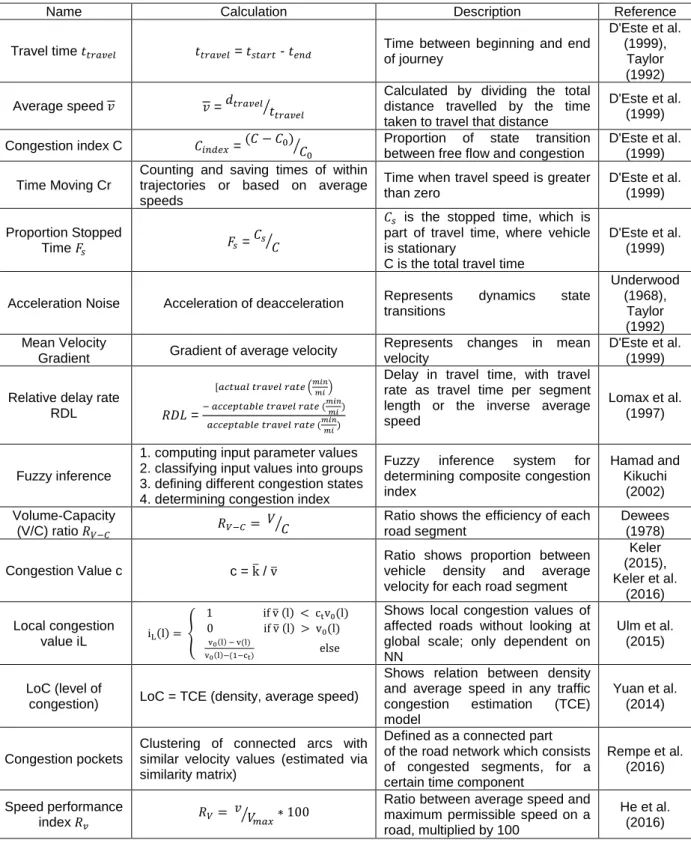
Table 2: Quantitative traffic congestion measures, proposed by D'Este et al. (1999), and complemented by others. ... 38
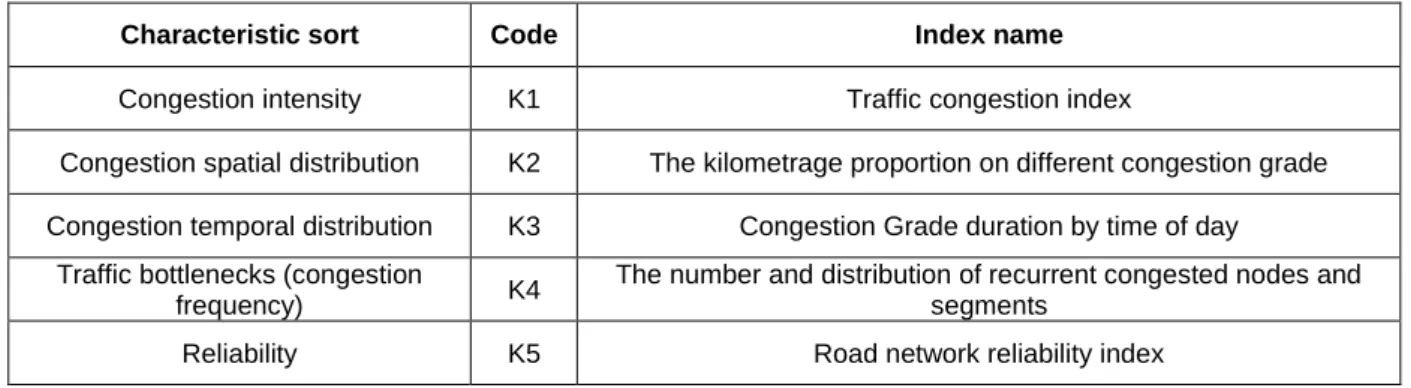
Table 3: The five traffic congestion performance measures by Sun et al. (2009). ... 41
Table 4: Possibilities of FCD constellations, proposed by Körner (2011). ... 49
Table 5: Overview on simple convex hull algorithms for a set of points in a plane. ... 73
Table 6: Shanghai taxi fare as of the year 2007. ... 98
Table 7: Data format of the SUVnet-Trace Data from February 2007... 98
Table 8: Selected 13 prominent crossings in Shanghai, with naming, coordinates and selected area identification. ... 100
Table 9: Example of selected days for estimating traffic congestion events. ... 102
Table 10: Distribution of number of records and average velocities of one day (Feb 22, 2007) of FTD from Shanghai. ... 104
XIII
List of abbreviations
CMA Computational Movement Analysis CPP Congestion Propagation Polyline
DBSCAN Density-Based Spatial Clustering of Applications with Noise FCD Floating Car Data
FTD Floating Taxi Data
GDOP Geometric Dilution Of Precision GIS Geographic Information System GIScience Geographic Information Science GNSS Global Navigation Satellite Systems GSM Global System for Mobile communications
GSM-GPS Global System for Mobile communications via Global Positioning System IoV Internet of Vehicles
ITS Intelligent Transportation Systems KDE Kernel Density Estimation
MM Map Matching
MRR Middle Ring Road (in Shanghai, China) NRC Non-Recurrent Congestion
OBD On-board diagnostics
OPTICS Ordering Points To Identify the Clustering Structure
RC Recurrent Congestion
SNN Shared-Nearest-Neighbor
T-GIS Transportation Geographic Information System TMC Traffic Message Channel
TPI Traffic Performance Index
Wi-Fi Wireless Local Area Network (WLAN) based on IEEE 802.11 standards WLAN Wireless Local Area Network
1
1.
Introduction
Society in the 2010s has many characteristics influenced by globalization through advanced communication technologies. The development of the internet, since the 1980s, pushes this advancement in many directions. We can communicate via low-cost mobile devices, increase quality of hosting services in the industries and exchange data worldwide. On the other hand, our society is seeking for more information representing dynamics of the world. Examples include the usage of positioning devices within Global Navigation Satellite Systems (GNSS), where dozens of satellites help providing information. These systems give options for detecting individual positions of moving entities on the world’s surface. Additionally, there are many Earth observation satellites with optical and non-optical sensors. They help detecting land cover changes over time, which is in this sense also observed movement.
The mentioned example of GNSS technology for monitoring multiple moving entities implies the extensive use of GNSS receivers. Due to the development of decreasing pricing of such devices, everybody is able, without high investments, to produce data of moving entities (Andrienko et al. 2013). Besides this technology, there are as well historical and other alternative sensor technologies that allow movement data acquisition, such as radar, Bluetooth, Wi-Fi positioning, Microwave telemetry or GSM-GPS (Global System for Mobile Communications via Global Positioning System). For the latter, the positioning accuracy will become even higher due to the combination of GNSS, odometry in the background of the installation of the ICARUS module on the International Space Station (ISS), which will allow the use of 5-g GPS/acceleration/magnetometer tags1. By observing the terminology of the tracked entity, one focus of this work is less on the movement of fields or surfaces like soil and water movements; it is more on tracking the movement of entities like individual animals, pedestrians, vehicles, and robots. A historical technology and data source connected with the secondly mentioned type of movement is Floating Car Data (FCD), which is data acquisition from tracked individual vehicles, of usually vehicle fleets. Each vehicle is a moving sensor. The records of these sensors result in vehicle movement trajectories, consisting of a number of positions with timestamps. The resulting data has usually the representation of an updated list showing the individual movement positions together with their instantaneous attribute values. Dependent on the tracking device, the acquisition strategy, the number of observed vehicles, the resulting size and the complexity of FCD sets can vary. In case of very large-sized and complex, in the sense of multivariate, data sets, the literature is referring to as massive movement data or massive FCD. The tracked entities of massive FCD are numerous and the positioning accuracies are relatively high, which results in expectable mass information that is difficult to handle. Due to resulting immense data sizes, there is a need of efficient algorithms for inferring reasonable information from the massive data amount (Andrienko et al. 2013). Andrienko et al. (2015) name the inferred reasonable information as spatial events. As a representation, these spatial events can have abstractions as points in a space-time continuum. In general, handling data streams of multiple moving objects for spatial event detection is challenging, since numerous individual movements are matter of inspection on a global scale (Andrienko et al. 2015). Numerous tracked vehicles may help inferring driving behavior surveys (Schuessler and Axhausen 2009), vehicle-caused air exposures and traffic qualities (Dechenaux et al. 2014). Each tracked vehicle results in movement trajectories, which are sequences of timestamped movement positions for every individual vehicle. For Treiber and Kesting (2013) vehicle movement trajectories are the most accurate representation of traffic.
1
2
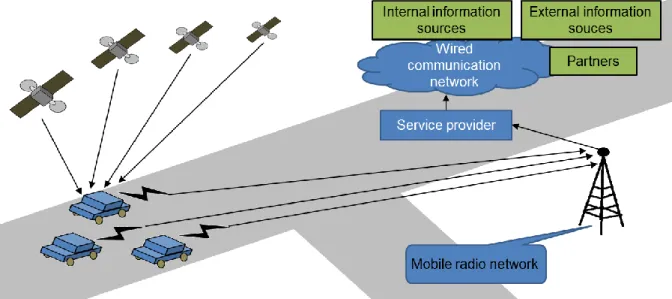
Nevertheless, trajectories of massive movement data are difficult to handle. There are many proposed methods for the task of analyzing massive movement data, which differ not only in their efficiency but also in the aims of handling the data. Approaches’ aims vary from learning periodical movement pattern detection to the derivation of individual behavior and interactions with other entities. There are many differences in applying preprocessing steps. This direction shows that the development is far from standardization or best case examples, especially when respecting positioning accuracy and quality of achievable analysis results. This might be a critical question when inspecting massive movement of tracked vehicles within complex densely built urban environments of cities in the 2010s. Against this background, it appears reasonable to invest effort for finding out the requirements of deriving representative traffic or group movement information. Specifically, the aim is detecting and describing known traffic patterns like traffic congestion events. One possibility of massive movement data collection is the mentioned data acquisition method named Floating Car Data (FCD). In case of FCD, only the vehicle is tracked and not the individual person. In many cases, resulting FCD sets often come from entire taxi fleets that have already installed tracking devices as part of a dispatcher service. The principles of Floating Car Data (FCD) are pictured in a simplified overview in Figure 1, which is motivated by Fastenrath (1997).
Figure 1: Simplified overview of the FCD technique – positioning via GNSS, data upload via cell towers and data storage.
Detecting traffic patterns from FCD is non-trivial, since tracking all vehicles, participating in the traffic is not feasible, even in the 2010s. The records might only show the trend of movement, in the same way the stream movement of a river system influences a boat; the general traffic flow of a road network system influences FCD acquisition. The system of traffic flow is relatively complex due to a changing number and variety of traffic participants and their individual driving behaviors.
FCD has varying quality. Influences on the data quality are device-dependent temporal sampling intervals (low and high sampling rates), together with the used positioning technology and the suitability of the investigation area for tracking numerous vehicles. This might be the crux for detecting and classifying certain pattern in the data. Another device-dependency is the quality of positioning, which is influencing the resulting spatial accuracy of acquired entity movements.
3
1.1 Motivation – Focus of the work
The focus of the present work is to develop suitable computational methods for gaining immediate knowledge about general traffic dynamics and congestion events within FCD sets. Besides the detection, also the representation of this information is important, especially when inspecting the data at different scales. The focus of this work is less the prediction of traffic congestion, but more its detection and representation. Therefore, the gained insight might be a starting point for calibrating a data-driven traffic learning and prediction model, in the way of a traffic forecast.
The proposed methods mainly base on computing with timestamped geodata partitioned into time series. This type of representation is nowadays an important element in different applications and object of ongoing research (Shekhar et al. 2015). The subtask of traffic congestion detection and prediction is a prominent task, since it affects millions of people every day with tremendous losses in time, money, and energy. An example, which shows the importance of traffic information, is coming from Los Angeles, where 1,800 interconnected static traffic sensors with a high cost investment and maintenance are used to describe continuously the city’s traffic situation2.
On the other hand, numerous tracking technologies emerge from movement acquisition via mobile sensors. In many cases, movement of an entity has the representation as a trajectory (Treiber and Kesting 2013), which means that a chronologically series of spatial positions with time stamps is produced. The acquired knowledge from trajectory data mining is useful in different application domains (Mazimpaka and Timpf 2016a). Moving object data are prevalent in many domains (Van de Weghe et al. 2006) and have often inherently imprecise location information (Laube 2001).
Since moving objects refer to any kind of moving entity, there are differences between groups of entities, as for example tracked vehicles. The data coming from tracked vehicles is, since the late 1990s, often referred to as probe data or as more specific Floating Car Data (FCD).
When tracked entities are vehicles, literature refers to its acquisition technology and resulting data as Floating Car Data (FCD). This acquisition technology and data has various connections to the domain of traffic engineering. Mobile tracking technology allows different insights into traffic conditions, which was not possible with data coming from static tracking devices such as induction loops. By definition of Cohn and Bischoff (2012), FCD may be produced by different sensors. The most frequently used sensors for creating FCD sets are GNSS receivers (Zhang et al. 2011d, An et al. 2016). Besides these, mobile phones (e.g. A-GPS) and Bluetooth3 can generate FCD. For the data acquisition, each tracked vehicle of a fleet can have differently built FCD devices, which allow the recording of instantaneous values from on-board vehicle sensors. On-board diagnostics (OBD) allow recording instantaneous speeds, acceleration and other information. BMW terms the outcomes of these acquisitions extended FCD or xFCD (Huber et al. 1999).
Application examples of FCD from the domain of traffic engineering include methods that connect analysis results with the traffic flow theory, traffic dynamics and parameters, and the estimation of different travel times (Treiber and Kesting 2013).
An often-mentioned aim of using this technology is the development of services towards intelligent transportation systems (ITSs), which describe technically more reliable and adapted services compared to classical and historical. Many different research domains are working with FCD. Some of the recent
2
http://www.forbes.com/sites/jonbruner/2012/01/25/how-los-angeles-keeps-traffic-moving-through-4114-stoplights/
3
Universidad Politécnica de Madrid. (2015, June 16). Traffic monitoring though detecting Bluetooth devices on vehicles.
4
approaches use classical GIS methods for data analysis. Geoinformatics is for Raper and Livingstone (2001) a connection between physical and human geography. In their, very geographical, point of view, geodata representations are mentioned as conceptualized geographic entities. This allows connecting applications from historically subdivided groups of Geography. Fifteen years later, GIScience is a relatively known domain, which stands between Earth science and computer science, but has its own individual historical background. Additionally, Gudmundsson et al. (2012) introduce the term computational movement analysis, which represents an ongoing research direction of different research domains. One important ongoing topic of this group of the GIScience community is the modelling and representation of moving objects. This comes along with more and more available tracked movement data, as for example from Chinese taxi services (Liu et al. 2012a). This development appeared relatively suddenly and results from increasing positioning accuracies4 and decreasing pricing of the used sensors. From the end of the 1990 to the early 2010, the situation on geodata availability was ranging from not enough data to massive data, which is difficult to handle. Besides GIScience, there are many working groups from transportation engineering, which work with FCD, especially in the context of connecting this information with classical data coming from static traffic counter devices such as induction loops. In general, it is possible to distinguish between the issues affecting the traffic detection from the direction of data quality (sensor and acquisition geometry specific issues) and from vehicle traffic theoretical models. The first direction includes reasoning on the data quality; in case of inspecting FCD a recorded vehicle trajectory might be affected by two types of errors: measurement error and interpolation error (Ranacher et al. 2016b). For Ranacher et al. (2016a), both types of error influence the calculation of movement parameters. This connects vehicle traffic theoretical models, mainly from the basics of mechanics and in particular traffic physics (Kerner 2004) and the physics of traffic congestion (Takashi 2002). The later implies knowledge of data acquisition methods and therefore makes reconstructions of past vehicle movements possible. There is a connection between the quality of this kind of prediction and the mentioned measurement and interpolation errors. When inspecting interpolation of spatial positions of movement, there is a focus on the sampling interval of the created FCD sets. This means there is a device-dependency when interpolating movement. This factum is a key issue in designing a traffic pattern analysis framework with emphasis on FCD. Especially the spatial interpolation error, which results from trajectory interpolation methods, has no mentioning in the literature, together with available test scenarios or any comparable inspections. Additionally, there are no available research on testing the connection of calculated movement parameters with temporal sampling strategies as stated by Ranacher et al. (2016a).
Concerning the topic of computing traffic parameters, a central aspect is the space of inspected movement. Here the connection to Map Matching (MM) methods, namely those techniques for matching tracked positions of a moving entity to the underlying road network, is clearly visible. It is difficult to apply those techniques, especially when vehicles are tracked with low sampling rates (Zeng et al. 2016), which might be device-dependent and not only dependent on the positioning technology. Depending on the way of how to connect tracked vehicle positions with traversed road segments, the computed traffic parameter might greatly vary in their values and reliability. Besides using knowledge from the general development in analyzing movement data of moving entities, reviewing the research on FCD in the context of transportation engineering is also important.
The presented approach has its motivation by previous and ongoing research coming from the data mining domain, originating from computer science, and partially from computational geometry, originating from mathematics. The connection to data mining results from the aim of detecting
4
5
patterns within the data automatically. In connection to this work, patterns within the data are traffic phenomena within individual vehicle movements. The base for data mining of movement data is the representation of movement as a series of discrete moving objects. The defined patterns for traffic phenomena are usually abstractions of the real world with specific geometrical appearances. These abstractions of movement in geospace are defined as points, lines or areal polygons with connected time components. Galton and Duckham (2006) mention that the area occupied by points can be aggregated or abstracted in many different ways. Additionally to this, the inspected objects in this work that form time-varying geometric abstractions. The temporal variations of these abstractions affect the shapes and other non-geometrical attributes.
The focus of this work is to introduce understandable and reproducible computational methods for detecting traffic situations and patterns, without the knowledge of investigation areas or used FCD. A traffic pattern has to consist of certain quality measure or attribute value at selected locations with temporal information as time of appearance and periodicity. The knowledge of the underlying road networks and its representation as features is not necessarily a precondition of the framework. One further aim is to produce results for further analyses as for example the prediction of traffic situations or the estimation of caused exposures by the vehicles. The latter might be connected with the impact on health effects caused by traffic congestion5 (Goel and Kumar 2015).
Information representation appears often differently, dependent on the application and the analyzed data type. Consequently, there are numerous different representation possibilities for spatial data and movement. Dependent on the important, to be analyzed, properties of the used data, the used representation can vary in its dimensions, scales and representation philosophies.
The possibly most important space for representing geodata is the two-dimensional Euclidean space. In this space, points, lines and areal polygons represent features of the real world usually in a bird’s eye view as in typical GIS software map views. Figure 2a pictures one example for the two-dimensional Euclidean space. Besides, query options based on spatial coordinates, there are two main groups of typically used data types: discrete vector data and continuous raster data, as shown in Figure 2a. In case of representing movement, there are the options of using raster time series or trajectory polylines.
Another movement space includes beside x- and y-axis, also a z-axis representing the temporal component. Space time cubes as in Figure 2b originate from time geography by Torsten Hägerstrand, where the temporal component is part of changes in space. This type of movement space can represent developments of human settlements or habitat developments via space time prisms and other three-dimensional geometries. Additionally, it is possible to represent individual trajectories as spatiotemporal polylines that meet at selected locations and time windows. These are the locations in space time, where moving entities have met. Due to cluttering effects, it is possible to represent only few spatiotemporal trajectories.
Another space of movement is the network space, where arcs and nodes correlate with real world roads and intersections, as pictured in Figure 2c. Arcs and nodes imply topological relations of selected locations and therefore are usable for routing applications. One important precondition for performing these applications is the implementation of realistic connectivity similar to road networks of the real world. Additionally, every appearance at road segments, such as number of lanes, road type, road closure and traffic states are assignable to arcs as weights. In general, the network space focus on representing restricted movement as the movement of a vehicle on a road network. In some case, also
5
6
other types of movement, even in open space, are representable via creating functional networks that do not match any visible network of the real world, but focus more on local knowledge or perceptual aspects. When focusing on road network features as in Figure 2c, there are several connections of arcs and nodes to movement trajectories, especially via map matching (MM) methods and via aggregation of tracked movement positions to road segments with specific identifications. Nodes often represent road intersections and more specifically the points, where directional changes in 2D Euclidean space occur. Usually, these locations imply several options of changing the driving direction.
Figure 2: Four different movement spaces, with (a) two-dimensional Euclidean space, (b) three-dimensional space time cube, (c) network space, and (d) irregular tessellation; adapted from Gudmundsson et al. (2012).
The fourth possibility of a movement space is the irregular tessellation, pictured in Figure 2d. The general movement information is difficult to obtain, since the movement representation of one entity only consists of sequences of areal polygons. This change of space at different time windows allows interpreting movement. It refers to the positioning via phone tower cells of mobile phone users. As in the data extracts of the telecommunication providers, call detail records (CDR) imply movement representations as a sequence of visited phone tower cells. These sequences might not represent detailed movement of recent mobile phone users, as pictured in Figure 2d. Additionally, the height component influences the positioning via GSM. Nevertheless, when inspecting CDR on a large scale, for example on the scale of a whole country, inferring representative movement patterns in possible. This is different from the scale level of one city, since movement of entities is difficult to reconstruct.
7
1.2 Events of moving objects and traffic phenomena
This work has the focus of detecting vehicle traffic phenomena from FCD. In general, there are multiple differing definitions of various vehicle traffic phenomena in the literature. The most prominent examples include traffic congestion event. These types of events are usually occurring in road network space, namely on differently connected road segments of different lengths and widths. Since these events include numerous vehicles that are slowly moving or still standing on parts of the road network, they are called linear events. Events occurring in road network space, which are for Tang et al. (2016a) so-called linear events (LE). Besides the shape and size of these linear events, there are also temporal attributes of the traffic event. Additionally, there are references to the frequency of traffic congestion appearance. There are the terms recurrent congestion (RC) and non-recurrent congestion (NRC) as differentiated by Anbaroglu et al. (2014), Varaiya (2007), Dowling et al. (2004), and Chen et al. (2016). On the other hand traffic accidents can be the causes of traffic congestion events, as defined by Okabe et al. (2009), and by Xie and Yan (2008). The reason is that accidents sites depending on accident time and severity have influences on the surrounding traffic, as road closures and blockades, or cause secondary accidents. Since often assumed these traffic congestion events are caused by unusual driving behavior, they are often part of traffic anomalies. A traffic anomaly is in general a traffic pattern that is unusual for selected investigation areas, as defined in Lan et al. (2014), Pang et al. (2011) , Pang et al. (2013), Zhang et al. (2011a), and in Chen et al. (2012). The critical question is how to observe something as a typical traffic situation. As in the Google maps vehicle routing service, we can compute usual traffic states for road segments based on averaged travel times of specific working days. In many cases, periodical traffic congestion show similar congestion propagation patterns or has concise association with capacity limits of selected transportation infrastructure elements. Congestion propagation and bottleneck identification are special cases of moving events that reflect, to a certain degree, the quality of the transportation infrastructure, as described by Chawla et al. (2012), Ji et al. (2014), and Long et al. (2008)
When observing the influences of the underlying infrastructure, there are also Phantom jams, which are non-recurrent traffic congestion events without traffic bottlenecks and other influences of the transportation infrastructure, as in Sugiyama et al. (2008), and in Flynn et al. (2009). The model states that small delays of following vehicle drivers can cause phantom jams. Thus, this type of traffic congestion can depend on the driving behavior of individuals.
Besides the difficulty to distinguish between these various traffic phenomena, most of the literature is distinguishing between general infrastructural elements in rural and urban investigation areas. Urban vehicle traffic phenomena are often the focus of ongoing research. One specific phenomenon is urban traffic congestion, which has for Miller et al. (1999) the following characteristics:
Traffic congestion patterns are complex spatially
Morning and evening peak periods are declining compared to rural areas
Non-work trips (spatially and temporally dispersed) are increasing compared to rural areas
Traffic congestion is a dynamic phenomenon
Due to difficulties in detecting periodical traffic patterns and the frequently changing mobilities of people, traffic congestion in urban road networks still remains a research challenge (Anbaroglu et al. 2014). This statement finds its proof in a questionnaire by Bertini (2005), where hundreds of experts on transportation delivered very differing answers on how to define and to measure urban traffic congestion.
8
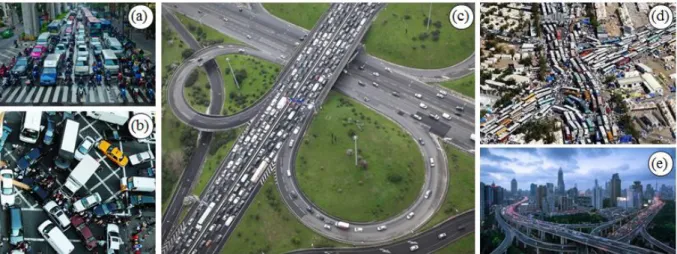
Figure 3 shows examples of real-world traffic congestion in urban environments. Traffic congestion might have various appearances connected with different causes and processes. The challenge here is to find patterns in available data, which pictures only one small selection of traffic participants. Nevertheless, literature defines specific vehicle movement patterns, which allow distinguishing between different types of traffic congestion.
Figure 3: Selected real-world appearances of urban traffic congestions, with (a) cars and motor-assisted bicycles at a light-signal system, (b) vehicles, vans and pedestrians at an urban intersection, (c) congested highway traffic and on-ramps, (d) traffic gridlock due to buses and delivery vans, and (e) evening rush hour on elevated highways. (References in 6)
Keeping this in mind, the introduced framework describes discrete traffic phenomena in connection with the frequently changing mobilities in urban environments. Traffic phenomena have many different appearances with different definitions. Additionally, traffic congestion, as one type of these phenomena, has various definition possibilities. From these numerous definitions of traffic congestion, only those, which have the focus on traffic congestion in urban environments, are the basis of literature review and of practical tests in this work.
After finding rules to distinguish between different traffic event types based on FCD, another unsolved task is to find suitable representations of the detected phenomena. In case of traffic congestion events, the representations can range between linear or punctual features, areal polygons, or parts of a road network for different time components, or as time series. One challenge of the spatiotemporal representation of traffic congestion, is handling the temporal component, since numerous geodata representation approaches base on processing static geodata. Another challenge is inferring vehicle traffic patterns without knowledge about the transportation infrastructure. When inspecting traffic phenomena, it is important to include available road network information into analyses. The accurate representation of connected road segments can serve as a base for evaluating detected traffic phenomena. Several approaches presume even the existence of road network data, as for example, the estimation of traffic densities and the matching of events with road segments.
6
Image references – URL:
(a) http://riskology-wp.s3.amazonaws.com/wp-content/uploads/2014/06/23221103/bangkok-traffic.jpg (b) http://www.sheepsheadbites.com/wp-content/uploads/2011/09/sb_rosen.jpg
(c) http://mms.businesswire.com/media/20131105006522/en/390694/5/1652732_Aerial_shot.jpg (d) https://pacejmiller.files.wordpress.com/2011/03/shanghai-traffic.jpg
9
The idea is to use areal polygons for representing traffic events, in particular traffic congestion. Consequently, the traffic congestion representations in this work are not bindingly linear events, but more like areal representation of influenced road segments. The connection from polygons to linear features is feasible via the matching of inferred traffic information (polygons) with road segments (lines, polylines, or arcs).
1.3 Hypothesis, research questions and objectives of the work
After the motivation and the general problem statements in the previous section, one can introduce hypothesis, research questions and general and specific objectives of the work.
Hypothesis
Knowledge gained from vehicle trajectories supports quantitative detection of and differentiation between traffic phenomena (of the real world).
Therefore, data of moving objects needs examination by different approaches in different movement spaces, independent of (data acquisition) quality.
This hypothesis focuses on the possibilities of using vehicle trajectories for detecting those patterns that reveal traffic phenomena of the real world. The challenge here is to use a relatively small number of traffic participants and inspect their properties of movement. Another part of the hypothesis is indicating that examination of vehicle trajectories in Euclidean space is not enough. This assumption requires additional examination of the data in feature spaces that respect also the temporal components of the data together with components of the objects’ movement dynamics. The gaining of knowledge about traffic phenomena is independent of the data quality, focusing on the reliability of spatial and temporal components of vehicle trajectories.
Research questions
Resulting from this hypothesis, four research questions appear. The answering of these four questions is one goal of this thesis. The four research questions of this thesis are:
1. How can we detect complex traffic phenomena from massive FCD with varying quality? 2. How much FCD do we need and in which quality for detecting traffic phenomena and its
propagation over time? Is there a need for additional information?
3. What are typical characteristics for traffic phenomena, in particular traffic congestion? What are investigation-area-independent properties?
4. Can we benefit from inspecting vehicle movement in different spaces, by means of different views on the movement data, in the way of gaining more detailed knowledge (e.g. for calculating traffic parameters)?
10
Research question 1 implies a review of techniques that might serve as means for detecting complex traffic phenomena. One precondition is gaining knowledge about the role of data quality and its influence on the results. More specifically, the question includes the search for the thresholds for having the lowest possible quality of FCD for detecting traffic phenomena. In this work, the quality of FCD consists only of its partial properties sampling interval and spatial accuracy.
In the second research question, the focus is on finding the optimal way of observing moving traffic participants for guaranteeing optimal results. During tracking data acquisition, its duration or acquisition time can influence the quality of the outcomes. In a different way, quality of traffic phenomena detection can depend on the number of observed vehicles. The task is to estimate optimal durations and numbers. This question is connected to the device-dependent quality of positioning and acquisition, which is mentioned in question 1. Nevertheless, the bigger focus of question 2 is to clarify the numbers of trajectories of moving entities for defining traffic phenomena. Additionally, the aim is to show when the need of additional information is inevitable. Additional information results from data on the underlying transportation infrastructure or the mode of transports. For this case the type specification of the needed information is important and its dependency on the specific type of analysis.
Question number 3 is about finding the typical characteristics for selected traffic phenomena, or more specific traffic congestion. In case these characteristics have certain patterns, the goal is to define or to find measures or parameters, which are independent of the investigation area.
The fourth question is about reasoning on the way of movement data analysis. Despite analyzing movement in Euclidean space, other spaces might show hidden patterns of movement. The aim of the fourth question is to find extensions in different spaces or in different views on the data for defining additional traffic parameters.
General objective
The general objective of this thesis is to develop a conceptual and methodological framework for detecting and classifying vehicle traffic pattern or so called traffic phenomena based on various FCD. Since the term traffic phenomenon has a great variety in its interpretation, the focus in this thesis is only on one class of traffic phenomena for further analysis: vehicle traffic congestion. In the following case studies, only vehicle traffic congestion and its propagation are matter of further inspection.
Specific objectives
The specific objectives of this thesis include the following:
1. Calculation of various traffic parameters based on movement representations in different spaces (Euclidean, Spatiotemporal, Network, Feature spaces)
2. Detection and Classification of different traffic phenomena
3. Quality assessment of results – focus on FCD quality (measurement, interpolation)
4. Method development for connecting classified movement patterns (and various other information) with street information for transport networks
11
5. Defining a technique for FCD sets, which usually come from a small percentage of participating vehicles, which allows estimating the actual (real world) traffic density
Additionally to these specific aims, this work has some follow-ups on ongoing research in the domains of GIScience and Transportation Engineering in the context of FCD. Therefore, the following additional research questions should be answered, which are mainly defined in the outlooks of selected research papers:
What is an Appropriate Temporal Sampling Rate to Record Floating Car Data with a GPS? (Ranacher et al. 2016b)
How much GPS data do we need? (Patire et al. 2015)
How to compare movement? A review of physical movement similarity measures in geographic information science and beyond. (Ranacher and Tzavella 2014)
The first question refers to data quality, and, how proportionate a high sampling interval is for the quality of traffic phenomena detection. The second specific question consists of finding out if the number of observed vehicles is of extraordinary importance for accurately detecting traffic phenomena. In the third question, only those movement similarity measures are selected that deliver useful insights into traffic phenomena. Here the focus is more on indicating, which already known similarity measures are not useful for the traffic pattern analysis framework.
1.4 Approach and methodology
For proving the mentioned hypothesis, one needs to traverse research from various different fields including computational movement analysis, physics (in particular mechanics), traffic engineering (as part of civil engineering) and GIScience. Further connected core disciplines are transport geography and time geography. The used approach bases on previous work on traffic pattern detection and classification within geographic information systems. Following the concept of designing a framework for traffic pattern detection, the proposed methodology makes use of six different methods that benefit the pattern exploration of FCD. After applying the framework methods and inspecting the first outcomes, several aspects contribute to ongoing research.
Approach
The used approach in this thesis for solving the research questions consists of designing a traffic pattern analysis framework for FCD. Therefore, the first part is to find similar ideas from the body of literature. Parts of selected historical and recent research are included into the framework, nearly always in modified and extended form. Other parts of the framework emerge from first practical tests of various techniques for handling this type of data.
12
Methodology
The terms moving objects, vehicle tracking and traffic patterns appear in many different research domains. This results in a high number of different terminologies. Therefore, the first step for defining a traffic pattern analysis framework is to specify a taxonomy of features and methods to avoid misunderstanding. This taxonomy enables describing the design specifications of the framework precisely.
The methods of the framework rely partially on observing movement of concrete objects in different spaces (Gudmundsson et al. 2008). Besides observing moving objects in two- and three-dimensional Euclidean space, there is also the spatiotemporal component of moving objects, which is the location of the object at a certain time. Since vehicle traffic is bound to transportation infrastructures such as road networks, a modelling of movement in network space is the additional third component of observation. In network space, it is possible to aggregate movement of numerous moving objects and to assign it with connected arcs, which base on street representations of the real world.
After introducing selected preprocessing steps for FCD, the proposed framework continues with the computation of products that rely on preprocessed FCD. The first focus is introducing global indices for respecting the daily traffic situation for the whole investigation area. Dependent on these indices, selected rush hours of the day influenced by local traffic phenomena are selectable.
One central aspect of the framework is detecting and representing traffic congestion events. Therefore, the framework has six techniques that allow not only the traffic congestion detection, but as well the representation of different congestion events. The evaluation of the proposed framework techniques implies testing with specific FCD sets generated by urban taxis in 2007.
1.5 Structure of the thesis
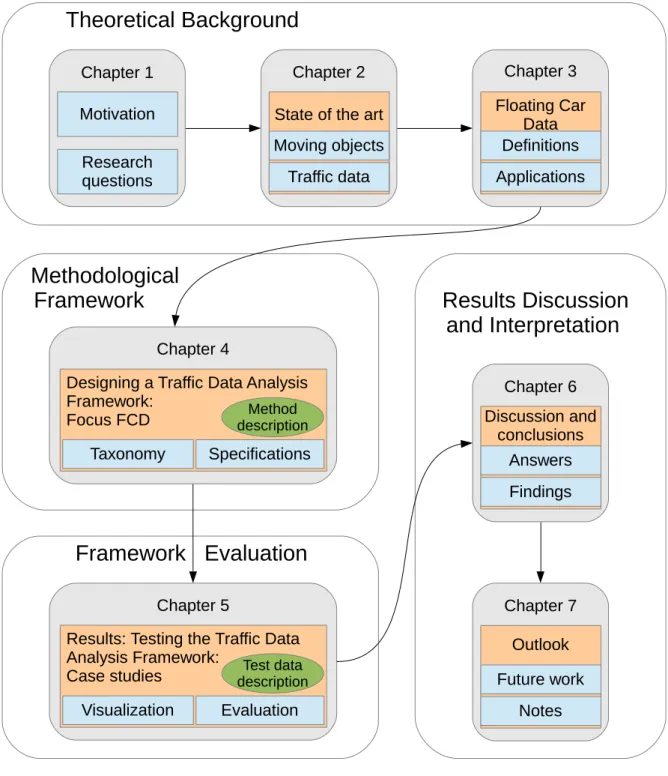
The structure of this thesis consists of an introduction and six following chapters as pictured in Figure 4. Chapter 2 consists of the state of the art on moving objects. The focus of this chapter is to reveal the most important and known methods for analyzing this type of data. Additionally, chapter 2 shows the basics in traffic data acquisition, which consists, besides historical techniques, as well of the options to respect and include road network information into the analysis.
Chapter 3 gives comprehensive definitions of FCD and reviews recent and historical FCD applications. In this chapter, the focus is more on related work that influences the proposed traffic pattern analysis framework in this thesis. Based on the two previous chapters, chapter 4 designs a general framework for analyzing FCD and for detecting vehicle traffic patterns. The last mentioned is the fundamental application area within this thesis. Therefore, chapter 4 lists many definitions of traffic patterns and more specifically of vehicle traffic congestion. Including these definitions into a general holistic definition of traffic congestion is the base for introducing a traffic pattern analysis framework for FCD.
After these definitions, chapter 5 consists of testing the framework with a historical taxi FCD set of 2007 coming from a taxi fleet in Shanghai. The results of the testing and evaluation are part of an extensive discussion and conclusions in chapter 6. Chapter 7 concludes the work with an outlook for unsolved problems. Figure 4 shows the different parts of this thesis with shortly summarized terms for each section.
13 Figure 4: Overview on the structure of this thesis.
Results Discussion
and Interpretation
Framework Evaluation
Methodological
Framework
Theoretical Background
Chapter 1 Chapter 2 Chapter 3
State of the art Moving objects Motivation
Research
questions Traffic data
Floating Car Data Definitions Applications
Chapter 5
Results: Testing the Traffic Data Analysis Framework: Case studies Evaluation Visualization Test data description Chapter 6 Discussion and conclusions Answers Findings Chapter 7 Outlook Future work Notes Chapter 4
Designing a Traffic Data Analysis Framework: Focus FCD Specifications Taxonomy Method description
15
2.
State of the art on vehicles as moving objects – a
review of methods
This part of the thesis presents an introduction on concepts connected with moving objects. The term moving objects refers to observations of various different dynamics in our environment. One common property is that a concrete entity is moving in Euclidean space, be it an organism or a machine. Additionally, and as an extension, it is possible to define other spaces of movement representation. The variety of tracking devices with various data acquisition techniques for acquiring moving objects indicates different qualities of the data. More specifically, movement trajectories acquired with differing tracking devices have different accuracies and resolutions in space and time. In general, a trajectory is the description of individual object movement with a number of records showing spatial positions of the entity with attached time components. Trajectories might be part of data sets with different structure and quality. In many cases, trajectories of moving objects have to be defined first from unsorted and not preprocessed, raw, movement data. Another fact is that every analysis of moving object data is application domain driven. Therefore, the following will show common basics of moving object data analysis but as well domain specific issues that developed historically.
2.1 Computation with data from moving objects
Tracked movement of objects is widely available and used for various applications in our society (Dodge et al. 2016). In case of inspecting individual vehicle trajectories, the movement data has a specification that includes domain knowledge about the moving entity. In this case, the domain knowledge might include the movement restriction on roads or typical values for measurable quantities like speed and acceleration. In the most often cases, there is the, sometimes excessive, usage of tracking devices for collecting the movement of certain entities, as for example people, drivers, robots or animals. These movements result as a series of records with a spatial and a temporal component, namely movement trajectories of entities.
Formal representation of movement trajectories
A movement trajectory consists of a list of records X1:T containing at least two coordinates x, y, and one time component t:
X1:T= x1, … , xt, … , xT , where xt= (x, y, t) (1)
xt is recorded by a positioning device. The simplest way of representing movement trajectories visually within a map view is via polylines, which is a synonym for line graphs. Every point within one single trajectory might then be the base for linear interpolation between consecutive movement positions. FCD representations and their constellation possibilities are part of the following chapter 3.
Progressively varying continuous fields
Another group of movement data is the movement of fields like clouds, wind and water surface movements (Andrienko and Andrienko 2013). The typical representation for these phenomena are
16
progressively varying continuous fields (Goodchild and Glennon 2008), which are continuous fields with additional time components (Keler and Krisp 2015a). Other examples of progressively varying continuous fields are atmospheric movements, ocean circulations, temperature, humidity, or vehicle and pedestrian movements (Keler and Krisp 2015a). With respect to the two last mentioned examples, it is to note that it is generally possible to convert massive moving object data of many entities into raster time series. This is possible via aggregation of movement by aggregating individual movements of entities into streams or flows of moving objects, as it is defined in Andrienko and Andrienko (2013). This conversion uses individual movements of moving entities, usually trajectories, and creates group movements, often represented by movement or position densities.
Movement analysis is possible with tracked animal movement resulting in timestamped movement positions. Extracting patterns for analysis focuses more on individual movement. Usually, traditional analysis methods consist of statistical methods coming from the field of movement ecology (Demšar et al. 2015). One key application in movement ecology is to define animal behavior together with the specific contexts. Besides many similarities between vehicle and animal movement, there are as well many differences resulting from domain-specific issues. One of these issues is the definition of habitats for moving animals and the absence of a road network, which is typical for vehicle movement.
Methods from movement ecology
Animal movement might be an indicator for environmental spatiotemporal changes. The movement is at first sight an indicator for the behavior of individuals. Respecting its long-term patterns may reveal socio-economic processes of the human society, together with indication of the climate and weather conditions. There are historical methods used for acquired animal trajectories by various sensors, in the time even before the appearance of GPS (Demšar et al. 2015). Historical tracking devices are for example handheld radio receivers in combination with installed radio transmitter colliers on the animal’s bodies. The different devices are part of wildlife radio telemetry, which has a long development since the 1960s.
There is a great research body from movement ecology on how to analyze moving entities. This can benefit research on moving vehicles in many ways. When observing multiple animals in the same investigation area, the interesting patterns include for example the interactions between the tracked entities. The idea is detecting movement similarity like following and meeting behavior. There is a big variety of different similarity measures for inspecting movement data (Ranacher and Tzavella 2014). Selected research on similarity measures may also benefit applications in the urban environment, such as the different similarity measures can find applications with data coming from observed humans (Ranacher and Tzavella 2014).
Another aspect focuses on connecting animal movement with context. In case of movement ecology, this is often the connection of trajectories or parts of it with specific land use types. Nevertheless, animal movement appears as well in urban environments with massive anthropogenic features. One common approach in movement ecology is the segmentation of trajectories into stops and moves. In a similar way, (Spaccapietra et al. 2008) proposes a conceptual model of movement based on stops and moves. The extracted segments are further observable via visualization methods for looking inside trajectories (Andrienko and Andrienko 2013). The last aspect connects thematic reasoning on the scale of analysis representation, as described by Laube and Purves (2011) and by Gschwend and Laube (2014).