Data layout for power efficient archival storage systems
Ramana Reddy
NetApp Inc.[email protected]
Atish Kathpal
NetApp Inc.[email protected]
Jayanta Basak
NetApp Inc.[email protected]
Randy Katz
University of California, Berkeley[email protected]
ABSTRACT
Legacy archival workloads have a typical write-once-read-never pattern, which fits well for tape based archival sys-tems. With the emergence of newer applications like Face-book, Yahoo! Flickr, Apple iTunes, demand for a new class of archives has risen, where archived data continues to get accessed, albeit at lesser frequency and relaxed latency re-quirements. We call these types of archival storage systems as active archives. However, keeping archived data on always spinning storage media to fulfill occasional read requests is not practical due to significant power costs. Using spin-down disks, having better latency characteristics as compared to tapes, for active archives can save significant power. In this paper, we present a two-tier architecture for active archives comprising of online and offline disks, and provide an access-aware intelligent data layout mechanism to bring power effi-ciency. We validate the proposed mechanism with real-world archival traces. Our results indicate that the proposed clus-tering and optimized data layout algorithms save upto 78% power over random placement.
1.
INTRODUCTION
Archival storage tiers have consisted of tape-based devices with large storage capacity, but limited I/O performance for data retrieval. However, the growing capacity and shrink-ing cost of disk-based devices means that disk-based sys-tems are now a realistic option for enterprise archival storage tiers. Energy consumption has become an important issue in high-end data centers [11], and disk arrays are one of the largest energy consumers within them. Archives are unique in the low density of accesses they receive, often spending significant portions of their time idle, where it may be ac-ceptable to spin-down disk based storage for significantly reduced power consumption. Furthermore, archives are of-ten monotonically increasing in the amount of data stored, and must store data for decades or longer, far exceeding the typical 3-5 year hardware life-cycle.
Permission to make digital or hard copies of all or part of this work for personal or classroom use is granted without fee provided that copies are not made or distributed for profit or commercial advantage and that copies bear this notice and the full citation on the first page. To copy otherwise, to republish, to post on servers or to redistribute to lists, requires prior specific permission and/or a fee. Request permissions from [email protected]. HotPower’15, October 04-07, 2015, Monterey, CA, USA
c
2015 ACM. ISBN 978-1-4503-3946-9/15/10...$15.00 DOI: http://dx.doi.org/10.1145/2818613.2818742 .
We consider the case of active archives where data is still read frequently. For example, in Facebook photo-store Haystack [3] stores millions of photos that are archived within a few weeks of creation. The same is true for Yahoo! Flickr and Apple iTunes. These older objects are transferred to storage systems with lower storage overheads and cheaper storage media. In such active archives, it is expensive to power the entire storage stack. At the same time, if certain disks are spun down then it may result in degraded per-formance. It is therefore essential to understand the access patterns of the objects and then spin down certain disks that may not be accessed for a certain period of time. To do so, the relatively active objects that are being accessed within a short span of time should reside in the same disk (or set of disks) so that the other disks in a storage shelf can be spun down. In other words, the data layout across disks in a storage system, should be such that data reads within the same interval of time can be served by spinning up only a small subset of disks.
We envision a two-tier archival storage system where the writes are initially staged to a disk-cache consisting of al-ways spinning media and later de-staged to the archival tier consisting of disks with enhanced spin-up/spin-down capa-bilities, hence forth referred to as archive disks. The disk cache also serves read requests for recently written data un-til the data is migrated to the archive tier with intelligent data layout across archive disks. We design the data layout on the archive disks considering it as an optimization task. First we cluster the objects according to the access patterns observed from the disk-cache and then place the clusters in different disks in such a way that maximum power efficiency is achieved. Our results indicate that the proposed opti-mized data layout saves upto 78% over random placement.
The rest of the paper is organized as follows. Section 2 describes the related work and previous studies. Section 3 delineates our proposed architecture and optimization algo-rithm. Section 4 provides the implementation and discusses the efficiency of our proposed approach. Finally, section 5 gives concluding remarks and future work.
2.
PRIOR ART
There is good literature with respect to bringing power efficiencies in storage systems by leveraging disk spin down capabilities. MAID [4] focuses on conserving disk energies in high-performance systems. However, our work focuses on bringing power efficiencies to archival storage systems where the read latencies are relaxed. Pelican [2] proposes resource
management techniques for bringing efficiencies to cold data workloads while our focus is on active archives, where data is accessed more frequently. Pelican takes the approach of re-ordering requests to minimize the impact of spin up la-tency and also imposes hard constraints on number of disks that can be spun up at the same time (8 %) in the sys-tem. Our approach is to focus on performing data layout, based on learning from prior access patterns, such that sub-sequent read requests consume lesser power by co-locating co-accessed data on same set of disks. We do not impose any restrictions on the number of disks that can be spun up si-multaneously. Pelican and Nakshatra [9] discuss IO schedul-ing techniques that re-order read requests to club requests accessing the same media together for better performance and resource utilization. As part of future work, we can leverage such ideas to better align incoming requests to our data layout. This would be especially useful when data ac-cess patterns considerably change over the life of the archive. Greenan et al. [6] and Huang et al. [8] discuss that data re-dundancy introduced for reliability reasons can be exploited to save power. This is something we quantify through our results where we in some cases, we observe that increasing number of replicas reduces storage system power consump-tion, as it allows for choosing the best replica to serve data. Grawinkel et al. [5] discuss their analysis of traces from the ECMWF archival storage system. Our work leverages their insights and utilizes their traces to evaluate our solution. Recently, there have also been articles suggesting relevance of flash to archival storage and the trade-offs it presents be-tween cost, power-savings and performance [7]. However, this remains out-of-scope for our investigations.
3.
ARCHITECTURE AND ALGORITHMS
3.1
Architecture Overview
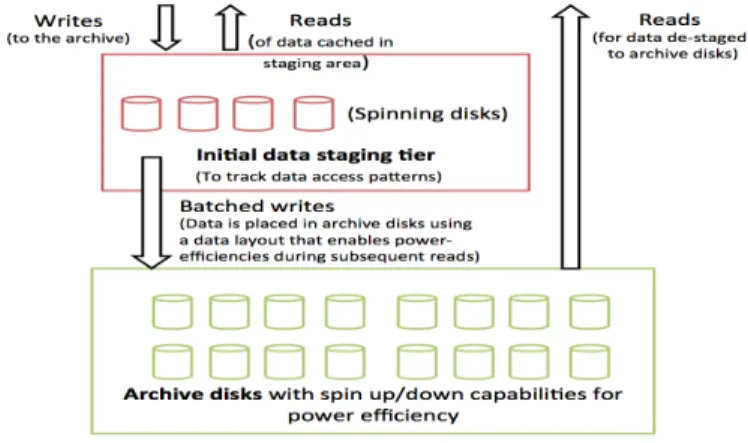
We envision a two tier archival system (Fig. 1) consisting of a) an initial online data staging storage sub-system to ingest incoming data and serve reads on the newly written data for the initial duration of time (say 30 days) and b) a second storage sub-system, consisting of offline disks that accepts batched writes (data transferred from the staging area after 30 days) and serves the occasional read requests.
Figure 1: Architecture Overview
The staging area consists of always online disks and is similar to a disk-cache in typical tape-based storage archive
deployments [5]. Any reads to the archived data during the initial period are served directly from the staging area. It is during this time that we log the read access patterns of the newly archived data that are input to our data layout algorithms when the data is to be eventually de-staged to the spin-down archive disks based system. The data layout engine clusters the newly archived files based on access pat-terns and determines the placement of these clusters into disks such that subsequent reads on the data consume much lesser spin up time of disks as compared to say a random or round-robin layout of data in the disks. Once the data has been de-staged to the archive disks based system, we expect the data to be immutable. Thus this final resting place for the data serves only read requests and no updates.
3.2
Algorithm
The input to our algorithms is a file or object access trace, consisting of time-stamp of data access, object-id and size of the object. There are two steps in the overall procedure. First we cluster the objects using the trace, and second we place the clusters of objects in different containers (which could physically be a single or a group of disks). Since the number of objects can be very large, it is very difficult to handle each individual object separately in the optimization algorithm. Therefore, we need to cluster the objects.
3.2.1
Clustering of the Traces
It is possible to cluster the files or objects into differ-ent clusters considering various features extracted from the traces. The features can be file/object size, frequency of accesses, directory information, namespace etc. It is not practical to apply the standard clustering algorithms such as k-means and hierarchical clustering, to cluster the objects as the time complexity is very high. In achieving the power efficiency, the files/objects should be clustered based on how they are accessed together. The notion of distance in such case, is not obvious (definitely the Euclidean distance is not measurable on the access pattern), the distance depends on the access patterns of the objects.
We perform clustering in the following way. Let us assume that the objects accessed are in a sequence: abcaabdef cgha.... To maintain a one-to-one mapping of object to cluster, we consider only the first occurrence of an object and ignore the subsequent occurrences of it. The subsequent accesses of the same object are taken into consideration by the optimization algorithm described later. Thus, the new sequence becomes
abcdef gh.... We calculate the total size of all objects in the new sequence and divide the total size with the number of partitions we require. Each partition is treated as a cluster and all clusters are approximately of equal size. We impose a restriction on the size of the cluster (max size) - a cluster should not grow very big causing other clusters to be very small. Also we impose a restriction on the minimum num-ber of clusters. Note that clustering is only a pre-processing step, linear in the size of trace and takes approximately 19 seconds for a trace consisting of around 1 million records.
3.2.2
Data Layout
In this step, we model the computation of data layout task as an optimization problem, to obtain a mapping of clusters, identified in previous step, to disks. We refer to the combination of these two steps as OPT in the paper.
of the disks.
• Letxcd: An indicator variable to representcthcluster
belongs todthcontainer (disk); i.e,x
cd∈ {0,1}where
xcd = 1 if thecth cluster belongs to dth container or
elsexcd= 0.
• Let aic: An indicator variable to represent that cth
cluster is accessed at theithtime instance (as obtained from the access pattern trace provided as input for this optimization problem);aic∈ {0,1}
• Ti,d: time taken to performithoperation on diskd(the
disk needs to remain spun up during the operation) We define an objective function L,
X i,c,d,d′ [aicai+1,c′xcdxc′d′(Ti+1,d′+(e1d′+e2d)(1−δdd′))] (1) whereδdd′ = 1 if d == d’ 0 otherwise.
The objective function denotes that thecth cluster is
ac-cessed at theith time instance and c′th cluster is accessed
at the (i+ 1)th time instance, in the input trace. The
con-tainer for thecth cluster is d and that for the c′th cluster
isd′. Therefore we have to spin-upd′and spin-downdifd
and d′ are different. The objective functionL thus
repre-sents the total spin-up time of all disks during the course of the workload, the system is being subjected to.
The optimization is to minimize L subject to following constraints
1. Rmin <=Pdxcd<=Rmax whereRmin andRmax are
the minimum and maximum number replicas we want per cluster, respectively
2. PcxcdSc < Cd where Sc is the size of cth cluster and
Cdis the capacity of dth disk (to ensure we do not exceed
capacity of the disk)
3. Pc,dxcd≤kN whereN is the total number of clusters,
kis a constant (sayk= 1.5) (to ensure we maintain k copies of a cluster on an average)
It is possible to specify Ras a range such that the opti-mizer can decide what number of replicas is best for power efficiency on a cluster by cluster basis. In our evaluations we used a constant number of replicas per cluster rather than specifying a range and an average. This is to demon-strate that we can device constraints to arrive at a more specific solution space. This is an integer programming task that is approximated by quadratic programming with linear constraints and a solution is obtained using integer approx-imation (branch-and-bound).
4.
PRELIMINARY EVALUATION
4.1
Prototype Description and Setup
We implemented a prototype to evaluate the clustering and data layout algorithms. We leveraged the Python bind-ings for SCIP optimization library [1] as the solver to specify the variables, constraints and the objective function of our formulation. The mapping of clusters to disks returned by the solver, is then fed to a simulator which re-runs the trace with the new data layout to measure power-savings. In or-der to quantify the power-savings obtained we treat a naive, random data layout approach as the baseline.
We describe our simulator as follows. In steady state, some disks are spun-up and serving data while others re-main in spun-down state. The mapping of object to disks is known to the simulator based on either random placement of objects/clusters or OPT based layout of data. Any in-coming request for an object is mapped to a set of disks containing a copy of the object. If the object belongs to an already spun-up disk, it is immediately served and the to-tal spun-up time for the disk is updated with time taken to serve the object. If none of the required disks are in spun-up state, we randomly select a disk (from disks containing a copy of the object) to serve this object, while also accounting for the 30 second spin-up time of the disk as latency of ac-cess to the object. The simulator in the background ensures that any disk that has been idle for more than 5 minutes, is transitioned to spun-down state. The time to transition the state is also accounted as spun-up time for the disk. On the conclusion of the workload trace, the simulator reports statistics such as, overall spin up time for every disk and the latency to first byte of objects accessed as part of the trace. We used a machine with an Intel(R) Core(TM) i5-3320M, 2.60GHz CPU and 8GB RAM running Ubuntu 12.04. We conducted a wide variety of experiments and evaluated the power consumption in the form of the total disk spin-up time with a) clustering and b) OPT (clustering followed by opti-mized layout) with respect to random placement of objects. We evaluated the amount of power saving in terms of disk spin-up times using the clustering approach with and without the optimizer, compared against random placement. When evaluating the clustering without optimization, each cluster is placed into a disk selected randomly, while keep-ing replicas of clusters on different disks. In the random-placement approach, one copy of an object in the trace is placed in a disk selected randomly. On the other hand when evaluating OPT technique, we first cluster the objects and then run optimization to obtain a power-optimized mapping of clusters to disks rather than a random placement. All ap-proaches take the size of disks and the number of replicasR
as input and calculate the total spin up time taken for the entire trace.
4.2
Trace Description and Usage
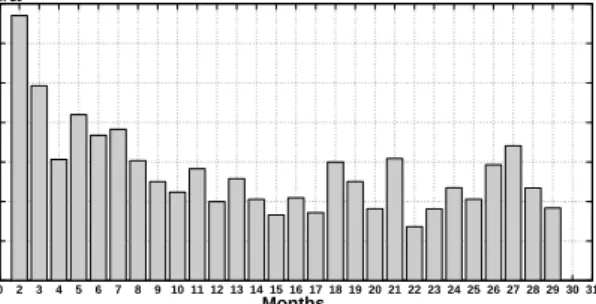
For our evaluations we used a real world archival work-load trace [5]. We controlled the number of clusters such that each disk accommodates at least one cluster. We as-sume disks of size 4TB in our experiments. We ran our OPT data layout technique on traces worth one month, amount-ing to total of 96TB of data, around 0.4 million objects and around 1 million requests. The overall trace [5] itself consists of approximately 70:30 percentage of write:read ratio which is representative of archival workloads that tend to be write once, read seldom. We observed that even over the course of the 29 month trace, files ingested and/or accessed in the first month, continued to get accessed in subsequent months, as shown in Fig. 2, suggesting a good degree of repeatabil-ity in the trace and a good fit for our use case of active archives, where data continues to get re-accessed, although at lesser frequencies. We observed (Fig. 3) that objects are accessed frequently within relatively shorter spans and then not accessed for longer durations. This typical character-istic of the archival trace makes it a suitable candidate for the use of spin-down media. The group of objects that are accessed within shorter span can be placed into the same
disks. These disks can be spun down when the objects are not being accessed.
0 2 3 4 5 6 7 8 9 10 11 12 13 14 15 16 17 18 19 20 21 22 23 24 25 26 27 28 29 30 31 0 1 2 3 4 5 6 7x 10 4 Months
Number of Objects common
with Month1
Figure 2: Frequency of objects that are common with the objects in first month
1 3 5 7 9 11 13 15 17 19 21 23 25 27 29 31 0 1000 2000 3000 4000 5000
Objects Inter−arrival time in days
Frequency
Figure 3: Inter arrival time of objects
4.3
Results
We place the archived objects into spin down disks by us-ing access locality based clusterus-ing and our mathematical formulation, together referred to as OPT. OPT decides the mapping of archived objects to spin down disks, based on access patterns seen during the first month (30 days) of the trace. To evaluate this data layout, we execute the subse-quent month’s traces, to measure what power efficiencies we are able to obtain as compared to random placement of data into the archive tier. We varied the number of clusters to see if that has any effect on power savings we observe. Fig. 4 shows the power savings obtained by using OPT data place-ment, as compared to random placeplace-ment, while running the trace from days 30 to 60 (i.e. the second month in the 29 months long trace). As seen from the figure, we observe that OPT provides up to 78% of power savings. We also ob-serve that power savings are sensitive to number of clusters, in that, if the same data is partitioned into more clusters, the power savings are seen to reduce. This is because more number of smaller clusters implies the data gets spread to a larger number of disks, which in turn implies that more disks need to be powered on to access the same data set. Recall that we keep a disk spinning for some time even after data has been served, in anticipation of any further requests and also to contain the number of spin down cycles for a disk. In a nutshell, more granular partitioning of the trace (higher number of clusters) does not lead to any further gains in the power efficiency. The increase in number of replicas from 1 to 3 did not contribute to much impact on power savings
in our experiments. For a trace where there is lesser local-ity of access, as compared to initial months, we expect to see better gains with higher number of replicas. This is be-cause higher number of replicas provides more flexibility to the optimizer to detect the top three groupings of clusters as against only the best grouping of clusters to be placed in the same disk. This though comes at the cost of higher storage overheads, but also provides better resiliency of data.
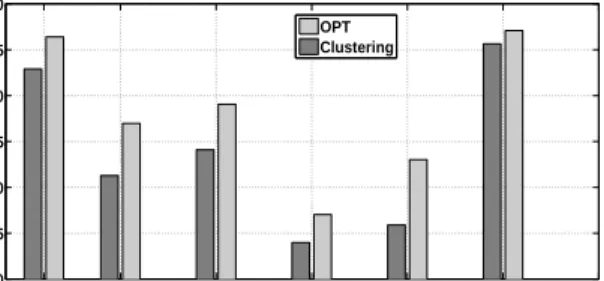
In Fig. 5, we contrast the power savings of using our clus-tering approach alone, as compared to a combination of clustering and our formulation (OPT), for R=2. Clearly, OPT provides considerable improvement in power savings as it is able to detect affinity across clusters w.r.t. power savings. Collocating selective clusters based on OPT data placement leads to additional 3-8% improvements in power savings. The comparison of naive clustering with OPT is something we intend to explore further going forward. Eval-uating against more traces should yield better insights on effectiveness of OPT over simple partitioning.
In Fig. 6, we compare power savings observed across dif-ferent months, for R=2. (while the data placement remains done, based on access patterns seen in first month). The goal of this evaluation was to see if our approach continues to give benefits during the lifetime of the archive. Clearly, with our trace, we continue to obtain significant power sav-ings during the course of the 29 month trace, even though the placement was done based on first month. This shows that the archive trace patterns do not change much over the course of time. 25 50 75 100 50 55 60 65 70 75 80 Number of Clusters
Power Saving Percentage
Wrt. Random
R=3 R=2 R=1
Figure 4: Power Savings w.r.t. Random Placement
25 50 75 100 60 65 70 75 80 Number of Clusters
Power Saving Percentage
Wrt. Random
OPT Clustering
Figure 5: Clustering vs OPT performance
In addition to the power-savings as compared to random placement, we also observed up to 62% lesser number of spin-up/spin-down cycles when using the OPT approach. This has dual advantages of a) consuming lesser disk power-cycles is known to lead to longer disk shelf life [10] and b) this
implies that we can serve more data, per disk power-cycle, hence leading to lower latencies when accessing objects as compared to random placement of data. The running times of the technique are reasonable (Fig. 7), considering the al-gorithm gets triggered only when data is de-staged from the online disk subsystem to the power-efficient storage system. There is scope to further improve running times by leverag-ing multiple cores and usleverag-ing multi-threadleverag-ing.
2 6 11 16 21 26 31 50 55 60 65 70 75 80 Months
Power Saving Percentage
Wrt. Random
OPT Clustering
Figure 6: Clustering vs OPT performance in differ-ent months 0 25 50 75 100 0 1 2 3 4x 10 4 Number of Clusters
Time taken by Solver (Secs)
R=1 R=2 R=3
Figure 7: Time taken to load (in-memory) and solve optimization problem, with single thread
5.
CONCLUSIONS AND FUTURE WORK
We have presented a two-tier architecture for power-efficient archival storage. We considered the active archives that serve read requests regularly. We presented a mechanism for data layout that looks into the past access patterns and distributes the data into disks in such a way that total spin-up time is minimized in the active archive. The preliminary evaluation of our data layout techniques shows significant power savings as compared to random layout in spin down disks. In real active archives like Google, Facebook, Yahoo, and Apple, millions of objects are uploaded within short span of time. When the objects are uploaded, in our two-tier architecture, the objects are written in the active two-tier and later it is transferred to the active archival tier. The ob-jects may be accessed within a very short span of time. Our clustering algorithm groups the objects based on the access pattern that transforms the access pattern to group access pattern where a group will be accessed repeatedly within a short span of time. Even if a few groups are intermingled, it results into spinning only a few disks as a result. Going forward we plan to perform a thorough analysis of typical archival workload access patterns and how we can further
improve the power savings under a wide variety of work-loads. We have not modeled an adaptive layout where new data needs to be placed along side already existing data on the disks and how the same impacts our results. We also intend to evaluate our techniques in a real world archival storage system.
6.
REFERENCES
[1] T. Achterberg. Scip: solving constraint integer programs.Mathematical Programming Computation, 1(1):1–41, 2009.
[2] S. Balakrishnan, R. Black, A. Donnelly, P. England, A. Glass, D. Harper, S. Legtchenko, A. Ogus, E. Peterson, and A. Rowstron. Pelican: A building block for exascale cold data storage. InProceedings of the 11th USENIX conference on Operating Systems
Design and Implementation, pages 351–365. USENIX
Association, 2014.
[3] D. Beaver, S. Kumar, H. C. Li, J. Sobel, P. Vajgel, et al. Finding a needle in haystack: Facebook’s photo storage. InOSDI, volume 10, pages 1–8, 2010. [4] E. V. Carrera, E. Pinheiro, and R. Bianchini.
Conserving disk energy in network servers. In
Proceedings of the 17th annual international
conference on Supercomputing, pages 86–97. ACM,
2003.
[5] M. Grawinkel, L. Nagel, M. M¨asker, F. Padua, A. Brinkmann, and L. Sorth. Analysis of the ecmwf storage landscape. InProc. of the 13th USENIX
Conference on File and Storage Technologies (FAST),
2015.
[6] K. M. Greenan, D. D. Long, E. L. Miller, T. J. Schwarz, and J. J. Wylie. A spin-up saved is energy earned: Achieving power-efficient, erasure-coded storage. InHotDep, 2008.
[7] P. Gupta, A. Wildani, E. L. Miller, D. Rosenthal, I. F. Adams, C. Strong, and A. Hospodor. An economic perspective of disk vs. flash media in archival storage.
InIEEE 22nd International Symposium on Modelling,
Analysis & Simulation of Computer and
Telecommunication Systems (MASCOTS), 2014,
pages 249–254. IEEE, 2014.
[8] J. Huang, F. Zhang, X. Qin, and C. Xie. Exploiting redundancies and deferred writes to conserve energy in erasure-coded storage clusters.ACM Transactions on
Storage (TOS), 9(2):4, 2013.
[9] A. Kathpal and G. A. N. Yasa. Nakshatra: Towards running batch analytics on an archive. InIEEE 22nd International Symposium on Modelling, Analysis & Simulation of Computer and Telecommunication
Systems (MASCOTS), 2014, pages 479–482. IEEE,
2014.
[10] T. Xie and Y. Sun. Sacrificing reliability for energy saving: Is it worthwhile for disk arrays? InParallel and Distributed Processing, 2008. IPDPS 2008. IEEE
International Symposium on, pages 1–12. IEEE, 2008.
[11] Q. Zhu, Z. Chen, L. Tan, Y. Zhou, K. Keeton, and J. Wilkes. Hibernator: helping disk arrays sleep through the winter. InACM SIGOPS Operating
Systems Review, volume 39, pages 177–190. ACM,