University of Iowa
University of Iowa
Iowa Research Online
Iowa Research Online
Proceedings of the Ophthalmic Medical Image Analysis International Workshop
Oct 21st, 2016
Segmentation of Optic Disc and Optic Cup in Retinal Fundus
Segmentation of Optic Disc and Optic Cup in Retinal Fundus
Images Using Coupled Shape Regression
Images Using Coupled Shape Regression
Suman Sedai
IBM Research Australia
Pallab Roy
IBM Research Australia
Dwarikanath Mahapatra
IBM Research Australia
Rahil Garnavi
IBM Research Australia
Follow this and additional works at: https://ir.uiowa.edu/omia
Part of the Ophthalmology Commons
Recommended Citation
Recommended Citation
Sedai, Suman; Roy, Pallab; Mahapatra, Dwarikanath; and Garnavi, Rahil. Segmentation of Optic Disc and Optic Cup in Retinal Fundus Images Using Coupled Shape Regression. In: Chen X, Garvin MK, Liu J, Trucco E, Xu Y editors. Proceedings of the Ophthalmic Medical Image Analysis Third International Workshop, OMIA 2016, Held in Conjunction with MICCAI 2016, Athens, Greece, October 21, 2016. 1–8.
https://doi.org/10.17077/omia.1040
Rights
Copyright © 2016 the authors
Suman Sedai, Pallab Roy,Dwarikanath Mahapatra, Rahil Garnavi IBM Research Australia
Level 5, 204 Lygon Street, Carlton, Victoria 3053, Australia
{ssedai,pallroy,dwarim,rahilg}@au1.ibm.com
Abstract. Accurate segmentation of optic cup and disc in retinal fun-dus images is required to derive the cup-to-disc ratio (CDR) parameter which is the main indicator for Glaucoma assessment. In this paper, we propose a coupled regression method for accurate segmentation of optic cup and disc in retinal colour fundus image. The proposed coupled regres-sion framework consists of a parameter regressor which directly predicts CDR from a given image, as well as an ensemble shape regressor which iteratively estimates the OD-OC boundary by taking into account the CDR estimated by the parameter regressor. The parameter regressor and the shape regressor are then coupled together within a feedback loop so that estimation of one reinforces the other. Both parameter regressor and the ensemble shape regressor are modeled using Boosted Regression Trees. The proposed optic cup and disc segmentation method is applied on an image set of 50 patients and demonstrates high segmentation accu-racy. A comparative study shows that our proposed method outperforms state of the art methods for cup segmentation.
1
Introduction
Glaucoma is a chronic and irreversible neurodegenerative ocular disorder in which the optic nerve head is progressively damaged, leading to deterioration in vision and quality of life [2]. It will affect approximately 80 million persons worldwide by 2020 [1]. Glaucoma is commonly asymptomatic. The patients are usually ignorant about it until a noticeable visual loss occurs at a later stage. Early detection and treatment are essential for glaucoma patients to reduce the progression of their vision loss. Glaucoma diagnosis mainly depends on the med-ical history, intra-ocular pressure and visual field loss tests together with an assessment of the Optic Disc (OD) through ophthalmoscopy. In 2D color reti-nal fundus images, the OD can be divided into two distinct regions; namely, a central bright region called the optic cup (OC), and a peripheral region called the neuroretinal rim. The loss in optic nerve fibers leads to the enlargement of cup region called cupping. One of the important indicators of glaucoma is the enlargement of the cup with respect to OD which can be measured as the verti-cal cup to disc ratio CDR. Quantification of CDR requires accurate delineation
X. Chen, M. K. Garvin, J. Liu, E. Trucco, Y. Xu (Eds.): OMIA 2016, Held in Conjunction with MICCAI 2016, Athens, Greece, Iowa Research Online, pp. 1–8, 2016. Available from: http://ir.uiowa.edu/omia/2016_Proceedings/2016/
of the boundaries of the optic disc and cup. However, manual annotation of the optic cup and disc boundary is time consuming, expensive and highly subjective. A number of methods have been presented in the literature for automatic segmentation of disc and cup [4]. Existing Optic disc segmentation techniques based on active contours [3, 5] and morphological feature [5] are capable of pro-ducing reliable OD boundary. However, their performance still depends on the initialization and the ability to identify weak edges of neuro retinal rim in fundus images. Optic cup segmentation is more challenging because the depth informa-tion is not available in 2D retinal fundus images. As a result, cup boundary is ill defined and in-homogeneous which makes the segmentation more difficult. Existing approaches of optic cup segmentation are based on level sets [8], super-pixels classification [9] and sparse dictionary learning [14]. In another method [13], fusion of cup segmentations from multi-view fundus images was performed to improve the performance. In some recent work, the presence of glaucoma in fundus images is predicted by classification using SVM [16] and deep feature learning [15], thereby bypassing the OD-OC segmentation.
In this paper, we propose a novel coupled shape regression (CSR) method which combines the CDR estimation and OD-OC segmentation by exploiting their correlation, in order to improve the accuracy segmentation. The proposed method consists of two separate regression models connected in a feedback loop. The first regression model is trained to estimate the CDR by directly regress-ing the image features with respect to a given segmentation of OD. The sec-ond model consists of an ensemble shape regressor which iteratively predicts multi-dimensional OD-OC shape boundary points from an image by taking into account CDR estimated by the parameter regressor. Our method interweaves the estimation of CDR and segmentation of OD-OC such that estimated CDR guides the segmentation process to improve the segmentation performance. Ulti-mately, the final CDR value calculated from the OD-OC segmentation output is shown to be more accurate than intermediate CDR values generated by the char-acteristics regressor. To the best of our knowledge, no such method exist that integrates the organ parameter estimation model to improve the segmentation performance.
2
Proposed Method
In the proposed CSR method, a parameter estimation model and an ensemble shape regression model are coupled together to directly predict the OD-OC shape boundary from a input retinal image. Given a training examplesnIi,Sˆi,ˆci
oN i=1
where Ii is a retinal fundus image, ˆSi is a ground truth OD-OC shape vector and ˆci is the ground truth CDR parameter, the subsections below describes the training of the parameter estimation model and ensemble shape regression model.
2.1 Parameter estimation
The parameter estimation model takes an image I and a segmentation S to directly predict CDR parameter and is given by
c=F(I, S) (1)
where the input segmentation S is used to obtain the optic disc region in I. To train this model, we first crop the disc image from the fundus image using the ground truth segmentation. The location of the disc and cup are the main underlying cues that determines the cup to disc ratio. Therefore, the spatial structures are very useful in suggesting the cup to disc ratio. We use a multi-scale spatial pyramid of local binary pattern (LBP) histogram to encodes local texture, as well as their spatial arrangements. In our approach, LBP histograms are computed at three level of spatial pyramid. In the first level, LBP histogram is computed for entire disc image. In the second and third level, the LBP histograms are computed in overlapping patches of size h/2×w/2 pixels and h/4×w/4 respectively. The LBP histograms computed over all the spatial patches are then concatenated in a predefined order to form a global feature vectorx. We then use Boosted Regression Tree (BRT) [11] to model the CDRestimation using the extracted features. BRT iteratively builds a strong regressor from several weak regressors and expressed in the following additive form:
Fm(x) =Fm−1(x) +γ fm(x), (2)
where Fm is a regressor obtained at mth iteration, fm is the weak regressor modeled using a regression tree andγis a shrinkage parameter that controls the learning rate and selecting 0< γ <1 helps to prevent overfitting [11]. In BRT, the regression tree fm is trained using the residuals response computed from the training samples. For the sum of square loss, residuals of the ith training sample is computed asgm(xti) = ˆci−Fmt−1(xti).Next, the regression treefm is trained using{xi, gm(xti)}
N
i=1To train the regression tree withLterminal nodes,
the feature space is recursively partitioned intoLdisjoint regions. The output response for a partition can be computed as the mean of the training residuals that falls in the partition. Optimal feature dimension and feature split values are selected by minimizing the sum of squared deviation error [11]. This way, BRT is trained by iteratively adding a regression tree to Equation 2 until training error is below a specified maximum.
2.2 Coupled Shape Regression (CSR)
Our segmentation model (denoted by Equation 3) iteratively builds strong shape regressor by cascadingT weak shape regressorsR1,· · ·RT.
St=St−1+Rt(I, St−1, ct−1) (3)
where each weak shape regressorRtis a function of a previous segmentationSt−1
to update the previous segmentation. Given an imageI and an initial OD-OC shapeS0, our method computes both OD-OC segmentation and CDR values in
iterative fashion. At each iteration, CDR is first estimated using the parameter estimation model asct=F(I, St−1). Next, the estimated CDR is used to predict
the OD-OC boundary using Equation 3. The following paragraphs describes the training of the weak shape regressor.
Training data augmentation: The proposed method generate the final seg-mentation from a given initial segseg-mentation. Each training sample is therefore augmented with multiple initial shapes. To augment theith training sample, we randomly samplektraining shapes from the remaining training set. Each sam-pled shape is transformed to fit within the OD region inIi. This results in the augmented training setnIi,Sˆi, Si0
onag
i=1 where Nag=N×k. This augmented set
is used to train the first regressor R1 in the ensemble. After the tth regressor have been trained, the augmented set is updated to formnIi,Sˆi, Sit−1
oNag i=1 where Sit−1is computed using Equation 3. Hereafter, we referSit−1as previous shape. Image Feature Extraction To train the regressorRt we compute the image features indexed by the previous shape St−1. To compute the shape indexed
image features, firstQpixel locations are sampled in the space of the mean OD-OC shape ¯Swhere each pixel location is indexed by its nearest shape point using an offset vector. Next, the pixel locations are transformed to the absolute image coordinate for each imageIiin the training set by adding the offset vector to the point inSti−1corresponding to the selected nearest point in ¯S. This way, the pixel locations are indexed relative to the previously estimated shapeSt−1, rather than
the original image coordinates. This leads to better geometric invariance against the shape variation, and in turn helps the regressors to converge more quickly [10]. The features are then computed as intensity difference between any two pixels. The pixel difference features are not only cheap to compute but also they are robust to illumination variation which is commonly present in retinal fundus imaging. We compute the difference between intensity values for any two pixel resultingQ(Q−1)/2 dimensional feature vector to train the regressorRt.
Training ofRt Given the augmented training datanI
i,Sˆi, Sit−1
onag
i=1, our goal
is to train each regressorRt in the ensemble by taking into account the param-eter estimation model trained in Section 2.1. In doing so, first, the shape index feature vector is computed fromIi using the previous shape estimate Sti−1 as described above. Second, the cdr is estimated from the trained parameter es-timation model for the given Ii and Sit−1. We regard the estimated cdr value as a derived feature, therefore, concatenate with the shape index feature vector to obtain the combined feature vectorzt
i. Next, the regressorRt is trained to map from the combined feature spacezt to the target shape increment vector
Algorithm 1 Training steps of the proposed coupled regression method for OD-OC segmentation
1. Given a set of training images and training shapesnIi,Sˆi,cˆi
oN i=1 2. Train a CDR estimator as described in Section 2.1
3. Augment the data asnIi,Sˆi, Si0
oNag
i=1 described in Section 2.2 4. Fort= 1· · ·T
(a) Compute the image-based feature vectorxt
i for each augmented sample
(b) Estimate the CDR using the trained parameter estimation model ct i =
F(I, St−1
i )
(c) Compute the shape increment vector∆St
i = ˆSi−Sit−1fori= 1,· · ·Nag
(d) Train the shape regressorRt using the training datact i,xti, ∆Sit
Nag
i=1 as de-scribed in Section 2.2.
(e) UpdateSt
i in the augmented set using the trained cascade fori= 1,· · ·Nag
∆St
i = ˆSi−Sit−1. Intuitively,Rtis trained to predict the difference between the ground truth boundary ˆSiand the boundary computed by the previous ensemble
Sit−1so that once the predicted shape increment vector is added to the previous shape (as shown in Equation 3) it results in true segmentation. Therefore, the regressorRt is trained using{zt
i, ∆Sti} Nag
i=1 as follows.
We use boosted regression tree described in Section 2.1 to modelRt. Since our output shape increment vector∆S∈RPis multi-dimensional, we model the weak learner using the multi-dimensional regression tree where each partition in the terminal nodes of the regression tree is represented by aP-dimensional constant response vector. Using BRT to model Rt aids in effective selection of higher dimensional pixel difference features. Moreover, we can represent the output response as multi-dimensional vector by maintaining the correlation between the output dimensions.
2.3 Segmentation prediction
To obtain the segmentation of cup and disc in a test image, we need to initialize the shape in the OD region. To obtain the initial OD bounding rectangle, we employed the method of Template Matching [17] which is based on edge filtering, constraint elliptical Hough transform and peripapillary atrophy detection. We then use mean shape ¯S computed from the training shapes as an initial shape by transforming the mean shape to fit within the segmented OD bounding rect-angle. The transformed mean shape is taken as an initial shape and is fed to the trained coupled regression system to obtain the final segmentation in an iterative manner. At each iteration, CDR value is estimated using the trained cdr regressor (as described in 2.1) . The estimated CDR value is then fed into the trained ensemble shape regressor (as shown in Equation 3) to update the initial segmentation of OD-OC. Therefore, afterT iterations, we obtain the final segmentation of OD-OC and the estimated CDR value.
3
Experiments
The proposed method is evaluated on the retinal images of DRISHTI-GS1 dataset[12] provided by Medical Image Processing (MIP) group, IIIT Hyderabad. All im-ages were taken with the eyes dilated, centered on OD with a Field-of-View of 30-degrees and of dimension 2896 x 1944 pixels and PNG uncompressed image format. The training and test sets of DRISHTI-GS1 contains 50 and 51 retinal image, respectively. For training images, ground truth segmentation mask of op-tic disk and cup are provided with corresponding CDR values. We did not use the test set as the ground truth is withheld. We have evaluated our segmentation approach on the dristi training set using 5−fold cross validation using holdout method. First, the drishti training set is divided into 5 sub sets and holdout method is repeated 5 times, each time one of the 5-subsets is used as the test set and other 4-subsets are put together to form a training set. Then the average segmentation performance across all 5 test sets are computed. For our training purpose, we convert the segmentation mask of OD and OC to the shape bound-ary with 120 points resulting inP = 240 dimensional OD-OC shape vector. The number of ensemble shape regressors is set toT = 20 as we found that setting
T >20 did not improve the performance.
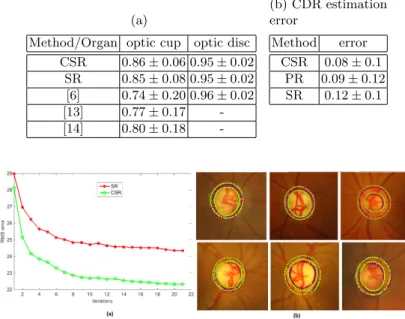
We converted the predicted disc and cup boundaries to segmentation mask for evaluation. The segmentation performance is measured in terms of F-score between the automatic segmentation mask and manual segmentation as done in the benchmark study [12]. Table 1a shows the segmentation performance of the proposed Coupled Shape Regression (CSR) method compared to the state of the art methods from the benchmark study [12]. We also compared with Shape Regression (SR) that do not take into account CDR estimation model for segmentation. We found the F-score of 0.86 for optic cup segmentation which significantly outperforms other methods while giving comparable performance for disc segmentation. The CSR method also significantly improves the seg-mentation performance in comparison to SR demonstrating the effectiveness of coupling of the CDR estimation in segmentation. To measure the segmentation performance in deriving the clinically relevant parameter, we compute CDR from the output segmentation as as the ratio of the vertical diameter of OC and OD. Table 1b compares the mean CDR estimation error for the segmentations produced by CSR and SR as well as for the intermediate CDR estimated by the parameter regressor (PR). The lowest CDR estimation error is obtained for CSR which demonstrates that our method can accurately predict the clinically relevant parameter.
Figure 1 (a) shows the average RMSE error between the ground truth shape and the estimated shape for each iteration of CSR and SR. This illustrates that the coupling of the parameter regressor in CSR has significant impact in improv-ing the segmentation performance. Figure 1 (b) shows the segmentation output of our proposed method and corresponding manual segmentations for both optic disc (outer boundary) and optic cup (inner boundary). Experiments are per-formed on an Intel Core i7 CPU @ 2.6 GHz. The method took 600 milliseconds
Table 1: (a) Optic disc/cup segmentation performance of the proposed method compared with other state of the art methods. The benchmark results are for the training set and are taken from [12]. (b)Mean CDR estimation error compared to other methods
(a)
Method/Organ optic cup optic disc CSR 0.86±0.06 0.95±0.02 SR 0.85±0.08 0.95±0.02 [6] 0.74±0.20 0.96±0.02 [13] 0.77±0.17 -[14] 0.80±0.18 -(b) CDR estimation error Method error CSR 0.08±0.1 PR 0.09±0.12 SR 0.12±0.1
Fig. 1: Example outputs of our proposed OD-OC segmentation method. The manual segmentations are outlined in red color and automatic segmentation are outlined in yellow color. The outer and inner boundaries respectively corresponds to optic disc and cup.
to segment both OD and OC in a retinal fundus image after the OD insert points have been detected.
4
Conclusions
We have proposed a coupled regression method to segment optic disc/cup by leveraging the CDR parameter estimation model in retinal fundus images. The proposed segmentation method consists of an ensemble non-linear shape regres-sors that takes into account the CDR estimated by a parameter regressor. The parameter regressor is trained to predict the CDR directly from the image. Our method starts with an initial shape which is iteratively updated by each regressor in the ensemble to obtain the final shape. We modeled the parameter regressor and each regressor in the ensemble using boosted regression trees. Experimen-tal evaluation shows that the proposed method outperforms existing optic cup segmentation methods, while competing with optic disc segmentation methods.
References
1. H.A. Quigley, A.T. Broman, The number of people with glaucoma worldwide in 2010 and 2020, Br. J. Ophthalmol, vol. 90, pp. 262-267, 2006.
2. M.A. Kass, D.K. Heuer, E.J. Higginbotham, et al., The Ocular Hypertension Treat-ment Study: a randomized trial determines that topical ocular hypotensive med-ication delays or prevents the onset of primary open-angle glaucoma, Arch. Oph-thalmol, vol. 120, pp. 701-713, 2002.
3. Mittapalli, P.S. and Kande, G.B. Segmentation of optic disk and optic cup from digital fundus images for the assessment of glaucoma. Biomedical Signal Processing and Control, vol. 24, pp. 34-46, 2016.
4. Almazroa, Ahmed, et al. Optic Disc and Optic Cup Segmentation Methodologies for Glaucoma Image Detection: A Survey, J. Ophthalmol, 2015.
5. A.Aquino, M. Gegundez-Arias, and D. Marin., Detecting the optic disc boundary in digital fundus images using morphological edge detection and feature extraction techniques, IEEE Trans. Med. Imag, vol. 20, no. 11, pp. 1860-1869, 2010. 6. G.D. Joshi, J. Sivaswamy, and S.R. Krishnadas, Optic disk and cup segmentation
from monocular color retinal images for glaucoma assessment, IEEE Trans. Med. Imag, vol. 30, no. 6, pp. 1192-1205, 2011.
7. J. Cheng, J. Liu, and et. al., Superpixel classification based optic disc and optic cup segmentation for glaucoma screening, IEEE Trans. Med. Imag, vol. 32, no. 6, pp. 1019-1032, 2013.
8. D.W.K.Wong and et. al.Level set based automatic cup to disc ratio determination using retinal fundus images in argali, in Proc. IEEE EMBC, pp. 2266-2269, 2008. 9. Y. Xu, L. Duan, and et. al., Optic cup segmentation for glaucoma detection using low rank superpixel representation, in Proc. MICCAI Part 1, pp. 788-795, 2014. 10. Xudong Cao, Yichen Wei, Fang Wen, and Jian Sun. Face alignment by explicit
shape regression. IJCV, 107(2):177–190, 2014.
11. Jerome H. Friedman. Greedy function approximation: A gradient boosting ma-chine. Annals of Statistics, 29:1189–1232, 2000.
12. J. Sivaswamy, S.R. Krishnadas, G. Datt Joshi, M. Jain, and A. Ujjwaft Syed Tabish. DRISHTI-GS: Retinal image dataset for optic nerve head(onh) seg-mentation. ISBI, pp. 53–56, 2014.
13. Joshi, G.; Sivaswamy, J.; Krishnadas, S.R., Depth Discontinuity-Based Cup Seg-mentation From Multiview Color Retinal Images, in Biomedical Engineering, IEEE Transactions on , vol.59, no.6, pp. 1523-1531, 2012.
14. Chakravarty. A, Sivaswamy. J, Coupled Sparse Dictionary for Depth-Based Cup Segmentation from Single Color Fundus Image, MICCAI , pp. 745-754, 2014. 15. Chen, Xiangyu, et al. Automatic Feature Learning for Glaucoma Detection Based
on Deep Learning. Medical Image Computing and Computer-Assisted Interven-tion–MICCAI, pp. 669-677, 2015.
16. Kohler, Thomas, et al. Computer-Aided Diagnostics and Pattern Recognition: Au-tomated Glaucoma Detection. Teleophthalmology in Preventive Medicine. Springer Berlin Heidelberg, pp. 93-104, 2015.
17. Cheng, J., Liu, J., Wong, D.W.K., Yin, F., Cheung, C.Y., Baskaran, M., Aung, T., Wong, T.Y.: Automatic Optic Disc Segmentation with Peripapillary Atrophy Elimination. In: IEEE Int. Conf. Engin. in Med. and Biol. Soc., pp. 6224–6227, 2011.