Characterisation and in vitro simulation
of the natural hip
Rachel Louise Pallan
(CEng, MEng, Hons)
Submitted in accordance with the requirements for the degree of
Doctor of Philosophy
The University of Leeds
School of Mechanical Engineering
September 2016
The candidate confirms that the work submitted is his/her own and that
appropriate credit has been given where reference has been made to the
work of others.
This copy has been supplied on the understanding that it is copyright
material and that no quotation from the thesis may be published without
proper acknowledgement.
© 2016 The University of Leeds and Rachel Louise Pallan
The right of Rachel Louise Pallan to be identified as Author of this work
has been asserted by her in accordance with the Copyright, Designs and
Patents Act 1988.
Acknowledgements
I can honestly say I have never been happier than the moments I have just spent writing the last few words of my thesis. To say it has been a challenge is an understatement. It’s been a rollercoaster where I have both hated and loved this PhD. I can’t even put into words the gratitude I have for the people who kept me sane throughout this journey and for laughing with me, not at me, during my many failed attempts at science.
I would like to acknowledge the EPSRCs support of the DTC who fully funded my research under the supervision of Dr S Williams, Prof J Tipper and Prof J Fisher. Therefore, my first thanks, out of a long list, goes to my supervisor, Sophie Williams. She has shown immense support and patience throughout my PhD, without her guidance and knowledge this work would not have been possible. She has been a fantastic mentor who has believed in me and encouraged me throughout this journey and has even taught me a few dance moves along the way. There has never been a moment where she hasn’t made time for me and her enthusiasm has never faltered, for that I am truly grateful. I would also like to thank my co-supervisors Joanne Tipper and John Fisher, for their guidance and support. Their time and commitment has been greatly appreciated throughout the years.
I would also like to thank all members of the iMBE, at some point; somehow, they have all played a role in supporting me and the work I have carried out at the University of Leeds. Special thanks go out to Hazel Fermor, Abdel Abdelgaied, Tony Herbet and Dawn Groves for their training and assistance as well as the technicians who have fixed and made numerous components for me.
My family have been unbelievable throughout this journey and have provided a never ending source of support and encouragement. They have never doubted me and have been there for every obstacle I have overcome to allow me to do what I could have only dreamt of. I would like to thank them from the bottom of my heart, without them I would not have been where I am today. To Rob, I am truly grateful for driving the numerous miles you did over the four years to come and see me, for loving the many sides of me you have seen throughout my PhD and for keeping me company on the flight to Las Vegas for ORS. To my friends, I am truly grateful for never complaining at my absence and especially Viv, who for the last 17 years has not only been by my side supporting me has waited for me to finish writing my thesis so we can plan her wedding.
Abstract
Abnormal hip joint morphology, associated with diseases such as femoroacetabular impingement (FAI) or developmental dysplasia of the hip (DDH), is thought to be a precursor of osteoarthritis (OA) in the hip. Changes in joint morphology alter the loading pattern through the hip, which results in damage to the tribological interface, including labral tears and/or labral-cartilage separation. Evidence shows that early intervention to repair the labrum is more beneficial than labral excision; however scientific understanding of the tissue and the effect of surgical treatments are limited. It is hypothesised that an in vitro natural hip simulation system could be used in biomechanical testing of hip joint tissues as well as generating labral damage which could be used to assess current and new surgical treatment methods for the labrum. Initial quantitative assays revealed human and porcine labral tissue to have higher collagen content but lower water and GAG content than articular cartilage. Histological staining identified the structure of collagen within the labrum and cartilage, as well as the dispersion of GAGs, in human and porcine tissue. Slight differences were seen between the two species with the human labrum containing more connective tissue compared to the porcine labrum, which was primarily composed of fibrocartilage, and less GAGs. Mechanical tests identified little variation between the compressive properties of the human and porcine labrum however, larger differences were identified in the tissues tensile properties, where by the human labrum was stronger than the porcine labrum. Labral tissue was also found to be weaker in compression in comparison to cartilage tissue.
An in vitro natural hip model was successfully developed using clinically relevant conditions. The cup inclination angle was set at 45 °, a full ISO14242 gait cycle was applied to the joint with a peak load of 750 N, to account for porcine tissue. No labral or cartilage damage was observed after 10800 cycles. In vitro labral damage was also successfully developed, by increasing the acetabular cup angle to 60 ° and increasing the load by 50 %. The model was run through the full gait cycle for a minimum of 10800 cycles. Damage was classified using the Outerbridge and Lage systems. All types of labral damage outlined in the Lage classification system were identified within the model. Labral damage was found to progress from labral flattening, to radial fibrillation followed by longitudinal peripheral tears.
The methodology and findings within this study can be used in future studies and can be advanced to mechanically test the soft tissues of the hip in situ, as well as the effect of labral damage on the functions of the hip joint and potential labral treatments.
Table of contents
Acknowledgements ... iii
Abstract ... iv
Table of Contents ... v
List of Figures ... x
List of Tables ... xiv
Abbreviations ... xv
Chapter 1 Introduction ... 1
1.1 General introduction ... 2
1.2 The human hip ... 3
1.2.1 Healthy hip joint anatomy ... 4
1.2.2 Healthy hip joint biomechanics ... 5
1.2.3 Abnormal hip joint biomechanics ... 8
1.3 Cartilage ... 10
1.3.1 Cartilage macrostructure ... 10
1.3.2 Cartilage microstructure ... 11
1.3.3 Cartilage mechanical properties ... 15
1.3.4 Cartilage damage... 19
1.4 Acetabular Labrum ... 22
1.4.1 Labrum macrostructure ... 23
1.4.2 Labrum microstructure ... 24
1.4.3 Labrum mechanical properties ... 26
1.4.4 Labrum function ... 27
1.4.5 Labrum damage... 28
1.4.6 Labrum treatment ... 32
1.5 Tissue degeneration and subsequent diseases ... 35
1.5.1 Hip dysplasia ... 35
1.5.2 Osteoarthritis ... 38
1.5.3 Femoroacetabular impingement ... 42
1.6.1 Computational models ... 46
1.6.2 Simulator models ... 47
1.7 Aims & Objectives ... 49
Chapter 2 Materials and methods ... 50
2.1 Introduction ... 51
2.2 General materials and methods ... 52
2.2.1 Equipment, reagents and consumables ... 52
2.2.2 Measurement of pH ... 52 2.2.3 Microscopy ... 52 2.2.4 Photography ... 52 2.2.5 Sterilisation ... 52 2.3 Tissue acquisition ... 53 2.3.1 Dissection equipment ... 53
2.3.2 Porcine tissue acquisition ... 54
2.3.3 Human tissue acquisition ... 55
2.3.4 Macroscale measurements ... 57
2.3.5 Pin extraction ... 57
2.3.6 Tensile specimen preparation ... 59
2.3.7 Histological and immunohistochemical specimen preparation ... 60
2.3.8 Biochemical assay specimen preparation ... 62
2.4 Biochemical assay reagents and methods ... 64
2.4.1 Glycosaminoglycan quantification assay ... 64
2.4.2 Hydroxyproline quantification ... 65
2.5 Basic histological & immunohistochemical techniques ... 67
2.5.1 Fixation ... 67
2.5.2 Decalcification ... 67
2.5.3 Tissue processing ... 68
2.5.4 Paraffin wax embedding of sections ... 68
2.5.5 Sectioning of wax blocks ... 69
2.5.7 Dehydration and mounting ... 69
2.6 Histological staining methods ... 70
2.6.1 Reagents ... 70
2.6.2 Haematoxylin and eosin ... 70
2.6.3 Sirius red and Miller’s elastin ... 71
2.6.4 Alcian blue ... 71
2.7 Immunohistochemical staining methods ... 72
2.7.1 Immunohistological reagents ... 72
2.7.2 Immunohistochemical methods ... 73
2.8 Statistical analysis ... 75
2.8.1 Parametric numerical data ... 75
2.8.2 Percentage data ... 75
2.8.3 Interpolated data ... 75
2.9 Summary ... 76
Chapter 3 Biological and biochemical characterisation of porcine and human acetabular labrum and articular cartilage ... 77
3.1 Introduction ... 78
3.2 Aims and objectives ... 79
3.3 Biochemical characterisation materials ... 80
3.4 Biochemical characterisation methods ... 81
3.3.1 Determination of water content method ... 81
3.3.2 Determination of GAG content method ... 81
3.3.3 Determination of collagen content method ... 82
3.5 Biological characterisation methods ... 84
3.5.1 Histological evaluation ... 84
3.5.2 Immunohistochemical evaluation ... 84
3.6 Results ... 87
3.6.1 Macro scale observations ... 87
3.6.2 Determination of water content ... 88
3.6.4 Determination of collagen quantification ... 92
3.6.5 Histological evaluation of labrum, cartilage, and the labral-cartilage junction .. 94
3.6.6 Immunohistochemical evaluation of labrum, cartilage, and the labral-cartilage junction 108 3.7 Discussion ... 110
Chapter 4 Biomechanical characterisation of porcine and human acetabular labrum and cartilage 115 4.1 Introduction ... 116
4.2 Aims and objectives ... 118
4.3 Compressive biomechanical materials and methods ... 119
4.3.1 Experimental approach ... 119
4.3.2 Creep indentation testing ... 121
4.3.3 Creep unconfined testing ... 122
4.3.4 Tissue thickness measurements ... 122
4.3.5 Compressive data analysis ... 123
4.3.6 Indentation rig calibration ... 127
4.4 Tensile biomechanical materials and methods ... 128
4.5 Results ... 133
4.5.1 Compressive results ... 133
4.5.2 Tensile results ... 139
4.6 Discussion ... 142
Chapter 5 In vitro simulation of the natural hip joint ... 146
5.1 Introduction ... 147
5.2 Aims and objectives ... 150
5.3 Overview ... 151 5.4 Simulator overview ... 152 5.4.1 Simulator calibration ... 153 5.5 General methodology ... 155 5.5.1 Lubrication ... 155 5.5.2 Specimen fixation ... 155 5.5.3 Specimen dissection ... 155
5.6 Development of specimen holders and fixtures ... 157 5.7 Specimen alignment ... 159 5.7.2 Specimen mounting... 161 5.8 Test analysis ... 163 5.8.1 Sample imaging... 163 5.8.2 Sample analysis ... 164 5.9 Test inputs ... 166
5.9.1 Natural hip joint model ... 166
5.9.2 Labral damage model ... 167
5.10 Results ... 171
5.10.1 Natural hip joint model ... 171
5.10.2 Labral damage model ... 172
5.11 Discussion ... 182
5.11.1 Natural hip joint model ... 182
5.11.3 Labral damage model ... 182
Chapter 6 Overall discussion and conclusions ... 187
6.1 General Discussion ... 188 6.2 Tissue selection ... 192 6.3 Biological characterisation ... 193 6.4 Mechanical characterisation ... 195 6.5 In vitro simulation ... 197 6.6 Future Work ... 200 6.7 Overall conclusion ... 203 Appendices ... 204 Appendix A – Materials ... 204
Appendix B – Mechanical drawings ... 210
List of figures
Figure 1-1 The synovial hip joint.. ... 3
Figure 1-2 Anatomical terms of location of the hip. ... 4
Figure 1-3. Elastic deformation of the acetabulum.. ... 5
Figure 1-4 Anatomical planes and rotations of the natural hip joint. ... 6
Figure 1-5 Centre of gravity through the pelvis during stance. 7 Figure 1-6 Hip joint reaction forces during gait... 8
Figure 1-7 Zones of articular cartilage. ... 11
Figure 1-8 Microstructural organisation of articular cartilage. ... 14
Figure 1-9 Stress-strain curve of articular cartilage. ... 17
Figure 1-10 Regions of the acetabular labrum. ... 22
Figure 1-11 Acetabular labral fixations and dimensions ... 23
Figure 1-12 Labral collagen fibre alignment diagram ... 24
Figure 1-13 The blood supply to the acetabular labrum.. ... 25
Figure 1-14 Typical stress-strain curve for a soft tissue. ... 27
Figure 1-15 Acetabular labral tear. ... 29
Figure 1-16 Acetabular labral avulsion. ... 29
Figure 1-17 Acetabular labral tear classification.. ... 31
Figure 1-18 Acetabular labral debridement. ... 33
Figure 1-19 Labral refixation. ... 33
Figure 1-20 Dysplastic hip.. ... 36
Figure 1-21 The axis and movements of the hip joint. ... 38
Figure 1-22 Arthritic hip. ... 40
Figure 1-23 Pistol grip deformity. ... 41
Figure 1-24 Femoroacetabular impingement. ... 43
Figure 1-25 Femoral osteoplasty... 45
Figure 2-1 Summary of the methods used in this study. ... 51
Figure 2-2 Dissection equipment for gross tissue dissection. ... 53
Figure 2-3 General porcine dissection. ... 54
Figure 2-4 General human dissection. ... 56
Figure 2-5 Macroscale measurements. ... 57
Figure 2-6 Labral pin extraction. ... 58
Figure 2-7 Osteochondral pin extraction. ... 59
Figure 2-8 Labral tensile specimen preparation. ... 60
Figure 2-9 Image showing the orientation of a histology or immunohistochemistry specimens.. ... 61
Figure 2-10 Acetabular and labral histological and immunohistochemical specimen preparation..
... 61
Figure 2-11 Tissue maceration for assays. ... 63
Figure 2-12 Embedding of tissue sections. ... 69
Figure 3-1 Femoral head osteochondral pin extraction. ... 80
Figure 3-2 GAG assay standards. ... 82
Figure 3-3 Collagen assay standards. ... 83
Figure 3-4 Anatomical locations of the acetabulum. T ... 84
Figure 3-5 Macroscale observation of the human and porcine hip joint. ... 87
Figure 3-6 Water content of porcine acetabular cartilage, femoral cartilage, and acetabular labrum, from load-bearing and non-load-bearing regions. ... 89
Figure 3-7 Water content of human and porcine cartilage and labrum. 90 Figure 3-8 GAG quantification of porcine acetabular cartilage, femoral cartilage, and acetabular labrum, from load-bearing and non-load-bearing regions. ... 91
Figure 3-9 GAG quantification of human and porcine cartilage and labrum. ... 92
Figure 3-10 Collagen quantification of porcine acetabular cartilage, femoral cartilage, and acetabular labrum, from load-bearing and non-load-bearing regions. ... 93
Figure 3-11 Collagen quantification of human and porcine cartilage and labrum. ... 94
Figure 3-12 H&E staining of the acetabular cross-sections from three regions around the porcine acetabulum and the anterior human acetabulum. ... 96
Figure 3-13 Variation in labral morphology of the human acetabulum. H&E staining of the human acetabulum. ... 97
Figure 3-14 H&E staining of the porcine and human acetabulum. ... 98
Figure 3-15 H&E staining of labrum. ... 99
Figure 3-16 H&E staining of cartilage. ... 100
Figure 3-17 Brightfield illumination of sirius red & Miller’s elastin stained porcine and human labral and cartilage tissue.. ... 102
Figure 3-18 Polarised illumination of sirius red and Miller’s elastin stained porcine and human acetabulum. ... 103
Figure 3-19 Polarised illumination of sirius red & Miller’s elastin stained porcine and human labral and cartilage tissue. ... 106
Figure 3-20 Alcian blue stained porcine and human labral sections... 107
Figure 3-21 Immunohistochemistry staining of acetabular cross-sections for collagen I and II. ... 109
Figure 4-1 Indentation rig. ... 121
Figure 4-2 Labral tissue thickness measurement. ... 122
Figure 4-4 Time-displacement graph of displacement from shaft release and displacement from
instantaneous response analysis for cartilage tissue... 124
Figure 4-5 Time-displacement graph of Displacement from Shaft Release and Displacement from Instantaneous Response analysis for labral tissue. ... 124
Figure 4-6 Finite element analysis model of a osteochondral pin... 126
Figure 4-7 Experimental and computational time displacement curves. ... 126
Figure 4-8 Displacement calibration. ... 127
Figure 4-9 Instron testing machine. ... 128
Figure 4-10 Tensile specimen set up for labral tissue. ... 129
Figure 4-11 Typical stress-strain curve for labral tissue. ... 130
Figure 4-12 Tensile testing gripping methods and specimen shaping.. ... 132
Figure 4-13 Time-displacement curves for labral tissue under four conditions. ... 134
Figure 4-14 Labral strain under four test conditions. ... 134
Figure 4-15 Compression testing of porcine and human labrum and cartilage. ... 135
Figure 4-16 Deformation percentage of porcine and human cartilage and labral tissue. ... 136
Figure 4-17 Human cartilage time-displacement graph.. ... 138
Figure 4-18 Tensile stress-strain graphs. ... 140
Figure 5-1 ISO standard 14242 hip joint gait cycle. ... 148
Figure 5-2 Adverse loading conditions in hip joint replacements. ... 149
Figure 5-3 Flow chart of the method development for the in vitro simulation models. ... 151
Figure 5-4 Single station hip simulator set up and axes.. ... 152
Figure 5-5 Simulator calibration. ... 154
Figure 5-6 Acetabular cup and femoral head dissection. ... 156
Figure 5-7 Acetabular cup holder. ... 157
Figure 5-8 Femoral holder. ... 158
Figure 5-9 Alignment rigs. ... 159
Figure 5-10 Acetabular cup alignment. ... 160
Figure 5-11 Femoral head alignment.. ... 161
Figure 5-12 Hip simulator set up. ... 162
Figure 5-13 Camera set up. ... 164
Figure 5-14 Sample alignment markers for photography.. ... 164
Figure 5-15 Cup inclination angle. ... 166
Figure 5-16 Porcine and human gait cycle. ... 167
Figure 5-17 Increased cup inclination angle for labral damage model. 168 Figure 5-18 Load cycle for labral damage model. ... 169
Figure 5-19 Medial-lateral displacement for labral damage model. ... 170
Figure 5-20 Natural hip joint model results. ... 171
Figure 5-22 Increased cup angle of 65 ° for labral damage model. ... 174
Figure 5-23 Medial lateral displacement for labral damage model.. ... 176
Figure 5-24 Increased load of 3000 N (55 °) for labral damage model. ... 178
Figure 5-25 Increased load of 1500 N (55 °) for labral damage model. ... 179
Figure 5-26 Increased load of 1500 N (65 °) for labral damage model. ... 180
List of tables
Table 1-1 Full ranges of motion of the natural hip joint ... 6
Table 1-2 Ranges of motion of the hip during daily activities. ... 6
Table 1-3 Approximate fractional composition of articular cartilage. ... 12
Table 2-1 Human donor demographics. ... 55
Table 2-2 Tissue processing solutions and times for histology and immunohistochemistry samples.. ... 68
Table 3-1 Absorbency readings for GAG assay dilution factor. ... 82
Table 3-2 Collagen tissue dilution absorbencies. ... 83
Table 3-3 Table of antibodies and antigen retrieval methods optimised for staining of human tissue. ... 85
Table 3-4 Summary of human and porcine specimen geometry. ... 88
Table 4-1 Indentation and unconfined compression applied loads. ... 119
Table 4-2 Specimen thickness for tissue used in creep testing. ... 133
Table 4-3 Equilibrium Young’s modulus determined from time-displacement data. ... 137
Table 4-4 Material properties of porcine and human cartilage (DIR) determined from the computational model. ... 137
Table 4-5 Tensile specimen dimensions.. ... 139
Table 4-6 Tensile properties of porcine and human labrum. ... 141
Table 5-1 Hip simulator programmable ranges. ... 153
Table 5-2 Lage classification system of labral damage.. ... 165
Table 5-3 Outerbridge classification system of cartilage damage.. ... 165
Table 5-4 Method development for labral damage model. ... 167
Table 5-5 Summary of increased angle test results and analysis for labral damage model specimens. ... 172
Table 5-6 Summary of ML displacement test results and analysis for labral damage model specimens. ... 175
Table 5-7 Summary of increased load test results and analysis for labral damage model specimens. ... 177
Abbreviations
2D Two-dimensional
3D Three-dimensional
AA Abduction-adduction
ANOVA Analysis of variance
AP Anterior-posterior
BSA Bovine serum albumin
BW Body weight
C/B Cartilage bruising
C/C Colour change
C/D Cartilage damage
Ce/D Cement damage
CL Confidence limit
CoCr Cobalt-chromium CoR Centre of rotation
CT Computed tomography
DAB Diaminobenzidine
DIR Displacement including instantaneous response DDH Developmental dysplasia of the hip
DSR Displacement from shaft release ECM Extracellular matrix
DMB Dimethylene blue
EDTA Ethylenediaminetetraacetic acid FAI Femoroacetabular impingement
FE Flexion-extension FEA Finite element analysis GAG Glycosaminoglycan H&E Haematoxylin and eosin IE Internal-external rotation
ISO International Organization for Standardization
L/D Labral damage
L/F Labral flattening L/P Labral peripheral
LVDT Linear variable differential transformer NBF Neutral buffered formalin
ML Medial-lateral
MRI Magnetic resonance imaging
OA Osteoarthritis
PBS Phosphate buffered saline PMMA Polymethylmethacrylate R/F Radial fibrillation
SEM Scanning electron microscopy
S/W Stripe wear
TAL Transverse acetabular ligament TBS Tris buffered saline
UK United kingdom
Chapter 1
Introduction
1.1
General introduction
The hip joint is the second largest weight bearing joint in the body, and is highly adapted to its function to allow for load transmission and large ranges of motion to the lower body (Clarkson 2005; Al-Obaid et al. 2007). The morphology of the hip joint plays a key role in its stability, hence when modifications to the structure occur, it can result in catastrophic damage (Bredella 2011). The soft tissues within the hip also aid in its ability to function. The composition of articular cartilage varies compared to that of the closely associated acetabular labrum, giving them the ability to perform specific functions. The articular cartilage’s function is to aid in the movement of the hip whilst minimising contact stresses, whereas the labrum’s function is to increase stability and seal the joint (Petersen et al. 2003; Athanasiou et al. 2009; Link 2011). Damage can occur independently to the bony structure of the hip or to the soft tissues within the joint. Soft tissue damage to the articular cartilage or labral tissue within the hip joint can be a direct result of the abnormalities in the bony structure; leading to abnormal joint loading, or as a result of trauma or disease which independently affects the tissue (Ferguson et al. 2003; Berry & Lieberman 2012).
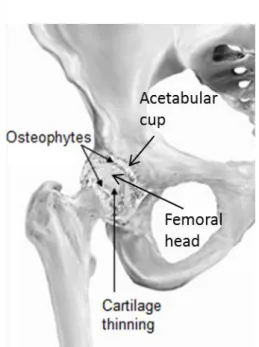
OA is the most common joint disease, affecting around 8.5 million people in the UK in 2012 (Smith 2012), however little is known about the etiology of the disease. FAI and DDH are both associated with the initiation of OA and characterised by alteration in geometry and altered contact mechanics. They cause damage to the soft tissues of the hip due to altered mechanical stresses (Ferguson et al. 2003; Ganz et al. 2008; Talmage 2009). It is therefore crucial to gain an understanding of how the morphology of the hip impacts on soft tissue damage, in order to develop an understanding of the causes of hip joint diseases.
1.2
The human hip
In the human body, the hip joint is significantly larger and more stable than many other joints and has the ability to allow for large ranges of motion (Frankel & Pugh 1984; Nordin & Frankel 2001). It is composed of two bones; the head of the femur and the acetabulum of the pelvis, connected together by internal and external ligaments (Figure 1-1). Due to the femoral head and acetabulum’s conformity, they form a moderately stiff ball and socket joint, providing the hip with its intrinsic stability (Frankel & Pugh 1984). In order to produce the large ranges of motion required for everyday activities such as walking, sitting, bending and squatting, the joint must be precisely aligned and controlled (Frankel & Pugh 1984; Nordin & Frankel 2001).
Figure 1-1 The synovial hip joint. The capsule surrounding the hip joint. Diagram adapted from Johnson et al. (2004).
The role of the hip joint is to allow for large ranges of motion whilst withstanding high mechanical loads (Whiting et al. 2006). It is capable of this due to the aid of the soft tissues within the joint. The articulating surfaces of the hip joint are protected by a smooth layer of articular cartilage, both cushioning the bone and allowing for effortless movement (Drake et al. 2012). As well as articular cartilage, there is a fibrocartilaginous lip around the acetabulum, known as the labrum, creating a deeper socket, to provide further stability (Figure 1-1, Ferguson et al. 2001). The labrum transitions directly into the articular cartilage, known as the labral-cartilage junction, and directly to the acetabular rim, on both the articulating and non-articulating surfaces (Lewis & Sahrmann 2006). The hip joint is surrounded by a loose joint capsule, known as a synovial membrane, giving the hip joint its name as a synovial joint. Synovial fluid is produced by the synovial membrane, which has the ability to absorb and secrete, and is responsible for the supply of nutrients to articular cartilage.
1.2.1
Healthy hip joint anatomy
The conformity of the hip joint plays an important role in the stability of the joint (Radin 1980). The acetabulum is a concave surface making the ‘socket’ component of the ball and socket configuration, whilst the femoral head is a conforming convex surface, producing the ‘ball’ component of the ball and socket configuration. The femoral head is two-thirds of a sphere and is slightly compressed in an approximate anterior-posterior (AP) direction, whilst the acetabulum is shaped like a horse-shoe (Figure 1-2, Rydell 1973; Radin 1980; Nordin & Frankel 2001). The femoral neck is approximately 30-40mm long and lies in the lateral direction to the head. At its medial end the femoral neck is virtually cylindrical, with its shape becoming increasingly elliptical towards its distal end (Rydell 1973).
Figure 1-2 Anatomical terms of location of the hip. A posterior view of the pelvis and acetabulum and their orientation within the body. Image adapted from OpenStax College,
(2013)
The acetabulum and femoral head provide the hip joint with some elasticity due to their trabecular bone composition. The deformable bone allows the joint to undergo essential spreading during loading, reducing the stress placed on the articular cartilage to a tolerable magnitude. When the acetabulum is unloaded its diameter is smaller than that of the femoral head, allowing it to undergo elastic deformation to become congruous around the femoral head during loading, resulting in maximum contact area and congruence, as seen in Figure 1-3. In a congruous hip the contact area is formed around the periphery of the anterior, superior and posterior articular surface of the acetabulum. If the joint was congruent under no load, during loading the acetabulum and femoral head would be incongruent, resulting in a reduced contact area against the acetabulum and increased force (Radin 1980; Konrath et al. 1998; Nordin & Frankel 2001).
Figure 1-3. Elastic deformation of the acetabulum. The acetabulum is seen before and after deformation, where it deforms around the femoral head congruently, image adapted from Radin,
(1980).
1.2.2
Healthy hip joint biomechanics
There has been a great deal of research into the kinematics and kinetics of the hip, providing surgeons with a greater understanding of the vast mechanical disorders of the hip and enabling them to develop successful surgical treatments to improve or restore natural function. Research into the biomechanics of the hip produces a clear understanding of the mechanical characteristics of the joint structure, the key relationships between the internal and external loads, and the direction of the joint and muscles forces (Frankel & Pugh 1984).
1.2.2.1
In vivo kinematics of the healthy hip joint
The natural hip joint allows for almost unrestricted rotation, with a gliding surface motion of the femoral head articulating against the acetabulum and labral tissue (Monkhouse 2007; Loudon et al. 2013). The rotation of the femoral head in the acetabulum can be characterised in three planes (sagittal, frontal and transverse, Figure 1-4) around the femoral head’s centre of rotation (CoR). Rotation is greatest in the sagittal plane, followed by the transverse and frontal plane (Table 1-1, (Nordin & Frankel 2001; Khurana 2009). Although rotation is relatively unlimited, subluxation (dislocation) of the hip joint and translation in the anterior/posterior and medial/lateral direction is limited (Stewart & Hall 2006).
Table 1-1 Full ranges of motion of the natural hip joint (Nordin & Frankel; 2001).
Plane Direction Range
Sagittal Flexion 0°-140°
Sagittal Extension 0°-15°
Frontal Abduction 0°-30°
Frontal Adduction 0°-25°
Transverse Internal Rotation 0°-90° Transverse External Rotation 0°-70°
Figure 1-4 Anatomical planes and rotations of the natural hip joint. Sagittal, transverse and frontal plane of the human body with flexion-extension, abduction-adduction and
internal-external motion.
The range of motion that the hip is capable of producing far exceeds the requirement of daily activities. Activities such as walking and climbing stairs require relatively small ranges of motion; however activities such as tying shoes, sitting and squatting are a lot more demanding on the hip (Table 1-2, Stewart & Hall 2006). During gait, the hip joint undergoes maximum flexion in the late swing phase, as the leg moves forward for heel strike and experiences maximum extension at toe-off. Maximum adduction and internal rotation is experienced during the stance phase and abduction and external rotation during the swing phase (Figure 1.6, Nordin & Frankel 2001).
Table 1-2 Ranges of motion of the hip during daily activities. Table adapted from Nordin & Frankel (2001); Stewart & Hall (2006).
Plane Walking Climbing Stairs Tying Shoes Sitting Squatting
Sagittal 30° 67° 129° 104° 122°
Frontal 9° 16° 18° 20° 28°
Transverse 7° 18° 13° 17° 26°
1.2.2.2
In vivo kinetics of the healthy hip joint
Kinetic studies on the hip joint have enabled the moments and forces, produced by external loads, body weight (BW) and muscle action, to be determined. A clearer understanding of the in vivo forces acting on the hip can aid in minimising abnormal loading of the hip, which can result in degenerative joint diseases, as well as developing clinical solutions for surgical procedures to reduce or eliminate pre-existing hip conditions (Komistek et al. 2005).
During everyday activities the hip supports large loads, requiring large muscle groups to stabilise the joint. The determination of the loading across the hip can be complex due to the vast ranges of movement the hip is capable of producing, as well as the large number of muscle groups involved in the movements. Although there are a range of methods for determining the joint reaction forces of the hip, a simplified free-body technique for coplanar forces or a mathematical model of the equilibrium equations have proven popular. Kinetic studies can be separated into two types; static forces that act during one-legged or two-legged stance and forces that act during dynamic motion (Paul 1966; Nordin & Frankel 2001).
During two-leg stance, the centre of gravity passes posterior to the pubis symphysis and close to the frontal plane between the centre of the two femoral heads (Figure 1-5). As the centre of gravity is essentially through the middle of the body, theoretically an erect stance is possible with little or no muscular force. This is possible due to the stabilising of the joint capsule and capsular ligaments. During two-leg stance the hips support 62% of the BW; hence if the body is symmetrical, each hip will carry 31% of the BW (Maquet 1985; Nordin & Frankel 2001).
Figure 1-5 Centre of gravity through the pelvis during stance. The centre of gravity is located close to the frontal plane through the centre of the two femoral heads, taken from
Maquet (1985)
During single-leg stance, an individual hip will carry 81% of the total BW, resulting in an eccentric load on the hip, causing the pelvis to tilt and the hip to become adducted. The centre of gravity becomes altered in all three planes, causing forces from the muscles to counteract the moments around the hip, resulting in a joint reaction force. An alteration in the centre of gravity,
and hence the lever arm length of the gravitational force, determines the magnitude of the moments about the hip, and therefore the joint reaction force (Maquet 1985; Nordin & Frankel 2001).
There have been several studies on the loads of the hip joint during dynamic activity, with a range of magnitudes for peak joint loading (Maquet 1985; Nordin & Frankel 2001; Stewart & Hall 2006). A study by Paul (1976)calculated the resultant hip joint forces during the gait cycle at slow (1.10 m/s), medium (1.48 m/s), and fast (2.01 m/s) pace walk in 36 subjects. Two peak forces were identified just after heel-strike and just before toe-off. At a slow pace, peak loads of approximately 3 and 4 times body weight were identified at heel strike and toe-off respectively. At a medium pace average peaks at 4 and 5 times body weight were identified and at a face pace peak loads were as high as approximately 7 and 8 times body weight during heel strike and toe-off respectively (Figure 1-6).
Figure 1-6 Hip joint reaction forces during gait. The resultant hip joint forces during gait are shown for a range of walking paces, adapted from (Paul, 1976).
1.2.3
Abnormal hip joint biomechanics
There are many different conditions that result from abnormal biomechanics of the hip. Any disorders of the hip can alter the stress distribution through the cartilage and bone. Any damage that occurs in the hip can be further progressed due to the large forces that occur at the joint. Abnormalities in the hip joint often result in OA (Frankel & Pugh 1984; Nordin & Frankel 2001).
Alterations in the femoral neck-to-shaft angle are known as either coxa valga or coxa vara conditions, which alter the lever arm of the abductor muscles resulting in elevated joint reaction forces. An alteration to the acetabular anteversion angle can result in exposure of the femoral head, causing the hip to compensate with either internal or external rotation to avoid dislocation.
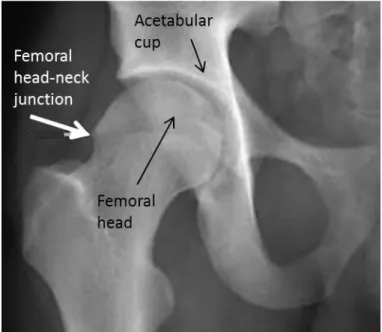
Incongruity of the femoral head and acetabulum leads to an increase in load due to a smaller surface contact area, resulting in abnormal compression or distraction of the articular cartilage (Radin 1980; Nordin & Frankel 2001). If the trabecular bone of the hip undergoes extreme deformation, microfractures result and when combined with prolonged abutment, bone remodelling and stiffening of the underlying network may appear. Bony abnormalities are seen in diseases such as DDH and FAI discussed later in this report (Radin 1980).
1.3
Cartilage
Cartilage is a flexible, connective tissue, defined in three categories; elastic cartilage such as the ear, hyaline cartilage found in synovial joints, and fibrocartilage such as the meniscus in the knee. Differences in cartilage composition and structure are most recognisable by their extracellular matrix (ECM); with hyaline cartilage consisting mainly of cartilage-specific collagen type II, fibrocartilage containing a mixture of collagen type I and II, and elastic cartilage containing elastic fibres. The significant difference between cartilage and any other connective tissue is its lack of blood vessels, resulting in low potential for self-renewal and is dependent on diffusion for nutrients and waste extraction. Cartilage also lacks nerves; hence early diagnosis of damage is often prohibited due to damage being asymptomatic (Yannas 2005; Bucholz 2012; Eroschenko et al. 2012).
Articular cartilage is a form of hyaline cartilage, enveloping the articulating surfaces of synovial joints. It is a highly resilient, complex, composite tissue, which is smooth and stiff in texture and pale whitish-blue in colour. Articular cartilage has a thickness ranging from 1.15mm to 1.78mm across the surface of the femoral head and acetabulum (Mechlenburg et al. 2007). Its function is to “provide a low-friction, wear-resistant surface that can withstand large loads during constant use” by increasing the contact area to disperse the load. During load support and transfer, articular cartilage allows for translation and rotation between bones (Athanasiou, et al. 2009).
Due to articular cartilage’s high metabolic nature it can adapt to a weakened condition, however once its collagen network becomes disorganised the changes that occur are thought to be permanent. Articular cartilage’s function is highly demanding and due to a lower regenerating capacity than degradation rate, articular cartilage frequently fails to cope with the demand placed upon it.
1.3.1
Cartilage macrostructure
Articular cartilage has a specialised composition, with a highly anisotropic, inhomogeneous structure. Its uniquely organised formation enables it to endure high mechanical loads for many years and possibly over the lifespan of an individual. The structure of the tissue varies greatly from the articular surface down to the bone interface, with changes occurring in the collagen fibril network organisation, the concentration of its nutrients, cell morphology, and its mechanical properties.
Articular cartilage can be characterised by four main regions; the superficial zone, the middle (or transitional) zone, the deep zone and the calcified cartilage zone (Figure 1-7). By far, the largest of the four zones is the middle zone, accounting for 40-60% of the total thickness, with the deep zone and superficial zone decreasing in size, accounting for 30% and 10-20%
respectively. The calcified cartilage zone can account for up to 8% of cartilage thickness (Müller-Gerbl et al. 1987; Narayan 2009). The calcified cartilage zone is used to anchor the base of the articular cartilage to the subchondral bone and is separated from the deep zone by the tide mark (Julkunen et al. 2007; Narayan 2009). There is great debate over the function of this zone with Williams et al (2007) stating that it is predominantly thought to prevent nutrients from exiting the underlying bone, making articular cartilage dependent on synovial fluid for its nutrient supply; however Y. Zhang et al. (2012) believes the role of the calcified cartilage zone to be for force transmission and nutrient diffusion. The superficial zone has a significant role in providing the mechanical properties of articular cartilage and it is often this zone where earliest degenerative signs appear.
Figure 1-7 Zones of articular cartilage. Articular cartilage zones showing collagen fibrils and alignment adapted.
1.3.2
Cartilage microstructure
Cartilage has a fibrous structure, composed of collagens, proteoglycans, interstitial water and chondrocytes as well as minor components such as non-collagenous proteins. Collagens, proteoglycans and other proteins contribute to 20-40% of cartilages wet weight with the remainder being taken up by interstitial water (Table 1-3). Collagen fibres are cross-linked with a proteoglycan gel to provide support and structure to the tissue, as well providing a framework for other macromolecules and water to bind to.
Table 1-3 Approximate fractional composition of articular cartilage. Composition of articular cartilage broken down by percentage of total tissue volume, taken from Link (2011).
Content Fraction (%)
Water 80
Collagen Type II 10
Proteoglycans 8
Other Cartilage-specific Collagens (IX, X, XI) <1
Other Proteins <1
Inorganic Salts <1
1.3.2.1
Collagen
Collagen has an axial, periodic structure, constructed of long fibrils. Fibrils are responsible for proving and maintaining the structure of the biomechanical matrix which cells and macromolecules adhere to (Kadler et al. 1996). Within articular cartilage, collagen fibres account for 60% of cartilages dry weight and are the main component of the ECM (Johnson et al. 2007). Their arrangement produces an orientated fibril network, providing the tissue with its elastic properties; such as tensile strength and stiffness. The principle collagen found in articular cartilage is type II collagen, accounting for 90-95% of the total collagen content, however smaller concentrations of other collagens such as collagen VI, IX, X and XI are also present. The core for type II collagen fibrils is produced by the XI collagen, which is thought to be responsible for controlling fibril growth. IX collagen is periodically connected to type II collagen via covalently cross-linked bonds. It is thought to have a significant function in the binding of proteoglycans to the matrix and in the structural integrity of collagen fibril formation, hence disruption to the type IX-type II bond may initiate cartilage degeneration. Type VI collagen is located, in small quantities, in the pericellular region of the chondrocytes. It is thought to function alongside collagen IX as an adhesion molecule for the chondrocytes, enhancing stability of the ECM. Minor collagens such as types X, XII and XIV are thought to assist in the formation and stability of the primarily assembled principle type II collagen. Type X collagen is thought to be specifically related to controlling the mineralisation of the cartilage matrix, whilst types XII and XIV are thought to provide cohesions between the extrafibrillar matrix and collagen fibres (Martin et al. 1998; Seibel 2006).
Throughout the structure of cartilage, collagen fibres vary in formation as well as size, with the smallest fibres located in the superficial zone. Here the collagen fibres are orientated parallel to the cartilage surface, with an unconfined direction within this plane. This in-plane orientation is thought to develop due to the joint movements and principle stress directions, effectively resisting the loads the cartilage is placed under (Mononen et al. 2012). Deeper into the tissue,
around the transitional zone, fibres become more random in orientation, arching from parallel to the surface to radial in orientation as well as becoming larger in diameter compared to those in the superficial and deep zone. In the deep zone, collagen fibres are largest in order to anchor the cartilage to the subchondral bone and are primarily located perpendicular to the surface (Mow & Huiskes 2004; Narayan 2009; Mononen et al. 2012).
1.3.2.2
Proteoglycans
Proteoglycans are dispersed throughout the fibril network of the ECM. They consist of a protein core of hyaluronan, to which multiple highly anionic GAG side chains are covalently bonded (Lohmander 1988; Yanagishita 1993). Proteoglycans account for around 20% of the tissue’s dry weight and have a highly negative fixed charge, allowing them to bind and retain water within the matrix. Proteoglycans negative charge provides an osmotic pressure, allowing the tissue to resist compressive loads, whilst the connection to the water molecules regulates internal fluid transportation, giving the tissue its time-dependent viscous properties (Lohmander 1988; Bader et al. 1992). The highest concentration of proteoglycans is found in the deep zone with concentrations decreasing up to the superficial region.
Cartilage tissue’s major biological function is developed from the physiochemical properties of the GAG, providing hydration and swelling pressure to give the tissue rigidity and structural integrity (Yanagishita 1993). There are different varieties of GAGs, aggrecan is composed of mainly chondroitin sulfate and keratin sulfate, which are two of the most abundant GAGs, found in articular cartilage. They play an important role in the hydration of the tissue and give cartilage its gel-like properties and resistance to deformation (Yanagishita 1993).
1.3.2.3
Interstitial water
Interstitial water is by far the most abundant component of articular cartilage, accounting for around 68-85% of the tissue. It has many significant functions within the tissue, with its primary role to provide lubrication whilst supporting a load. It is also responsible for the swelling of proteoglycans and chondrocytes, as well as providing nutrition and transportation of waste products from the tissue (Lohmander 1988; Narayan 2009; Link 2011). There are two distinct areas in which interstitial water is associated; around 30% of the water is located intrafibrillarly, within the collagenous network whilst the remaining 70% is associated with the proteoglycans, extrafibrillarly, where it can freely exchange during joint loading and unloading (Elices 2000). Interstitial water concentration is most abundant in the superficial surface zone and linearly decreases down to the deep zone. Its volume at any given time is governed by the swelling pressure, produced by the fixed charge density of the surrounding proteoglycans and decreases over time with age. Interstitial water is secured in place due its positive charge, attracting the
highly negatively charged proteoglycans, found within the tissue (Figure 1-8, Elices 2000; Cole & Malek 2004; Mow & Huiskes 2004).
During mechanical loading, fluid flow is restricted through the ECM, due to its small pore sizes and the interaction between the oppositely charged GAGs and water molecules. The intrafibrillar water becomes trapped in the collagenous network, increasing the density of the fixed charges and generating a pressure gradient in the interstitial fluid. This increase in interstitial osmotic pressure or charge-charge repulsion is critical for the tissues ability to support up to 95% of the load applied to it. The further 5% of the load is supported by the stiffness of the ECM (Elices 2000; Mow & Huiskes 2004; Little et al. 2011).
Figure 1-8 Microstructural organisation of articular cartilage. The relationships between interstitial water, collagen fibres and aggrecan, taken from Mow et al. (1998)
When a load is applied to the cartilage, it is immediately supported by the interstitial water throughout the tissue, the cartilage then undergoes slight deformation caused by stress relaxation. If the cartilage remains under load, the interstitial water is forced out of the tissue by creep deformation, further deforming the cartilage. Cartilage deformation reduces contact stresses by increasing the contact area of the tissue. Once the fluid has fully dispersed, the load becomes supported by the collagen fibres in the ECM. When the load is removed, the structure of the matrix returns the cartilage to its original shape and interstitial fluid is restored to its normal level (Mow & Huiskes 2004).
1.3.2.4
Chondrocytes
Chondrocytes are the only cell type found in articular cartilage. They are highly specialised and sparsely distributed throughout the tissue, accounting for around 5% of the tissue weight
(Stockwell 1979; Mirzayan 2006). They are surrounded by the ECM, preventing cell-cell contacts, and receive their nutrients via diffusion from the synovial fluid (Ikada 2006; Nissi 2008). Chondrocytes have a peak metabolic activity rate during growth, in which they undergo replication. Once the cell matures and reaches adolescence, cell division declines and its metabolic activity reduces. Chondrocytes are the only living mediators able to detect and respond to mechanical changes in the tissue. They are able to receive and read a range of environmental signals transmitted from the mechanical loading of the ECM which mediates its function (Stockwell 1979; Nordin & Frankel 2001; Nissi 2008).
Chondrocytes perform both anabolic and catabolic activity in order to maintain the homeostasis of the complex structure of articular cartilage. They are responsible for the synthesis, maintenance and the renewal of all components of the ECM such as collagen, proteoglycans and glycoproteins, as well as being largely responsible for the degradation and turnover of the matrix (Lohmander 1988; Cole & Malek 2004; Mirzayan 2006; Goldring & Marcu 2009; Ottenbrite et al. 2010).
Chondrocytes are distributed throughout the ECM of the tissue and follow the alignment of collagen fibres; with a thin layer of cells parallel to the surface in the superficial zone, randomly orientated cells in the middle zone and vertical columns of cells perpendicular to the subchondral bone in the deep zone (Nissi 2008). Their size, shape and number vary at different cartilage depths, with the cells increasing in size and gaining sphericity from the surface zone down to the subchondral bone. In the upper regions of the tissue, chondrocytes are more elliptical in shape, with their flattest side parallel to the articular surface. Their change in shape and distribution result in metabolic specialisation and create depth-related differences, seen in the various cartilage zones. Chondrocytes can be categorised into four defined groups of spatially organised arrangements, including singles, pairs, strings and clusters. The chondrocyte organisations are orientated parallel to the articular cartilage surface, in the superficial region. Within various joints of the body, the arrangements vary, however within a single joint type; one pattern dominates over the other four in the superficial zone. Studies by Rolauffs et al. (2008 and 2010) have identified the dominant pattern in the knee, ankle, shoulder and elbow, however no studies were identified which determined the spatial pattern in the hip joint.
1.3.3
Cartilage mechanical properties
The mechanical properties of articular cartilage are governed by two main factors; the intrinsic mechanical properties of the constituents, as well as the interaction of these constituents during deformation (Armstrong & Mow 1982). Due to cartilage’s non-uniform zones and anisotropic structure, the tissue’s mechanical properties vary across the different zones. Articular cartilage also demonstrates different mechanical properties under compression, tension and shear, as well as under creep and stress relaxation (Little et al. 2011).
1.3.3.1
Compressive properties
During motion, the articular cartilage in the hip undergoes compression; when under sustained loading its volume decreases as the pressure placed on it increases. In instantaneous compressive loading, the fluid phase is able to support the load applied by the hip, due to small pore sizes within the matrix, hence protecting the underlying bone of the femoral head and acetabular cup. This reduces the porosity and inhibits water from rapidly exiting the tissue, which in turn increases the density of proteoglycans, increasing the negatively charged concentration. The middle zone of articular cartilage provides the highest resistance to compression, due to its high proteoglycan content, hence it plays a crucial role in joint loading (Little et al. 2011).
1.3.3.2
Tensile properties
Articular cartilage can be placed under tension when two cartilage surfaces slide against each other or when the cartilage is compressed pulling on the surrounding tissue (Callaghan 2003, (Athanasiou, et al. 2009). Articular cartilage gains its tensile properties from both flow-dependent and flow-inflow-dependent viscoelastic mechanisms (Mirzayan 2006). Its non-linear properties are greatly governed by the collagen fibres within the tissue. During low tensile forces, collagen fibres become straightened, causing them to realign in the direction of loading, demonstrated by the toe-region in stress-strain curves (Figure 1-9). As the tensile force increases, the cross-linked fibres become stretched, increasing the stiffness of the tissue, which can be seen in the linear region of a stress-strain curve (Figure 1-9, Mirzayan 2006; Athanasiou et al. 2009; Little et al. 2011). The tensile properties of articular cartilage are altered by many factors including; depth and orientation within the tissue, collagen fibre density, fibre diameter, level of cross-linking and the strength of the ionic bonds between the collagen and proteoglycan network. The tensile properties of cartilage also differ depending on loading direction, producing higher tensile strengths when orientated along split-lines (parallel to the predominant collagen fibre direction).
Figure 1-9 Stress-strain curve of articular cartilage. The stress-strain curve of articular cartilage under tensile stress, taken from Mirzayan (2006).
1.3.3.3
Shear properties
Articular cartilage experiences shear stresses throughout its zones. These stresses are generated by typical rotational and translational movement, during everyday activities such as walking and running (Athanasiou, et al. 2009; Little et al. 2011). Shear properties of articular cartilage, at equilibrium, are inhomogeneous and largely governed by the interactions between the solid components, without significant influence from the fluid phase. The tissue becomes physically stretched by pure shear forces, with no compression and is largely unaffected by fluid pressurisation. Proteoglycans within the tissue, expand the collagen matrix producing a tensile pre-stress in the collagen fibres. This interaction allows cartilage to resist shear deformation, hence when proteoglycans are degraded; the shear modulus is greatly reduced (Zhu et al. 1993; Buckley et al. 2008; Little et al. 2011). The static equilibrium shear modulus for human articular cartilage can range from 0.05 to 0.25 MPa, whereas the tissue’s dynamic shear moduli can range from 0.1 to 4MPa (Buckley et al. 2008). During shear, the solid matrix of articular cartilage demonstrates intrinsic, viscoelastic properties, which are dependent on compressive strains (Zhu et al. 1993). Shear forces can affect the viscosity of synovial fluid within the joint, when the shear rate increases the viscosity of the fluid is reduced, affecting the load it can support (Mirzayan 2006).
1.3.3.4
Viscoelasticity
Articular cartilage’s response to a constant (time-independent) load or constant deformation varies over time, giving it its viscoelastic properties. They are the result of the frictional drag, generated from the flow of the interstitial fluid (known as biphasic viscoelasticity) or the macromolecular movement of the ECM (known as flow-independent viscoelasticity) (Nordin & Frankel 2001). The viscoelasticity of articular cartilage is also dependent on the interactions between the collagen matrix and proteoglycans. When the tissues GAG content is reduced, collagen fibres become more aligned, affecting the rate of deformation, or creep, when under tension (Athanasiou, et al. 2009). Due to cartilage’s elastic properties it has the capability to deform, internally storing energy and then returning to its original form. As well as elasticity, the rate at which the tissue reversibly deforms is governed by fluid flow, preventing the tissue from instantaneously returning to its pre-loaded state. There are two central responses of articular cartilage’s viscoelastic nature; known as creep and stress relaxation (Nordin & Frankel 2001).
1.3.3.5
Creep
Creep occurs in articular cartilage when the tissue is placed under a constant compressive stress. Initially the tissue will undergo rapid deformation, followed by a slow (time-dependent) progressive additional deformation, as the fluid is forced out of the tissue. The strain placed on the tissue will continue to increase, until the point where the fluid is fully discharged from the tissue, given a large enough load is placed on the tissue. The creep rate of the tissue is dependent on the time it takes to reach a constant strain, governed by the size of the compressive load placed upon it (Nordin & Frankel 2001; McGinnis 2005; Little et al. 2011).
1.3.3.6
Stress relaxation
When articular cartilage is subjected to a constant deformation, it undergoes a constant strain; however it does not endure a constant stress. In contrast, the application of the strain will create a rapid increase in stress levels (seconds), followed by a slow (hours) decrease in stress, known as relaxation. Stress relaxation, is more simply, the time the tissue takes to react to an applied load or displacement and reach an equilibrium state.
The time taken for the tissue to reach an equilibrium state is dependent on the load or displacement that is applied to it and varies as a result of the ECM deforming, decreasing the average pore size within it. As a result, this increases the diffusional drag between the ECM and the interstitial fluid. Like creep, stress relaxation largely results from fluid discharging from the tissue (Nordin & Frankel 2001; McGinnis 2005; Little et al. 2011).
1.3.4
Cartilage damage
Different components of the ECM are constantly being turned over throughout the lifetime of articular cartilage. Under physiological conditions, a balance is maintained by the chondrocytes, between synthesis and degradation. However, cartilage has a limited capacity for repair and regeneration and while under pathological conditions the balance may incline towards an overall loss of matrix components from the tissue (Lohmander 1988; Nordin & Frankel 2001). Articular cartilage is highly adapted for its function within a synovial joint and can withstand a wide range of static and dynamical loads. It has an optimum range of functional use, if cartilage is under used, in cases such as immobilisation, or overused in cases such as excessive loading; the quality of the tissue is reduced and begins to break down. Although cartilage can adapt to changes in its mechanical environment, due to its avascular and aneural properties, in many instances, the adaptation is degenerative, leading to joint diseases such as OA (Whiting & Zernicke 2008).
1.3.4.1
In vivo cartilage damage
Articular cartilage can degrade by two ways; fatigue wear or interfacial wear. Fatigue wear results from the cyclic stresses and strains generated within the cartilage, caused by the repetitive loading of joint motion. The wear occurs at the surface of the articular cartilage and is not affected by the lubrication in the joint. The large cyclic stresses and strains can result in damage within the bulk material, where microscopic damage accumulates and progresses to the surface. Interfacial wear is caused by the contact of the two articulating surfaces either as a result of the more common adhesive wear or due to abrasion. Adhesion occurs when a junction is created by the articular cartilage of two surfaces coming into contact, causing fragments of the cartilage to be torn off. Abrasive wear occurs when there is a difference in the hardness of two materials which come into contact. This can occur when fragments of loose particles such as bone cut into the softer articular cartilage (Nordin & Frankel 2001; Mow & Huiskes 2004; Katta et al. 2008).
In the majority of circumstances it is difficult to identify the etiology of the degradation process and which of the biological or mechanical degradation processes precedes the other (Katta et al. 2008). There are many factors that can be responsible for the initiation or progression of cartilage wear, including but not limited to, trauma, abnormal biomechanical loading, altered mechano-chemical transduction by chondrocytes, chondrocyte senescence, metabolic disorders, proteolytic enzymes, pathological changes in the collagen-proteoglycan matrix, and loss of lubrication mechanisms or a combination of the above (Katta et al. 2008). When articular cartilage becomes damaged, even by a relatively small amount, it can have a largely detrimental effect on the joint, due to the hydrodynamics of the thin lubricant film (Mow & Huiskes 2004).
As well as mechanical factors, degeneration occurs due to a deterioration of the superficial proteoglycan concentration, increase in water content and separation and disorganisation of the superficial collagen fibrils (Arokoski et al. 2000). Degeneration results from a change in biological factors, such as an elevated expression and activity of proteolytic enzymes. These enzymes, which normally function in the formation, remodelling and repair of the tissue, transform from an anabolic state to a catabolic state as a result of abnormal joint loading. During tissue degeneration, chondrocytes respond to proinflammatory cytokines, by producing more proteinases, which degrade cartilage collagens and proteoglycans (Goldring & Marcu 2009). Loss of proteoglycans decreases the fluid pressurisation, resulting in the inability of the fluid to bear the load. This causes an alteration in the loading pattern, resulting in an intensified load on the collagen fibres in the ECM. Many believe that after the strength of the superficial zone of the cartilage is lost, the remaining cartilage zones have to endure abnormally high strains. Over time, this can lead to cartilage degradation and extensive bone remodelling, and further, the total loss of the tissue due to cartilage’s low rate of renewal (Arokoski et al. 2000; Julkunen et al. 2007; Athanasiou 2009; Narayan 2009). Once the structure of the collagen-proteoglycan network becomes damaged, it is unable to produce normal mechano-electrochemical stimuli, resulting in abnormal ECM remodelling by the chondrocytes and inhibits normal tissue function (Nordin & Frankel 2001).
The rate at which the articular cartilage degenerates is thought to be governed by multiple factors such as; the magnitude of the imposed stresses, the total number of sustained peaks, a change in the intrinsic molecular and microscopic structure of the collagen-proteoglycan matrix, a change in the intrinsic mechanical properties of the tissue, and the type of loading. Failure initiation appears to be highly dependent on the “loosening” of the collagen network, causing the proteoglycans to abnormally expand, resulting in a swelling of the tissue. As the collagen network “loosens”, the tissue becomes more relaxed and permeable, altering the function of the tissue (Nordin & Frankel 2001).
1.3.4.2 In vitro cartilage damage
Although thought to be a crucial factor in hip joint damage, there have been fairly limited studies on the effects of varying contact stresses on the friction and wear of articular cartilage. The in vitro studies available found that the coefficient of friction decreased as the contact stress was increased (Katta et al. 2008). However, a study by Katta et al, (2008) found that this was only valid to a certain stress level, when rehydration of the cartilage was possible. A further study by Katta et al. (2008) found that during biphasic lubrication conditions, when the cartilage could rehydrate, friction levels remained very low. In vitro studies have also found long-term or static loading within the physiological range can cause articular cartilage to compress by
15%-45%, whereas short-duration (high-frequency) loading only results in a minimal cartilage compression (Grodzinsky et al. 2000).
1.4
Acetabular labrum
The human acetabular labrum is a fibrocartilaginous lip, which is attached to the transverse acetabular ligament (TAL), bridging the acetabular notch and forming a complete circle around the acetabulum (Figure 1-10). It increases the size of the acetabulum by 33 %, as well as providing around 22 % of the articulating surface of the hip. Commonly, the human labrum is anteriorly triangular in cross-section with a more bulbous lip posteriorly; however, it has been reported to vary greatly in shape, ranging from triangular to rounded or flat.
Figure 1-10 Regions of the acetabular labrum. The orientation of labrum within the human body taken from Lewis & Sahrmann (2006).
The labrum has an approximate height of 5.5 mm and a width of 4.7 mm, at its base (Figure 1-11). The base of the acetabular labrum is attached to the circumference of the osseous acetabular margin, with its apex forming the free edge, turned against the femoral head. It connects to the articular cartilage through a transition zone, of approximately 1 to 2mm thick, with a well-defined tide-mark. A thin section of bone extends from the hip into the middle of the labrum. On the external side of the labrum, a narrow synovial lined recess separates it from the joint capsule (Konrath et al. 1998; S J Ferguson et al. 2000; Narvani 2003; Petersen et al. 2003; Kelly et al. 2005; Manaster & Zakel 2006; Bowman et al. 2010; Henak et al. 2011).
Figure 1-11 Acetabular labral fixations and dimensions Diagram A shows the attachment sites of the acetabular labrum. Diagram B shows the dimensions of the acetabular labrum.
Diagram adapted from Lewis & Sahrmann (2006)
1.4.1
Labrum macrostructure
The structure of the acetabular labrum varies greatly across the tissue, similar to that of the meniscus in the knee. Collagen fibres are primarily orientated parallel to the acetabular rim, in a circular fashion on both the internal and external circumferences, with a handful of fibres scattered obliquely to the leading fibre orientation (S.J. Ferguson et al. 2000; Petersen et al. 2003). The acetabular labrum is composed of three zones; the superficial zone, formed by a network of delicate fibrils, a deeper middle zone consisting of a layer of lamellar-like collagen fibril bundles, intersecting at various angles and a third, external deep zone, composed of highly orientated, circumferential fibres (Figure 1-12, Ferguson et al. 2000; Petersen et al. 2003). The anterior and posterior sections of the acetabular labrum are continuously connected to the transverse ligament, with the fibrils of the three layers diffusing directly into it (Petersen et al. 2003). It is hydrated with a water content of around 70% (S J Ferguson et al. 2000; Ferguson et al. 2001; Narvani 2003).
Figure 1-12 Labral collagen fibre alignment diagram A – Schematic of the three zones within the acetabular labrum. B – SEM of internal superficial zone (layer 1) with a network of delicate collagen fibrils. C – SEM of middle zone (layer 2) consisting of a layer of lamellar-like collagen fibre bundles, intersecting at various angles. D – SEM of external and deep zone (layer
3) with highly orientated circumferential fibres. Image taken from Petersen et al. (2003)
1.4.2
Labrum microstructure
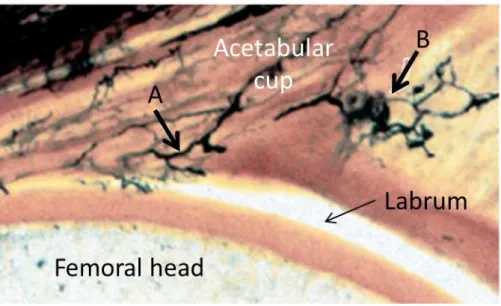
Many studies of the labrum state that it is exclusively composed of fibrocartilage; however a study by Petersen et al (2003) states the labrum consists of fibrocartilage and dense connective tissue. Dense connective tissue composes the external region, directed towards the joint capsule, whereas the inner region, directed towards the femoral head, is composed of a thin layer of fibrocartilage. The fibrocartilaginous layer is approximately 200 to 300 µm thick and contains chondrocytes embedded between the collagen fibrils. There is a continuous transition from the fibrocartilage tissue to the dense connective tissue. Between the joint capsule and the labrum there is a small recess, in this region the labrum is covered by a layer of loose, well vascularised, connective tissue and fat, approximately 200µm thick. The transition between the labrum and the articular cartilage also resembles fibrocartilage with isogenic groups of chondrocytes present (Narvani 2003, Petersen et al. 2003).
1.4.2.1 Co