Background: Low birth weight is a factor associated with perinatal, neonatal and post-neonatal morbidity and
mortality and is associated with development of chronic diseases in adulthood. This study aimed to identify the maternal
and obstetric factors associated with low birth weight in selected hospitals of Nepal.
Methods: Matched case control study was conducted in two tertiary level hospital of Nepal during May 2017 to April
2018. There were 368 mothers with single full term live low birth weight babies (cases) and 736 mothers with single
full term live normal birth weight babies (controls) matched on babies’ gender and place of delivery included in the
study. Multivariable conditional logistic regression analysis was used to eliminate the effects of potential confounders
and to identify the independent effect of various risk factors associated with low birth weight.
Results: A total of 1104 respondents (1 case : 2 controls) were included in the study. Multivariable conditional
logistic regression analysis revealed that maternal height <146 cm [AOR 5.14, (95%CI:2.03-13.01),(p=0.001)],
maternal weight ≤50 kg [AOR 3.75,(95%CI:2.15-6.56), (p<0.001)], primi-parity [AOR 4.58,
(95%CI:1.71-12.25),(p=0.002)], multi-parity [AOR 3.01,(95%CI: 1.11-8.12),(p=0.030)], rest in day time ≤2 hours [AOR 3.68,
(95%CI: 2.01-6.75),(p<0.001)], rest in night time for <8 hours [AOR 5.76, (95%CI: 2.32-14.33), (p<0.001)], Iron
and folic acid consumption for ≤60 days [AOR 5.47, (95%CI: 2.73-10.95),(p<0.001)], Iron and folic acid consumption
for 61-120 days [AOR 3.04, (95%CI: 1.90-4.87),(p<0.001), no calcium consumption [AOR 3.00, (95%CI:
1.78-5.04),(p<0.001)] were the significant risk factors associated with Low birth weight
Conclusions: Height and weight of women, parity, duration of rest in day time and night time, consumption of Iron
and folic acid and calcium were the maternal and obstetric determinants for the occurrence of low birth weight.
Keywords: Birth Weight; case control; low birth weight; maternal and obstetric factors; normal birth weight.
Maternal and Obstetric Factors Associated with Low
Birth Weight
Dilip Kumar Yadav,1 Girija Shankar Shukla,1,2 Neena Gupta,1 Naveen Shrestha,3 Akanksha Singh,1 Hari Prasad Kaphle1
1Shalom Institute of Health and Allied Sciences, Sam Higginbottom University of Agriculture, Technology and Sciences, Prayagraj-211007, India, 2School of Health Science, Uttar Pradesh Rajarshi Tandon Open University, Prayagraj, India, 3CIST College, Kathmandu, Nepal.
Correspondence:
Mr Dilip Kumar Yadav, Shalom Institute of Health and Allied Sciences,Sam Higginbottom University of Agriculture, Technology and Sciences, Prayagraj-211007, India. Email: [email protected], Phone: +917236891498, +9779844099370.
ABSTRACT
INTRODUCTION
Low birth weight (LBW) is one of the major public health problems worldwide; in developed countries, about one half of all LBW infants are preterm while in developing countries, most of LBW infants are born at term and are affected by intrauterine growth restriction that may begin early in pregnancy.1,2
Globally about 20.5 million newborn babies born with LBW and global prevalence of LBW for 2015 is 14.6% (UR 12.4-17.1).3 According to Unicef, prevalence of LBW in Nepal is 18% consistently in 2006 and 2011 which indicates that it is a public health problem in Nepal since it is above the cutoff level of 15%.4 Gender of the baby,
age, weight and height of mother, BMI at conception, gravid, parity, life style and physically demanding work during pregnancy contribute to poor foetal growth.5,6 The objective of the study was to find out the maternal and obstetric factors associated with LBW.
METHODS
This was a hospital based case control study conducted in two tertiary level hospital of Nepal (Koshi Zonal Hospital, Biratnagar from Province 1 and Narayani Regional Hospital, Birgunj from Province 2) during 1st April 2017 to 31st March 2018. Mothers with term single live low birth weight babies were considered as case and mothers with term single live normal birth weight babies
J Nepal Health Res Counc 2019 Oct-Dec;17(45): 443-50
were considered as control for the study.
The weight of all live births delivered in the two hospitals during the study period was measured. Based on the case definition those mothers who gave single live births weighed less than 2500g included in the study as cases. Cases were selected sequentially till the required number of cases completed. Mothers not willing to participate in the study, having preterm birth and having multiple births were excluded from the study. For each case, two consecutive controls were included during same research period. While selecting control, sex of the babies and place of delivery were matched.
We collected data on each case and control following the same process. Data on a case and its corresponding control was collected using a similar schedule. We used a pretested schedule to collect data. This schedule was validated by public health experts of Sam Higginbottom University of Agriculture, Technology and Sciences (SHUATS) university of India, Pokhara University, Janaki Medical College and CIST college of Nepal. The data were collected by researcher himself and health workers who were previously trained on interviewing. The information was collected by face-to-face interviews and additional information was extracted from the ante natal care records of mothers, as well as birth registers of the hospitals.
The sample size was determined using the proportion difference approach with the assumption of 95 % confidence level (Zα/2 = 1.96), 80 % power (Zβ = 0.84), control to case ratio 1:2 (r = 2), the odds ratio to be detected 0.18 and the 25 % control group will be exposed. The final sample size was 1104 (368 cases and 736 controls).
The weight of the newborn babies was measured within 30 min after birth using a baby weighing machine (pan type scale of Crown Company) after correcting the zero error. Maternal height was measured against a wall height scale to the nearest centimeter. Maternal weight was measured by bathroom weighing scale of Crown Company to the nearest kilogram.
Data was cross checked daily at the end of the day to find out the errors and inconsistency of data and necessary editing, cleaning, coding and tabulation was done manually.
After checking data for completeness and inconsistencies, data was entered in Epidata version 3.1 and exported to IBM statistical package for social science (SPSS) version 16 for analysis. Bivariate analysis was done between
the dependent and independent variables to determine the associations using the Pearson’s chi-square test and Fisher Exact Test where expected cell was less than 5. Statistical significance was assumed at a P value of <0.05. To find out the strength of association, odds ratios was calculated using conditional logistic regression with confidence intervals at 95% level of significance since the case and control were matched with 1:2 ratio. All variables in the bivariate analysis with a p-value of less than 0.05 (95% level of significance) were considered for multivariable conditional logistic regression analysis. FORWARD WALD conditional logistic regression model was used to eliminate the effects of potential confounders and to identify the independent effect of various risk factors associated with LBW. The level of significance for regression analysis was set at 95%.
Ethical approval was obtained from Institutional Ethical Committee (SHUATS), Allahabad, India (Reg. No.: IEC/ SHUATS/2017/B/53) and Nepal Health Research Council (Ref. No.: 1306, Reg. No.: 541/2017).Written Permission was taken from concerned authority of the Hospitals. Written consent was taken from the mothers of babies after giving information about the nature and objective of the study before taking interview.
RESULTS
Majority of women in both case (57.9%) and control (48.8%) groups got married before 20 years, majority of women in case group became pregnant first time before 20 years of age and in control group in between 20-24 years of age, majority of women in both case (48.9%) and control (49.3%) groups were of 20-24 years at the time of current delivery, height of majority of women in both case (85.6%) and control (98.9%) groups was ≥146 cm, majority of women in both case (69.6%) and control (91.4%) groups had >50 kg weight after delivery, higher proportion of mothers in case group (47.8%) had normal BMI and control (53.4%) group had over weight after delivery (Table 1).
More than two third women in case (66.6%) and more than half women in control group (54.6%) were primi-gravida, more than two third women in case (68.2%) and more than half women in control (55.4%) were primi-parity, more than 4/5th of women in both case (93.2%) and control (96.1%) groups had no history of poor pregnancy outcome, more than half of women in case (55.6%) and more than two third of women in control (61.9%) group had more than two years of inter pregnancy interval (Table 2).
(81%) groups expressed recent pregnancy as planned, about two third of women in both case (74.5%) and control (80.3%) groups were working for less than six hours in a day during pregnancy, most of the women in both case (82.3%) and control (92.5%) groups were taking rest for 2 hours or above in a day time during pregnancy, most of women in both the case (94%) and control (97.7%) group were taking rest for more than 8 hours in night time during pregnancy, most of women in both the case (96.7%) and control (98.6%) group were not using any substance (Alcohol, Cigarette or Tobacco) during pregnancy, more than half of women in both the case (54.6%) and control (59.7%) group were not exposed to passive smoking during pregnancy (Table 2).
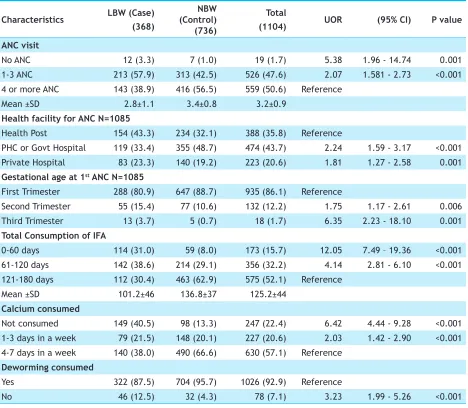
Higher proportion of women in case (57.9%) group had visited for ante natal care (ANC) 1-3 times during pregnancy while higher proportion of women in control (56.5%) group had visited for ANC four times or more
during pregnancy, larger percentage of women in case group had visited health post (43.3%) for ANC while larger percentage of women in control group had visited PHC or government hospital (48.7%) for ANC, higher percentage of women in case (38.6%) group had consumed iron and folic acid (IFA) for 61-120 days while more than three fifth of women in control (62.9%) group had consumed IFA for 121-180 days, higher percentage of women in case (40.5%) group had not consumed calcium during pregnancy compared to only 13.3% in control group whereas only more than 1/3rd of women in case (38%) had consumed calcium 4-7 days in a week compared to 2/3rd of women in control group (66.6%), majority of women in both the case (69.3%) and control (63%) group had not consumed multivitamin during pregnancy, majority of women in both the case (74.5%) and control (75.3%) group had not suffered from any health problems during pregnancy like fever, diarrhoea, pneumonia, or common cold (Table 3).
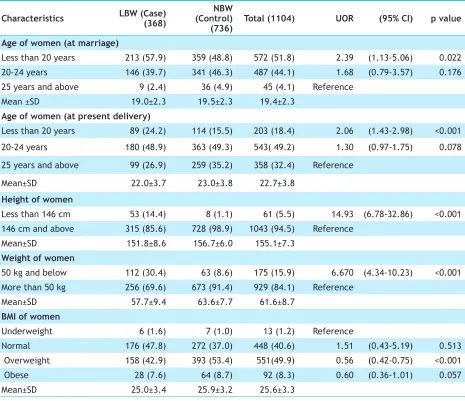
Table 1. Association between ‘birth weight’ and ‘maternal and obstetric’ factors of mothers in relation to age, height, weight and BMI of women, (n=1104).
Characteristics LBW (Case) (368) (Control) NBW
(736) Total (1104) UOR (95% CI) p value
Age of women (at marriage)
Less than 20 years 213 (57.9) 359 (48.8) 572 (51.8) 2.39 (1.13-5.06) 0.022
20-24 years 146 (39.7) 341 (46.3) 487 (44.1) 1.68 (0.79-3.57) 0.176
25 years and above 9 (2.4) 36 (4.9) 45 (4.1) Reference
Mean ±SD 19.0±2.3 19.5±2.3 19.4±2.3
Age of women (at present delivery)
Less than 20 years 89 (24.2) 114 (15.5) 203 (18.4) 2.06 (1.43-2.98) <0.001
20-24 years 180 (48.9) 363 (49.3) 543( 49.2) 1.30 (0.97-1.75) 0.078
25 years and above 99 (26.9) 259 (35.2) 358 (32.4) Reference
Mean±SD 22.0±3.7 23.0±3.8 22.7±3.8
Height of women
Less than 146 cm 53 (14.4) 8 (1.1) 61 (5.5) 14.93 (6.78-32.86) <0.001
146 cm and above 315 (85.6) 728 (98.9) 1043 (94.5) Reference
Mean±SD 151.8±8.6 156.7±6.0 155.1±7.3
Weight of women
50 kg and below 112 (30.4) 63 (8.6) 175 (15.9) 6.670 (4.34-10.23) <0.001
More than 50 kg 256 (69.6) 673 (91.4) 929 (84.1) Reference
Mean±SD 57.7±9.4 63.6±7.7 61.6±8.7
BMI of women
Underweight 6 (1.6) 7 (1.0) 13 (1.2) Reference
Normal 176 (47.8) 272 (37.0) 448 (40.6) 1.51 (0.43-5.19) 0.513
Overweight 158 (42.9) 393 (53.4) 551(49.9) 0.56 (0.42-0.75) <0.001
Obese 28 (7.6) 64 (8.7) 92 (8.3) 0.60 (0.36-1.01) 0.057
The difference in distribution in relation to age of women(at the time of marriage and at the time of delivery), height, weight, and BMI of women, gravid, parity, history of poor pregnancy outcome, duration of work, duration of rest in day time and night time, substance used during pregnancy, ANC visit, health facility visited for ANC, gestational age at 1st ANC, total consumption of IFA, consumption of calcium, deworming
during pregnancy among maternal and obstetric factors was found to be statistically significant (p<0.05) whereas age of women (at 1st pregnancy), birth interval (last 2 child), planning of pregnancy, exposure to passive smoking during pregnancy, multivitamin consumed, health problems during pregnancy like fever, diarrhoea, pneumonia, or common cold did not show statistically significant association (Table 1, 2 and 3).
Table 2. Association between ‘birth weight’ and ‘maternal and obstetric’ factors of mothers in relation to gravid, parity, and history of poor pregnancy outcome, duration of work, duration of rest in day and night time, and substance used during pregnancy (n=1104).
Characteristics LBW (Case) (368) (Control) NBW
(736) Total (1104) UOR (95% CI) P value
Gravida
Primi Gravida 245 (66.6) 402 (54.6) 647 (58.6) 1.79 (0.92-3.46) 0.083
Multi Gravida (2-3) 110 (29.9) 296 (40.2) 406 (36.8) 1.11 (0.56-2.18) 0.761
Grand Multi Gravida(≥4) 13 (3.5) 38 (5.2) 51 (4.6) Reference
Mean ±SD 1.5±0.8 1.6±0.9 1.6±0.8
Parity
Primi Parity 251 (68.2) 408 (55.4) 659 (59.7) 2.54 1.13 - 5.72 0.024
Multi Parity (2-3) 109 (29.6) 296 (40.2) 405 (36.7) 1.55 0.68 - 3.54 0.296
Grand Multi Parity (≥4) 8 (2.2) 32 (4.3) 40 (3.6) Reference
Mean ±SD 1.5±0.7 1.6±0.8 1.5±0.8
History of poor pregnancy outcome
Yes 25 (6.8) 29 (3.9) 54 (4.9) 1.81 1.03 - 3.17 0.038
No 343 (93.2) 707 (96.1) 1050 (95.1) Reference
Duration of total works (hrs)
Less than 6 hrs 274 (74.5) 591 (80.3) 865 (78.4) Reference
6 hrs and above 94 (25.5) 145 (19.7) 239 (21.6) 1.43 1.05 - 1.94 0.022
Mean ±SD 4.6±1.6 4.4±1.3 4.5±1.4
Duration of rest (day time)
Equal or less than 2 hrs 65 (17.7) 55 (7.5) 120 (10.9) 3.22 2.07 - 5.01 <0.001
More than 2 hrs 303 (82.3) 681 (92.5) 984 (89.1) Reference
Mean ±SD 4.7±2.1 4.9±1.9 4.8±2.0
Duration of rest (night time) 2.98 1.49 - 5.99 0.002
Less than 8 hrs 22 (6) 17 (2.3) 39 (3.5) Reference
8 hrs and above 346 (94.0) 719 (97.7) 1065 (96.5)
Mean ±SD 8.2±0.6 8.4±0.7 8.3±0.7
Substance used during pregnancy
Yes 12 (3.3) 10 (1.4) 22 (2.0) 2.88 1.11 - 7.45 0.029
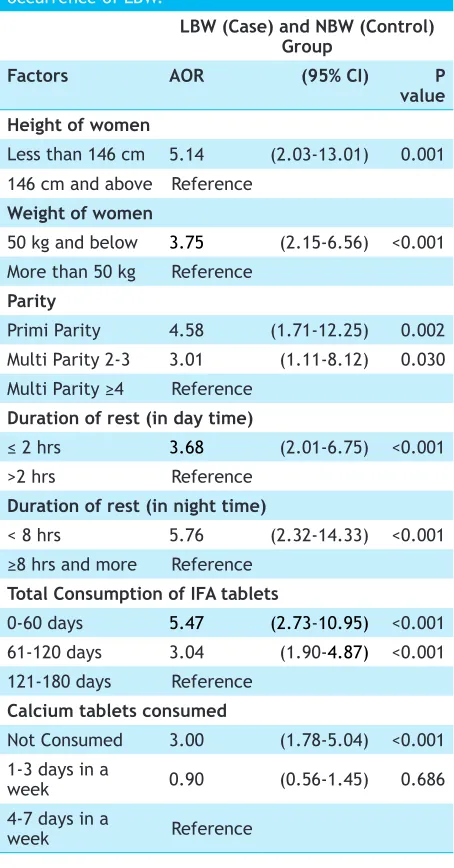
On multivariable conditional logistic regression analysis, it was found that height of mother, weight of mother, parity, duration of rest in day time, duration of rest in night time, total consumption of IFA, calcium consumed were the maternal and obstetric determinants for the occurrence of LBW.
Adjusted odds of having LBW babies was 5.14 times higher among women whose height was <146 cm (95% CI: 2.03-13.01) compared to women whose height was >145 cm and were significantly associated with LBW (P=0.001). Women with weight ≤50 kg were 3.75 times more (95% CI: 2.15-6.56) at risk of having LBW babies compared to women with weight >50 kg (P<0.001). Primi-parity women were 4.58 times more (95% CI: 1.71-12.25) prone to deliver LBW babies (P=0.002), multi-parity women were 3.01 times more (95% CI: 1.11-8.12) prone to deliver LBW babies (P=0.030) compared to
grand multi-parity women. Adjusted odds of having LBW was 3.68 times higher (95% CI: 2.01-6.75) among women who were taking rest for ≤2 hours per day in day time compared to women who were taking rest for >2 hours per day in day time and were significantly associated (P<0.001) with LBW. Adjusted odds of having LBW was 5.76 times higher (95% CI: 2.32-14.33) among women who were taking rest for <8 hours per day in night time compared to women who were taking rest for ≥8 hours per day in night time and were significantly associated (P<0.001) with LBW. Adjusted odds of having LBW baby was 5.47 times higher (95% CI: 2.73-10.95) among women who had consumed IFA for ≤60 days (P<0.001), 3.04 times higher (95% CI: 1.90-4.87) among women who had consumed IFA for 61-120 days (P<0.001), compared to women who had consumed IFA for 121-180 days. Odds of having LBW was 3.00 times higher (95% CI: 1.78-5.04) among women who had not consumed calcium (P<0.001) Table 3. Association between ‘birth weight’ and ‘maternal and obstetric’ factors of mothers in relation to ANC, health facility visited for ANC,Gestational age at 1st ANC, Consumption of IFA,calcium and deworming (n=1104).
Characteristics LBW (Case)
(368)
NBW (Control) (736)
Total
(1104) UOR (95% CI) P value
ANC visit
No ANC 12 (3.3) 7 (1.0) 19 (1.7) 5.38 1.96 - 14.74 0.001
1-3 ANC 213 (57.9) 313 (42.5) 526 (47.6) 2.07 1.581 - 2.73 <0.001
4 or more ANC 143 (38.9) 416 (56.5) 559 (50.6) Reference
Mean ±SD 2.8±1.1 3.4±0.8 3.2±0.9
Health facility for ANC N=1085
Health Post 154 (43.3) 234 (32.1) 388 (35.8) Reference
PHC or Govt Hospital 119 (33.4) 355 (48.7) 474 (43.7) 2.24 1.59 - 3.17 <0.001
Private Hospital 83 (23.3) 140 (19.2) 223 (20.6) 1.81 1.27 - 2.58 0.001
Gestational age at 1st ANC N=1085
First Trimester 288 (80.9) 647 (88.7) 935 (86.1) Reference
Second Trimester 55 (15.4) 77 (10.6) 132 (12.2) 1.75 1.17 - 2.61 0.006
Third Trimester 13 (3.7) 5 (0.7) 18 (1.7) 6.35 2.23 - 18.10 0.001
Total Consumption of IFA
0-60 days 114 (31.0) 59 (8.0) 173 (15.7) 12.05 7.49 – 19.36 <0.001
61-120 days 142 (38.6) 214 (29.1) 356 (32.2) 4.14 2.81 - 6.10 <0.001
121-180 days 112 (30.4) 463 (62.9) 575 (52.1) Reference
Mean ±SD 101.2±46 136.8±37 125.2±44
Calcium consumed
Not consumed 149 (40.5) 98 (13.3) 247 (22.4) 6.42 4.44 - 9.28 <0.001
1-3 days in a week 79 (21.5) 148 (20.1) 227 (20.6) 2.03 1.42 - 2.90 <0.001
4-7 days in a week 140 (38.0) 490 (66.6) 630 (57.1) Reference
Deworming consumed
Yes 322 (87.5) 704 (95.7) 1026 (92.9) Reference
compared to women who had consumed calcium for 4-7 days in a week, but women who had consumed calcium for 1-3 days in a week showed statistically insignificant association (P=0.686) with LBW [AOR=0.90, 95% CI: (0.56-1.45)] (Table 4).
Table 4. Maternal and obstetric determinants for the occurrence of LBW.
LBW (Case) and NBW (Control) Group
Factors AOR (95% CI) P
value Height of women
Less than 146 cm 5.14 (2.03-13.01) 0.001 146 cm and above Reference
Weight of women
50 kg and below 3.75 (2.15-6.56) <0.001 More than 50 kg Reference
Parity
Primi Parity 4.58 (1.71-12.25) 0.002
Multi Parity 2-3 3.01 (1.11-8.12) 0.030 Multi Parity ≥4 Reference
Duration of rest (in day time)
≤ 2 hrs 3.68 (2.01-6.75) <0.001
>2 hrs Reference
Duration of rest (in night time)
< 8 hrs 5.76 (2.32-14.33) <0.001 ≥8 hrs and more Reference
Total Consumption of IFA tablets
0-60 days 5.47 (2.73-10.95) <0.001 61-120 days 3.04 (1.90-4.87) <0.001 121-180 days Reference
Calcium tablets consumed
Not Consumed 3.00 (1.78-5.04) <0.001 1-3 days in a
week 0.90 (0.56-1.45) 0.686
4-7 days in a
week Reference
DISCUSSION
This study was conducted to find out the maternal and obstetric factors associated with LBW. Based on the finding of the present study maternal height, maternal weight, parity, duration of rest in day time and night time, consumption of IFA and calcium were the independent risk factors for the birth of low birth weight babies in selected hospital of Nepal.
Present study revealed that the odds of having LBW is
five-fold higher among women who had height less than 145 cm. This finding of the study is consistent with a matched-pair case control study performed in India found that height ≤145 cm was 4.13 times more at risk for delivering LBW babies.7 Other studies were also reporting the similar finding in their population.8,9 On the contrary, case control study carried out in India revealed that maternal height did not show any significant association with LBW.10 Height of women indicates her long term nutritional status and shorter height implies negative impact on her birth outcome.
Finding in the present study implies that women with weight ≤50 kg were 3.75 times more at risk of having LBW babies compared to women with weight >50 kg. This explanation is supported by a prospective cohort study conducted in Nepal found that mothers with weight <45kg had 11 times higher risk of giving of LBW babies.11 Likewise, case control study conducted in Nepal found that mothers having ≤45 kilograms weight were nearly 5 times more at risk to deliver LBW baby.12 Other studies were also reporting the similar finding in their population.13,14 Post partum weight indicates the nutritional growth during pregnancy and lower weight implies negative impact on her birth outcome.
Present study revealed parity as an important determinant for LBW. Primi-parity women were 4.58 times more prone to deliver LBW babies, multi-parity women were 3.01 times more prone to deliver LBW babies compared to grand multi-parity women. This explanation is supported by a community based study conducted in India found that grand multi-para women were 3.6 times more at risk of delivering LBW baby.8 Other studies were also reporting the similar findings in their populations.11,15-19 On the contrary, case control studies performed in India revealed that association between LBW and parity was statistically insignificant.7,20 This finding of the present study could be because of early age pregnancy, increased vomiting as well as decreased appetite due to physiological changes during pregnancy.
The finding of significant association of ‘taking rest for ≤2 hours per day in day time and rest for ≥8 hours per day in night time during pregnancy’ and ‘LBW babies’ shown by this study is consistent with previous studies carried out in Nepal and in India.21,22 The finding of different studies indicates that duration of rest play significant role in determining birth weight.
women who had consumed IFA for 61-120 days were 3.04 times more prone to deliver LBW babies, compared to women who had consumed IFA for 121-180 days. This finding of present study is consistent with a case control study conducted in Nepal found that mothers who were supplemented with iron for ≤90 days were nearly threefold more prone to have LBW babies than the mothers having iron supplementation for >90 days.12 Other studies were also reporting the similar findings in their populations.8,18,22,23 On the contrary, prospective cohort study conducted in Nepal found that iron supplementation <180 tabs did not show any association to LBW.11 The findings of different studies have indicated that iron and folic acid is essential for the normal growth and development of foetus.
This study revealed that women who did not consume calcium were three times more prone to deliver LBW babies compared to women who consumed calcium 4-7 days in a week but women who consumed calcium 1-3 days in a week did not show significant association. This finding is consistent with the previous study conducted in Nepal.12
The study was hospital based, conducted in only two hospitals and excluded ‘preterm and twin birth’. Therefore, it may not be possible to generalize the results to a particular population as compared to population based studies. There might be chance of recall bias as some data was based on respondents past history.
CONCLUSIONS
Maternal height <146 cm, maternal weight ≤50 kg, primi-parity, multi-primi-parity, rest in day time ≤2 hours, rest in night time for <8 hours, IFA consumption for ≤60 days, IFA consumption for 61-120 days, no calcium consumption were the maternal and obstetric determinants for the occurrence of low birth weight.
ACKNOWLEDGEMENTS
The authors would like to acknowledge SHUATS University for giving an opportunity to work on identified thematic areas. They would like to thank the medical superintendents and respective supervisors of the hospitals, the study participants and research assistants for their great contribution for the data collection and completion of this study.
REFERENCES