RESPONSE TO POPULATION IN CORN HYBRIDS WITH SPECIFIC
CHARACTERISTICS by
NATHAN SCHROEDER
BS, Northwest Missouri State University, 2003
A THESIS
Submitted in partial fulfillment of the requirements for the degree
MASTER OF AGRIBUSINESS Department of Agricultural Economics
College of Agriculture KANSAS STATE UNIVERSITY
Manhattan, Kansas 2013
Approved by:
Major Professor Dr. Allen M. Featherstone
ABSTRACT
Examining the interaction between population and corn yield is important because the challenge of feeding the world is real. Projections show the world population is increasing and expected to reach over 9 billion people by around 2050. Expanding global urbanization drives the need to increase corn yield on current land and needs to occur to meet global population growth.
Previous studies on corn yield increases conclude that ear size is limited and increasing corn plants per acre is important to increasing yield potential. This study used Answerplot data to analyze the effect of increasing plant population on corn yield in 2009. There are over 150 Answerplots across the cornbelt. The weather of 2009 proved to be a challenging year in certain regions of the cornbelt. Record rainfall, and below normal temperature had an influence on corn yield. A total of 4,180 observations from Answerplot were used from across the nation to analyze the relationship between corn yield and plant population. Multiple regression models were estimated and found that in 2009, an increase in plant population from 30,000 to 40,000 plants per acre resulted in an 8.5 bushel per acre increase. This result was robust for various econometric models. Economically, the cost per acre for current seed for this increase in population is about $38.87 per acre. At a corn price greater than $4.58 per bushel, increasing plant population would have made economic sense for 2009.
iii
TABLE OF CONTENTS
List of Figures ... iv
List of Tables ... v
Acknowledgments ... vi
Chapter I: Introduction ... 1
Chapter II: Literature Review ... 6
Chapter III: Seed Corn Technology ... 10
3.1 Northerns ... 14
3.2 Easterns ... 14
3.3 Westerns ... 14
3.4 Southerns ... 15
3.5 Summary ... 15
Chapter IV: Methods ... 21
Chapter V: Results ... 29
5.1 Economics of Population ... 29
5.2 Summary ... 38
iv
LIST OF FIGURES
Figure 1.1: World Population Growth, Actual and Projected, 1950-2050 ... 2
Figure 1.2: Seven Wonders of the Corn Yield ... 4
Figure 3.1: Eras of Introduction ... 10
Figure 3.2: Correct Positioning to Manage Risk ... 13
Figure 3.3: Response to Heat ... 16
Figure 3.4: 6831 Hybrid Response to Dryland Stress. ... 17
Figure 3.5: 24K versus 42K Population Response to Dryland Stress ... 17
Figure 3.6: Small rooted fibrous Southern and penetrating rooted Eastern ... 18
Figure 3.7: Northern Genetic Family Root System ... 19
Figure 3.8: Southern Genetic Family Root System ... 19
Figure 3.9: 6831 Hybrid on Dryland Stress vs. Productive Irrigation ... 20
Figure 3.10: 6818 VT3 on Dryland Stress vs. Productive Irrigation ... 20
Figure 4.1: Answer Plot Locations ... 22
Figure 4.2: Performance in varying climates ... 23
Figure 4.3: January to November 2009 Statewide Precipitation Ranks ... 24
Figure 4.4: January-November 2009 Statewide Temperature Ranks ... 25
Figure 5.1: 2009 Corn Prices ... 29
Figure 5.2: 2009 Chicago Board of Trade Corn Prices ... 30
Figure 5.3: 2008 Chicago Board of Trade Corn Prices ... 30
v
LIST OF TABLES
Table 4.1: Summary Statistics for Characteristics for Answer Plot Corn Trials for
2009 ... 26
Table 5.1: Yield with Brand Interaction 0-1 Population Variable ... 31
Table 5.2: Yield with BT Trait Interaction and a 0-1 Population Variable ... 33
Table 5.3 Genetic Family with a 0-1 Population Variable ... 34
Table 5.4: Moisture with Brand Interaction and a 0-1 Population Variable ... 36
vi
ACKNOWLEDGMENTS
The author wishes to thank Kansas State University, the MAB program and Staff. Without the help of Dr. Allen Featherstone, Mary Bowen, and Deborah Kohl, this project wouldn’t of been completed. Thank you to WinField Solutions specifically Shawn Barnett, Randy Brown, Phil Ramsel, and Carl Scholting. The insight they provided was well
received and appreciated. Lastly, thank you to my wife Crystal and Mom. Their unwavering support throughout the entire process of the program was of incredible motivation.
1
CHAPTER I: INTRODUCTION
Modern agriculture produces enough food each year to feed the entire world. One United States farmer produces enough food to feed 155 people and is the leading producer of an abundance of foods that are important in diets around the world (Center for Food Integrity 2009). The American farmer is the most productive in the world. The abundance of natural resources, investments in private and public agricultural research, and the most advanced technology in the world puts the US in the position to drive total global food supply.
The demand on farmers to feed the world will continue to grow in years to come as populations across the globe continue to rise. Farmers will need to produce more food on the same number or fewer acres and with fewer inputs. It is projected that agricultural operations around the world will be looked at to produce 70 percent more food over the next 40 years (Food and Agricultural Organization of the United Nations 2009). Today’s farmer has no choice but to meet those demands. The average farmer is 47 years of age, owns approximately 418 acres of ground, and sells roughly $135,000 in products per year (USDA National Agriculture Statistical Service 2007). Farmers now view themselves as businessmen running high dollar businesses. The possibility of meeting global food demand will also depend on basic agriculture development in developing countries, but only 10 percent of production gains are expected to result from new acres entering into production (Farm Journal Foundation 2012). New farm acres in developing countries are important, but the responsibility will fall largely on the acres already in production.
Global hunger is an issue that exists despite the fact that enough food is produced today to feed the entire world population of more than 7 billion. Nearly 2 billion people
2
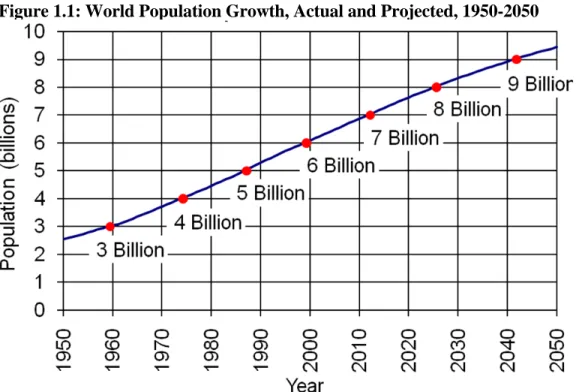
suffer from chronic hunger or are undernourished. Living in the United States, it is difficult to understand that so many people are hungry. It is a fact that more people die from hunger every year than from AIDS, malaria, and tuberculosis. Those lives lost to hunger can easily be saved. According to figure 1.1, the problem is only expected to increase in the future.
Figure 1.1: World Population Growth, Actual and Projected, 1950-2050
By the year 2050 the world population will reach more than 9 billion (figure 1.1). It is in this year that for the first time the world may not be able to produce enough food to feed the world using today’s technologies. This will only make getting food from where it is produced to where it is needed a continuing challenge. As we face this harsh reality, what can be done to allow more food to be produced off the same land we farm today?
3
As Andy Weber said, “there is a day coming that those who choose to feed the world will have the world’s most important job” (Weber 2012). The important job is feeding a growing population and with that comes many challenges for the new agricultural economy. These challenges include: a growing world population, growing wealth, the need for alternative energy feedstocks, and climate change. The growing world population will increase the demand for food and energy while farmland per capita decreases. The wealth growth will result in increased meat consumption and a need for livestock feed. The demand for renewable energy and biofuels will result in a need for alternative energy feedstocks. Climate change may be a challenge through yield losses due to adverse weather conditions and the need to reduce greenhouse gas emissions.
There is no question that increased food production will need to be driven by increased productivity and efficiency. That’s where food demand meets yield. Corn is a staple nutrient source. For American farmers to produce more food, they need to do it on the same acres, and that means increasing yield. There are many components that make up yield. According to Below and Gentry, there are seven components in the “quest of 300 bushel corn” (figure 1.2).
4 Figure 1.2: Seven Wonders of the Corn Yield
Source: Below and Gentry
The components producers have control over are on the input side of the equation. This would include 6 of the 7 items listed in figure 1.2, Nitrogen, Hybrid, Previous Crop, Plant Population, Tillage, and Growth regulators. Number 5 is plant population at roughly 20 bushels per acre. The objective of this project is to analyze the effect of plant
population on corn yield using hybrid data such as brand, genetic type, region, and traits. The effect population has on moisture and test weight were also examined.
Response to population data come out of the Answerplot system (WinField Solutions 2009). These trials are set up as 30 foot by 4 row sets. In the past, there were 4 different populations with 6,000 plant per acre increases. For example, 24,000; 30,000; 36,000; and 42,000; this has changed to high population of 40,000 plants per acre and low population of 30,000 plants per acre trials. All corn hybrids are tested throughout 3 separate companies and then grouped by scores. These scores reflect the hybrid response. If a hybrid has a high Response to Population score, it shows a significant response and would be a value to the grower to plant this particular hybrid at higher populations. If the
5
hybrid has a low response to population score, the additional cost of seed would make it difficult to recoup a significant increase in seed use unless there was a more significant yield increase.
6
CHAPTER II: LITERATURE REVIEW
Grain yield per unit area is the product of grain yield per plant and number of plants per unit area (Hashemi, Herbert and Putnam 2005). The response is usually parabolic with increased density. At low densities, grain yield is limited by an inadequate number of plants whereas at higher densities, it declines due to an increase in the number of aborted kernels and/or barren stalks. Finding the optimum population density that produces the maximum yield per unit area under different environmental conditions and/or genotypes has been the major concern in many investigations. Multiple studies in the Agronomy Journal look at hybrids, and note the kernel yield per plant decreases linearly in response to intensifying crowding stress (Hinze, Kresovich, Nason, Lamkey; Arjal, Prato, Peterson; Nafziger; Kashiani, Saleh, Abdullah; Gonzalo, Vyn, Holland, McIntyre). The use of isolated plants to index the yield relationship with increasing crowding indicates that components of kernel yield in single-ear hybrids had a linear response over the density range and that the reduction in total kernel yield per plant was primarily due to the reduction of kernel number per row followed by either the number of productive ears per plant or kernel weight. Results showed that optimum density for grain yield per unit area was lower than that for total biomass and increasing plant density above densities
commonly used by farmers would likely improve corn yields.
Lauer analyzed that from 1866-1930 there was no overall advancement in yield per plant (2007). In the years 1931-1995, there was a 1.4 bushels/acre/year, and from 1996 to 2006, a 1.9 bushel/acre/year. When compared with University of Wisconsin Hybrid trials, Lauer experienced a 2.6 to 2.7 bushel/acre/year increase. From 1985, when looking at the past high yield producers in the United States, they were all aggressively increasing
7
populations above the current norm. The 1985 winner, Herman Warsaw of Illinois was 370 bushel/acre at 36,000 plants per acre. Ken Beaver of Nebraska in 2001 had 319 bushel/acre with 39,000 plants per acre. World record holder Francis Childs produced on land with over 30 years continuous corn, 442 bushels per acre and 45,000 plants per acre. Lauer concluded that with the genetic advancement made in current corn hybrids, to reach optimum yield, increased populations would need to be used. Population was just one of the factors and he also concluded in his research that 46% of environments did not have a yield response to population. He also pointed out some risk potential by increasing
management overall. This increase of risk included incurred additional cost, and late season hazards due to crowding stress, and poor harvest ability.
Corn yields have dramatically increased over time, as well as plant population densities. The question was the genetic basis for plant response to density is unknown as is its stability over environments (Gonzola, et al. 2006). To examine the genetic basis of plant response to density in maize, QTL was mapped for plant density-related traits in a population of 186 recombinant inbred lines (RILs) derived from the cross of inbred lines B73 and Mo17. Evaluations of the growth development, and yield traits at moderate and high plant densities were taken. It was found that genetic control of the traits evaluated is multigenic in their response to density. Other effects looked at were days to anthesis, anthesis-to-silking interval, barrenness, ears per plant, and yield per plant. All showed statistical evidence for an epistatic interaction. Locus by density interactions are of critical importance for anthesis-to-silking interval, barrenness, and ears per plant. Hybrids with the highest yield are grown at the density for which they were bred.
8
Genetic yield gain occurs as a result of adaptation to continual increases in plant density and drought stress. This is perhaps the most evident and quantifiable change in corn hybrids over the years. Adaptation to high density has been responsible for a significant portion of corn yield gains during the last decade. Shorter ASI (Anthesis-to-silking), reduced barrenness, and more ears per plant at high density are traits that are strongly associated with adaptation to increase plant density and resulted from direct or indirect selection. Genotypes adapted to high density do not show increased yield potential per plant, even though they have greatly increased corn yield potential per unit area. Several examinations of US hybrids showed that open pollinated cultivars and old hybrids provided their highest yields at the lower densities typical of their era, whereas the newest hybrids yielded the most at the higher densities typical of recent years.
In Iowa, corn population has steadily increased at a rate of more than 400 plants per acre since 1992 (Farnharm 2001). This increase can be attributed to the improvement of hybrids that tolerate stress in high populations. Although, optimum plant population depends on factors such as hybrid, moisture stress level, soil fertility, and yield goal; Farnharm found producers should adjust populations according to these factors. The optimum plant population not only varies between regions of the state, but from season to season, and field to field on the same farm. Research results from Iowa State University show that optimum populations vary across locations, but the variations are relatively small. When environmental conditions are favorable, soil fertility levels are optimized, and appropriate hybrids are selected; optimum yield occurs when populations in the range of 28,000 to 32,000 plants per acre are used.
9
During the late 1990s, research in the northern Corn Belt comparing 15-and 30-inch row corn illustrated yield benefits of narrow rows (Porter, et al. 1998). Iowa producers questioned whether benefits to narrow row corn spacing (< 30 inches) existed in Iowa. Research was conducted to evaluate the effect of row spacing and related planting
decisions on the yield of modern corn hybrids. During the 1997, 1998, and 1999 growing seasons, the effects of row width and harvest plant density were evaluated. The objective of the study was to identify the optimum plant density for corn planted in 15-inch rows compared with 30-inch rows. This study was conducted on multiple university research farms. The optimum yield in 15-inch rows was at 32,000 plants per acre, and 36,000 plants per acre produced the highest yield in 30-inch rows. In summary, yield advantages to narrow rows were evident; however, the greatest yield benefit was observed at 32,000 plants per acre, a plant density higher than currently planted by most corn producers in Iowa. In summary, yield is frequently a function of population.
10
CHAPTER III: SEED CORN TECHNOLOGY
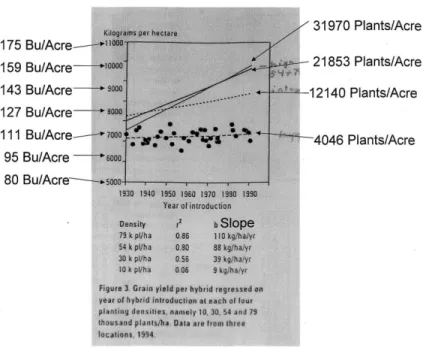
Corn breeding has found the easiest yield increases by developing plants that tolerate stress due to crowding better than preceding cultivars. Mechanically, the easiest way to apply stress is to increase seeding rates and select for decreased bareness, improved stand ability, better leaf health, and the ability of the plant to stay green. Looking at hybrid eras, there isn’t an increase in ear size or per plant yield components but you do notice the ability to increase seeding rates with newer hybrids and get higher yields.
Figure 3.1: Eras of Introduction
Figure 3.1 presents Duvick slide shows the eras of introduction from 1930 to 1990. At 4,046 plants per acre, yields are essentially the same when comparing all eras. In 1930 and until approximately 1950, the optimum planting rate for hybrids was approximately 12,000 plants per acre. From 1960 to the late 1970s, the optimum rate was in the 20,000 range. After 1980 and progressing into the 1990s, seeding rates in the upper 20,000s to 30,000 range produced the highest yields. Improvements in yield will likely rely on
11
decreasing plant stresses and genetic engineering that creates differences in the ability to increase seeding rate and produce higher yields as a result.
The idea behind a response to population is that different hybrids respond to interplant competition differently. As trait costs increase the price of seed, economic decisions can be made for seeding rate based on the predicted response of that genetic type and the marginal cost associated with increasing the seeding rate.
A research trial was conducted with a simple split in the population where the seeding rate is increased 6,000 seeds. Statistical analysis rarely shows a hybrid*population interaction for a single location. However, when data are combined over locations, often the hybrid*population interaction becomes significant.
Environment also plays a role in response to population. Looking at environment from a grain yield capability, yield levels at approximately 150 bushels and above and start to see increasing yields with strong separation in yield environments above 200 bushels. Actual yield reductions from increased seeding rates at yield environments lower than 150 bushels may occur, although the cost savings possible with accurately diagnosing your yield environment’s capabilities are not realized.
Increasing yields through new biotechnology introductions appear to have the potential of increasing seeding rates to obtain higher yields. The first commercial genetically engineered product available for human consumption was the Flavr Savr tomato (Ramsel 2009). This product was developed by Calgene by adding an antisense gene and a bacterial gene that interfered with the production of 1-Aminocyclopropane-1-carboxylic acid (ACC). ACC is a precursor to ethylene that causes ripening in plants. Ethylene also causes senescence of plant tissues under drought stress. Monsanto acquired
12
Calgene in 1996. By regulating the production of ethylene under drought stress through abscisic acid (accumulates in roots as a response to drought and then transfers to leaves as part of function that causes stomatal closure), plants continue with photosynthesis and the production of carbohydrates. A shortage of carbohydrate availability, particularly in the reproductive stages results in a decrease in yield. Drought genes may provide a step change in the plants ability to maintain photosynthesis levels at lower plant water potentials, increasing their tolerance to drought.
A mechanism is important to regulate before changing the drought gene is the regulation of phytochrome sensory in corn. Phytochrome senses light quality or red:far red ratio of light around the plant. Phytochrome is the sensory mechanism responsible for the “switch point” created when weed competition persists in a field. Phytochrome influences genetic determination of several factors in a plant including root:shoot ratio, yield
components, height, etc. We’ve known about phytochrome since the 1960s. There are 6 key phytochrome genes in corn and researchers have successfully regulated phytochrome genes in Arabidopsis. Finding ways to regulate these genes in corn could result in ways to increase seeding rates and decrease interplant sensitivity to increasing seeding rates. This would help maintain intraplant yield components, create less root reduction due to
interplant competition, and lower ear height (that usually rises under higher seeding rates) which helps with fall harvest intactness. Developing sensory mechanisms before the drought gene may greatly improve the efficacy of the drought gene.
In the next 20 years, there is a need to measure the response to population (RTP) among different genetic origins. This will allow for higher seeding rates to increase yield potential and realize the potential brought by new technologies.
13
Genetic families effect RTP scores (WinField Solutions 2009). Each genetic family (Northern, Eastern, Western, and Southern) in general has distinctive differences in RTP from a data perspective (Scholting 2009). It is well documented that Northerns and Easterns are predominately semi-flex to fixed eared type hybrids. “Flex” and “Fixed” are terms used to describe how the ear develops (Nafziger n.d.). Westerns in general have some girth to them and flex in girth. Southerns traditionally have been the longest, most stretch eared type of hybrid in the marketplace. Flex eared hybrids have very low RTPs, often resulting in a decrease in yield with too much population.
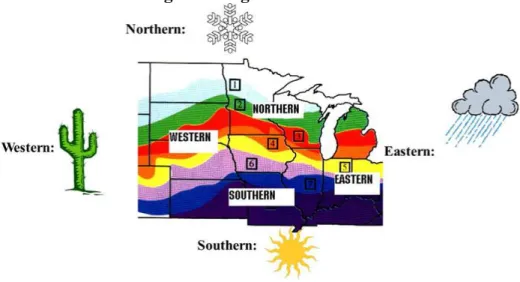
Figure 3.2: Correct Positioning to Manage Risk
Croplan Genetics labels its hybrids by genetic family. These families are broken into 4 main groups. Northern, Eastern, Western, and Southern (figure 3.2). These families derive from during the days of open pollinated corn. Farmers would select the right genetics by saving the largest ear for seed. Over time, these genetics possessed the characteristics that favored the local environment. The Easterns handle sticky wet clays and have tremendous disease resistance. The Northerns have excellent cool tolerance, flower early and handle a wide variety of soils. The Westerns are excellent for drought
14
tolerance, and native corn borer tolerance, and the Southerns handle heat exceptionally well and prefer lighter soil types.
3.1 Northerns
These derive from the Minnesota type area where soils are excellent with very high organic matter and high water holding capacity. Because of the types of soils, along with geography (north) these types of genetics fit this area well. Cool tolerance, early flowering, and fast drydown make these corn hybrids a great fit for this type of geography. However, soil type produces a more fixed ear style of hybrid. With high water holding capacity and heavier textures, higher densities are required for those soils to yield, which in turn drives a more fixed eared approach. Ultimately this means that Northerns traditionally have higher RTPs.
3.2 Easterns
These are much the same as Northerns, however the disease tolerance is
exceptional and for the most part, disease occurs later in maturity. These hybrids derive from the eastern corn belt where they have similar soils with higher water holding capacity along with heavy clay content, resulting in fixed eared style of products. Easterns usually have some of the absolute highest RTP scores.
3.3 Westerns
These derive from Nebraska and the Dakotas. For the most part, these have more flex through time, and because of less moisture, lower densities are planted. This drove a flex eared type hybrid that would compensate for yield on good years, yet on dry years, wasn’t too thick to succumb to drought stress. Thus, Westerns flex usually in girth and have a medium RTP score.
15 3.4 Southerns
These are the large ear type of hybrids. They flex huge ears at lower densities and are driven by ear size, not population. Traditionally, these types of genetics have benefitted from lower densities as the stalks, roots, and yields would improve in these situations. Higher densities require more use of fungicides, timely harvest, and risk of crop loss through poor management. Southerns have some of the lowest RTP scores as a whole. 3.5 Summary
Genetic families are becoming less and less influential in the seed industry. There are multiple families, crosses, etc. involved in many of the new products. For example, the new western is called a W.UR. This has some unique global germplasm placed into the pedigree (U.R.) that takes away the flex in ear girth, but adds the ability to flex in length. Most of the newer genetics are like this and RTP scores in the future will vary on a hybrid by hybrid basis.
What is the impact of RTP at the farmgate? RTP can be the difference in hybrid success, selection, and also the ability to understand if the seller knows what they are talking about. From a hybrid success standpoint, knowing if hybrid A needs density or is hindered by density makes that a good or bad product to the grower. Chances are the producer won’t know until harvest, but at that time, they’re not thinking about what that seed cost, but looking at yield. Hybrid selection will be key at the farmgate as well. If a grower absolutely will not plant a population more than 24,000 then they need to select hybrids accordingly using RTP scores. If they plant nothing below 34,000, then a whole different set of hybrids is needed. Thus, without knowing the RTP scores, this can be nothing but a guessing game. It is important to understand that RTPs are greatly influenced
16
by fertility and management. When improper management is used, RTP does not matter like it does when precise management is utilized.
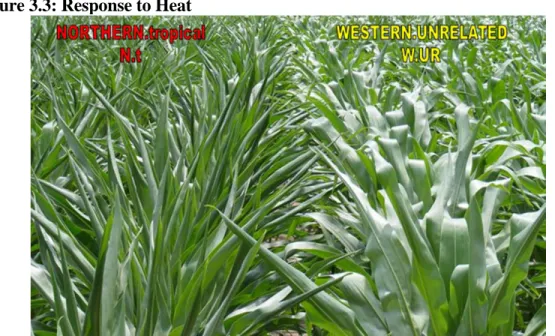
Figure 3.3: Response to Heat
Figure 3.3 is one example of how important it is to use the genetic family to create a diverse portfolio. The hybrid on the left is the plot winner as far as yield from the prior year. The year prior had a fair amount of rainfall and a cooler growing season occurred. The hybrid produced high yields in a lot of plots. In a heat driven year with stress, it isn’t doing so well compared to the western hybrid. If limiting hybrid choices to a single genotype, increased year to year production risks may occur due to fluctuations in year to year growing conditions. Thus, there is a need for diversity in hybrid selection to reduce risk.
17
Figure 3.4: 6831 Hybrid Response to Dryland Stress.
In figure 3.4, the population makes a difference. This is a flex eared hybrid at two different populations under stress. The 42,000 isn't the right population for this hybrid.
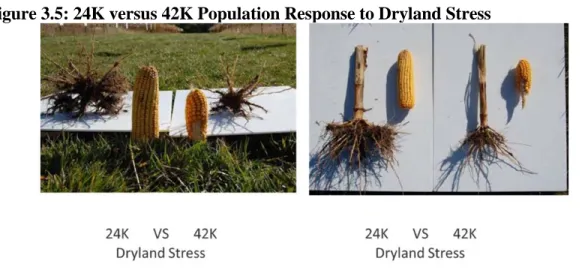
Figure 3.5: 24K versus 42K Population Response to Dryland Stress
Figure 3.5 is the same example, just showing how the ear and root size are affected by the different populations. Usually farmers think ear size, but when there is too much population, the odds increase for root and stalk lodging as well.
18
Figure 3.6: Small rooted fibrous Southern and penetrating rooted Eastern
Roots morphology is an important thing to look at when studying population. Figure 3.5 shows the decisions to increase yield shouldn’t just be based on flex ear and fixed ear hybrids, but the risk could be pushing hybrids into risky situations. The ability to identify different root styles helps farmers understand why certain hybrids respond
differently in different conditions. Placement of the hybrid in the right soil for a hybrid is driven by the root morphology. Each genetic type has a different rooting pattern with the hybrids on the right, northerns and easterns having what is called more penetrating root types (figure 3.6). These are the types of hybrids that handle the heavier soils, sticky soils, and compaction layers. The root hairs are thicker and coarser, but there are not as many of them. Because of this, the amount of root surface area for the absorption of moisture is less than the more fibrous roots on the left. These are the Southerns and Westerns. These products handle lighter soils such as silt loams and even sands better because they have more surface area enabling better uptake of moisture under stress.
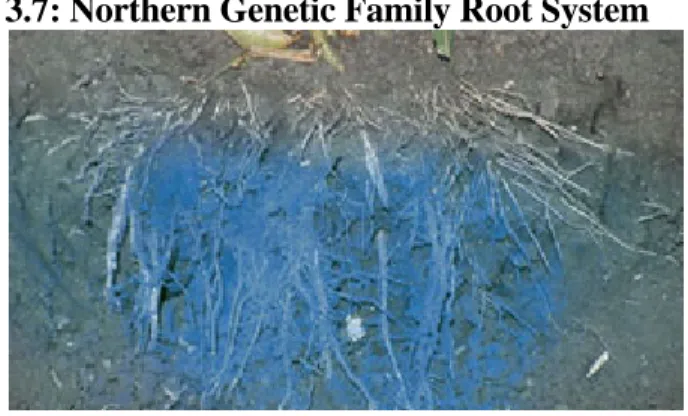
19 Figure 3.7: Northern Genetic Family Root System
The Northern Genetic Family root system tends to be a more penetrating root system that may not cover as much surface area, but lends to strong agronomics (figure 3.7). These products may have the ability to withstand higher populations. The root mass is narrower supporting more plants per acre in the same space and having a higher response to population.
Figure 3.8: Southern Genetic Family Root System
A characteristic of the Southern Genetic Family is a strong fibrous root system with high surface area, enabling strong moisture and nutrient absorption (figure 3.8). This potentially allows these to handle lower populations. The root mass takes up more horizontal space and needs more space per plant. These hybrids typically have a low response to population.
20
Figure 3.9: 6831 Hybrid on Dryland Stress vs. Productive Irrigation
One method used in Answer Plots was that each hybrid was planted at 4 different populations: 24, 30, 36, and 42K.This enabled study visually, along with yield data, on how each hybrid population should be managed. Figure 3.9 shows under stress, 6831 yielded the best at 30K, while under productive irrigation, 42K was the best population.
Figure 3.10: 6818 VT3 on Dryland Stress vs. Productive Irrigation
The hybrid 6818 performs well silking under stress. Figure 3.10 shows that even under stressful conditions, it still filled out the ear to the tip at 42,000. If this hybrid
performs this well under stress, it will also do the same under irrigation. This would be one of those high RTP products where yield is driven by density.
21
CHAPTER IV: METHODS
The data used in this project came from Answerplots (WinField Solutions 2007). Answerplots are designed to study genetics, traits, technologies, and how they correlate to overall yield. The program started in the late 1990s and was primarily an avenue for agronomist training and development. This platform provides the opportunity to look at “what if” situations on actual farms.
Answerplots are about understanding corn and soybean plants and how they flourish under different conditions. It is a place to study hybrids, varieties, traits,
technologies, fertility management and many other common farming decisions throughout the growing season. It is an on-farm laboratory. Half of the Answerplot, 20 acres, is for demonstration and the other half is for research purposes. It is science based not just theory based and there are products being tested for labeling and pipeline advancement. The Answerplot is a joint venture with the support of many companies in the agriculture community, all researching the value proposition to the end user, the grower.
The system was designed so that no grower would have to drive more than 45 miles to a plot. This makes the information collected relevant to each individual. The conditions that affect the crops at the answer plot are the same conditions that the farmer deals with in their fields. Day long sessions are held approximately two times during the summer where growers can ask questions and get industry to provide them with answers. The approach that growers experience at the answerplot events allow them to touch, feel, and see things.
22 Figure 4.1: Answer Plot Locations
Source: (WinField Solutions 2009)
There are over 150 plots across the Corn Belt (figure 4.1). This allows the
opportunity to bring new products and ideas to the marketplace. The information shared at these events is wrapped around the R7 concept (WinField Solutions 2009); the right genetics, right soil type, right plant population, right traits, right nutrition, right cropping system, and right crop protection. This provides a broader approach to understanding sustainability and yield. The ultimate goal is to increase a grower’s profits on a per acre basis. Answerplot provides answers to today’s questions, so farmers can apply them in their fields tomorrow.
One goal of the Answerplot system is to make the next growing season better than the last by digging deeper, thinking smarter, strategic investing, and solid analysis. The plots allow products and expertise to be conveyed to allow farmers to evaluate what works, and most importantly, why it works. Through side by side comparisons, product
23
traits and genetics, seed treatments, herbicides, insecticides, fungicides, adjutants, micronutrients and new agronomic practices and how they work together to get the most out of every field.
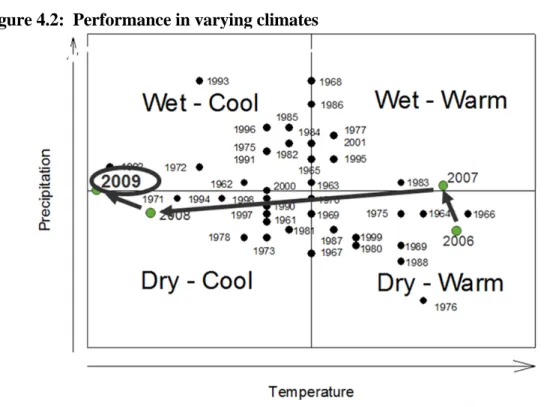
Figure 4.2: Performance in varying climates
When considering cropping years, each one is different. Figure 4.2 allows the comparison with other cropping years. The data were collected in 2009 which was characterized as wet and cool. Other years that would also be categorized as wet and cool years are 1971, 1992, and 2008. Also, 2009 was an outlier year with extreme conditions of cool and wet. Other outlier years where extreme conditions were present include 1966, 1968, 1976, and 1992.
24
Figure 4.3: January to November 2009 Statewide Precipitation Ranks
Source: (National Climatic Data Center/NESDIS/NOAA 2009)
Weather in 2009 was above average moisture for the majority of the cornbelt (figure 4.3). There were some regions that received record amounts of rain fall. Only the northern region stayed near normal, with the east, west, central, and southern regions all receiving above average rainfall.
25
Figure 4.4: January-November 2009 Statewide Temperature Ranks
Source: (National Climatic Data Center/NESDIS/NOAA 2009)
Temperature ranged from near normal to below normal throughout the regions the corn was grown (figure 4.4). The west and north regions were the coldest.
26
Table 4.1: Summary Statistics for Characteristics for Answer Plot Corn Trials for 2009 Mean Standard Deviation Minimum Maximum Mycogen 0.0756 0.2644 0 1 Dekalb 0.1072 0.3094 0 1 NK 0.0794 0.2704 0 1 Pioneer 0.0904 0.2868 0 1 Herbicide 0.9641 0.186 0 1 Above Ground 0.7976 0.4018 0 1 Below Ground 0.6435 0.479 0 1 North 0.0995 0.2994 0 1 East 0.2292 0.4204 0 1 South 0.1574 0.3642 0 1 West 0.2569 0.437 0 1 Population 0.5 0.5001 0 1 Population 35 5.0006 30 40 Bushel/Acre 199.505 26.804 89.104 259.303 Moisture 22.746 4.269 13.668 44.439 Test Weight 55.741 2.097 48.188 61.3
The average yield of total samples for 2009 was near 200 bushels ranging from 89 to 259. The moisture was 22.7 and the average test weight was 56 pounds. A total of five companies were examined. The largest number of trials were from Croplan Genetics (64%) followed by DeKalb (11%), Pioneer (9%), NK (8%), and Mycogen (8%). Croplan Genetics was the default brand for the regression model. Traits included in the study compared to the default conventional corn were herbicide (96%), above ground (80%), and below gound (64%) trait options. These trait options come from three different suppliers including Monsanto, Dow, and Syngenta. Entries with an above or below ground trait usually include herbicide tolerance as a trait. There were 5 regions represented by the data. The central region included 27% of the entries, and was the default. The west (25%) and east (23%) represented the bulk of the information. The north (10%) and south (15%)
27
composed the rest. Of the total entries, 50% were at 30,000 plants per acre, 50% at 40,000 plants per acre.
Yield = F (Brand, Population, Brand X Population, Traits, Location) Moisture = F (Brand, Population, Brand X Population, Traits, Location) Test weight= F (Brand, Population, Brand X Population, Traits, Location)
Yield, moisture, and test weight were hypothesized to be a function of brand, population, a brand population interaction, traits, and location. Moisture and test weight were examined to identify any impact changes in population might have on the variables. The Brand variables, Croplan Genetics, Mycogen, Dekalb, NK, and Pioneer test whether there is a statistically significant difference between companies. The expected sign for Mycogen and Pioneer is negative for yield. The population variables measure the impact of 30,000 versus 40,000 seeds per acre of yield moisture and test weight. The expected sign for yield is positive. Traits represented were Conventional, Herbicide only, above ground, (BT and HX), and below ground (VT3, HXX, and SS). The above ground traits provide suppression and control of corn borer and black cut worm. The below ground technologies of vector triple 3, herculex extra, and smart stax provide the suppression and control of corn root worm insects. They also include ear worm and corn borer protection. The expected signs are positive for above and below ground traits. Locations were
represented by regions of the Corn Belt. The North region included the states of
Minnesota, Wisconsin, Michigan, and North Dakota. The East region includes plots east of Indiana. The West includes most states west of the Missouri river and includes South
28
Dakota, Nebraska, and Kansas. The south region includes Texas, Missouri, and the delta. The default region was Central which is made up of Iowa, Illinois, and Indiana.
The base model was built to determine if there was a yield advantage by increasing population. As hybrids evolve, and become more aggressively managed, the industry has added plant health into the hybrids. A drawback of adding health usually inhibits the hybrids ability to “flex” for yield, causing the need for more harvestable plants, with more ears and a “fixed” size. To complement the base yield model, moisture and test weight were also compared to see if increasing the population had any effect on them.
Two alternative yield models were estimated. One to identify whether there is a trait population interaction. The other model was to identify if the genetic family of a hybrid affected the yield models. This allows the determination of the robustness of population estimates on yield.
Yield = F (Brand, Traits, Location, Population, Trait X Population) Yield = F (Brand, Family, Traits, Location, Population)
29
CHAPTER V: RESULTS
When analyzing the models, statistically significant differences are important but so are economically significant differences because that helps a farmer manage hybrids better. For example if there is a 2 bushel increase by brand, 0.5 moisture decrease, 9 bushel
increase by trait, and it takes 10,000 more population to receive another 8.5 bushels, without effecting test weight and moisture, is the overall rate of return for the farmer improving?
5.1 Economics of Population
Identifying the economic impact of increased population can be determined by comparing the price of the population increase to the gain or loss in yield. The pricing structure is categorized by trait and region (figure 5.1). Using 2009 seed prices, planting a below ground trait hybrid in the west region at 30,000 plants per acre would cost $116.63. Planting at 40,000 plants per acre would cost $155.50. There would be an additional cost of $38.87 per acre for a 10,000 plant per acre increase.
Figure 5.1: 2009 Corn Prices
2009 pricing Croplan Genetics
Trait $/bag (80,000 kernals)
Conventional $ 151.00
Herbicide $ 241.00
Above Ground $ 261.00
Below Ground by region
West, North $ 311.00
Central $ 345.00
30
Figure 5.2: 2009 Chicago Board of Trade Corn Prices
Source: (Chicago Board of Trade 2009)
The trading range of corn based on the CBOT January through December 2009 (figure 5.2) was $3.25 to $5.00 per bushel. The average price per bushel was $4.13 per bushel. For the mean corn price in 2009, a 9.4 bushel increase in yield (38.87/$4.13) is needed to cover costs incurred with a population increase of 10,000 plants per acre.
Figure 5.3: 2008 Chicago Board of Trade Corn Prices
31
The average range of corn based on the CBOT January through December 2008 (figure 5.3) was $2.75 per bushel and $8.00 per bushel. The average price per bushel was $5.38 per bushel. When planning for 2009 based on 2008 prices, a 7.2 bushel increase would have been needed to recover costs.
Table 5.1: Yield with Brand Interaction 0-1 Population Variable Regression Statistics R Square 0.524451 Adjusted R Square 0.522623 Standard Error 18.51929 Observations 4180 Coefficients Standard
Error t Stat P-value
Intercept 196.9218 1.645059 119.705 0 Mycogen -6.00064 7.787135 -0.77058 0.440997 Dekalb 2.090339 6.68239 0.312813 0.754438 NK 1.074033 7.617265 0.141 0.887877 Pioneer -0.31062 7.196833 -0.04316 0.965576 Herbicide -0.82 1.63086 -0.5028 0.615129 Above Ground 0.738084 1.001828 0.736737 0.461324 Below Ground 8.963994 0.8465 10.58947 7.1E-26 Mycogen-pop 0.051856 0.220188 0.235509 0.813825 Dekalb-pop -0.06002 0.188922 -0.31768 0.750742 NK-pop 0.029165 0.215385 0.135408 0.892296 Pioneer-pop 0.03037 0.203377 0.149329 0.881301 North -60.5597 1.077317 -56.2134 0 East 1.873547 0.823471 2.275183 0.022946 South -1.41937 0.918325 -1.54561 0.122275 West -5.6455 0.799166 -7.06423 1.88E-12 Population 8.741598 0.712017 12.27723 4.63E-34
This yield model had an R-squared of 0.52 (Table 5.1). The closer the R-squared is to 1, the more predictive the regression. Using Croplan Genetics as the default brand, the results show DeKalb was 2 bushels better and Mycogen was 6 bushel worse. Neither of these companies have a t-statistic close to 2 so neither are statistically significant. Though
32
this may not be statistically significant, this may be important because Croplan sources some germplasm from Monsanto and it is believed that the yield would be a few bushels lower.
When looking at the brands and population interaction, there was no statistically significant result, positive or negative by brand and population increase (table 5.1). When looking at traits, there were statistically significant bushel differences. Using Conventional as the default, adding the below ground traits increased yield by almost 9.0 bushel. With a t-statistic of 10.56, it is statistically significant. These results make agronomic sense as well because of more vigor and better yield protection with the below ground traits.
Looking at the 5 regions, using the central region as a default, many regions had yield differences that were statistically significant (table 5.1). The north was 60.55 bushel less, with a t-statistic of -56.21. The north had an early frost and short growing season during 2009. There was also less sunlight late in the year taking the top off of yield. The Central region fared well, but was out done by the east with a 1.87 bushel advantage.
When looking at yield gain with population increase, there was an 8.74 bushel increase with a 12.28 t-statistic (table 5.1). Increasing hybrid population in 2009 was favorable. Higher population with a below ground trait hybrid and farming in the east region was where the highest yields were in 2009.
33
Table 5.2: Yield with BT Trait Interaction and a 0-1 Population Variable Regression Statistics R Square 0.524432 Adjusted R Square 0.522719 Standard Error 18.51743 Observations 4180 Coefficients Standard
Error t Stat P-value
Intercept 197.0385 2.217715 88.8475 0 Mycogen -4.18567 1.11702 -3.74718 0.000181 Dekalb -0.01026 0.965451 -0.01063 0.991522 NK 2.0948 1.092679 1.917123 0.055291 Pioneer 0.752336 1.060901 0.709148 0.478272 Herbicide -0.89849 2.290487 -0.39227 0.694879 Above Ground 0.808535 1.389042 0.582081 0.560544 Below Ground 8.793154 1.168293 7.526501 6.35E-14 Herb-pop 0.156976 3.216933 0.048797 0.961084 Above-pop -0.1409 1.924557 -0.07321 0.941641 Below-pop 0.341678 1.610576 0.212147 0.832003 North -60.5597 1.077209 -56.2191 0 East 1.873547 0.823388 2.275412 0.022932 South -1.41937 0.918233 -1.54576 0.122237 West -5.6455 0.799086 -7.06494 1.87E-12 Population 8.508261 3.058956 2.781426 0.005436
The default for the model was conventional corn, or no traits. The R2 of the model was 52% (table 5.2). The model was estimated using 4,180 observations. The model was statistically significant in explaining corn yield. Mycogen had a statistically significant, at the 5% level, negative yield coefficient of 4.2 bushel when compared to the Croplan Genetics hybrids. NK has a 2.1 bushel yield advantage compared to Croplan Genetics. This was statistically significant at the 10% level. The trait variables did not result in a statistical difference in yields except for below ground traits that resulted in 8.8 bushel advantage compared to conventional. Moving from a 30,000 to 40,000 population resulted in a statistical yield advantage of 8.5 bushel. There was no statistically significant
34
interaction between population and traits. The north region resulted in a 60.6 bushel disadvantage compared to the central region. The west had a statistically significant lower yield of 5.6 bushel compared to the central region. The east had a statistically significant yield of 1.9 bushels above the central region. Overall, there was a strong population benefit increasing to 40,000 population compared to 30,000 in 2009. The results with the
population brand interaction we almost identical to the population trait interaction.
Table 5.3 Genetic Family with a 0-1 Population Variable Regression Statistics Multiple R 0.752260188 R Square 0.56589539 Adjusted R Square 0.563102224 Standard Error 17.39886487 Observations 1878 Coefficients Standard
Error t Stat P-value
Intercept 161.6953964 12.8736225 12.56021 8.57E-35 NK 2.929216857 1.26252589 2.320124 0.020442 Eastern -4.858866184 1.506658775 -3.22493 0.001282 Southern 0.561099856 1.022115635 0.548959 0.583099 Western 3.449786704 1.945552208 1.773166 0.076364 Herbicide 7.920002404 12.50470695 0.633362 0.526575 Above Ground -7.517095251 1.614320651 -4.65651 3.44E-06
Below Ground 16.50490846 1.489542357 11.08052 1.12E-27
North -60.91553371 1.548819201 -39.3303 6.8E-247
East 1.417913647 1.15566137 1.226928 0.220004
South -2.06839673 1.30463034 -1.58543 0.113039
West -5.787654422 1.12075941 -5.16405 2.67E-07
Population 0.920539314 0.080297776 11.46407 1.89E-29
The genetic family model used Croplan Genetics, and NK hybrids broken down into Genetic Families; Northern, Eastern, Western, and Southern. Northern was the default
35
family (table 5.3). The objective was to determine whether the genetic family affected the results. NK compared to Croplan Genetics had a 2.9 bushel advantage with a 2.32 t-statistic. The eastern hybrids were 4.9 bushel below the Northern default, with a t-statistic of 3.22. The Western hybrids had a 3.4 bushels advantage with a t-statistic of 1.77. When only looking at families, there were 1878 observations. The population increase of 0.92 with a t-statistic of 11.5. Some of the population difference found in table 5.1 and table 5.2 may be a result of the genetic family. This is an area for future research with the
underlining estimate that the Northern and Eastern hybrids would pose a greater positive response to population that the Southern and Western hybrids.
36
Table 5.4: Moisture with Brand Interaction and a 0-1 Population Variable Regression Statistics R Square 0.653176 Adjusted R Square 0.651843 Standard Error 2.519146 Observations 4180 Coefficients Standard
Error t Stat P-value
Intercept 21.96007 0.223774 98.13482 0 Mycogen -0.29462 1.05927 -0.27813 0.780925 Dekalb -0.78665 0.908994 -0.86541 0.386863 NK 0.303388 1.036163 0.292799 0.76969 Pioneer -0.2596 0.978972 -0.26518 0.790883 Herbicide 1.392665 0.221843 6.277708 3.79E-10 Above Ground -0.30362 0.136277 -2.22793 0.025938 Below Ground 0.411672 0.115148 3.575153 0.000354 Mycogen-pop 0.000203 0.029952 0.006778 0.994592 Dekalb-pop 0.001874 0.025699 0.072934 0.941862 NK-pop -0.00377 0.029298 -0.12873 0.897577 Pioneer-pop 0.003113 0.027665 0.112522 0.910415 North 7.209219 0.146546 49.19439 0 East 1.305612 0.112015 11.65566 6.46E-31 South -5.60622 0.124918 -44.8791 0 West -2.37787 0.108709 -21.8737 1.7E-100 Population -0.00748 0.096854 -0.07728 0.938406
Figure 5.4 shows moisture with brand interaction to determine whether population affects harvest moisture. The R2 is 0.65. DeKalb hybrids dried down a little more with a 0.8 point moisture advantage, and t-statistic of 0.87. The intercept was at 22 points moisture. Most research data are taken at higher moistures than normal commercial harvest moistures to preserve quality and accuracy. Having a below ground trait added almost a half point moisture 0.41, due to added yield and it was statistically significant at the 5% level with a 3.57 t-statistic. Having an above ground BT, resulted in 0.3 points less moisture with a 2.23 t-statistic. The regions, due to the weather were significantly
37
sunlight in the south and west, the moisture was 5.6 and 2.4 points less respectively. There was not a statistically significant relationship between moisture and population.
Table 5.5: Test WT with Brand Interaction and a 0-1 Population Variable Regression Statistics R Square 0.587845 Adjusted R Square 0.586261 Standard Error 1.349098 Observations 4180 Coefficients Standard
Error t Stat P-value
Intercept 56.37159 0.11984 470.3915 0 Mycogen -0.14922 0.567279 -0.26305 0.792527 Dekalb 0.223013 0.486801 0.458121 0.64689 NK 0.1506 0.554905 0.271397 0.786099 Pioneer 0.165935 0.524277 0.316502 0.751637 Herbicide -1.03698 0.118805 -8.72838 3.68E-18 Above Ground 0.39116 0.072981 5.359713 8.79E-08 Below Ground -0.15182 0.061666 -2.46193 0.01386 Mycogen-pop -0.00013 0.01604 -0.00804 0.993588 Dekalb-pop 0.000158 0.013763 0.011501 0.990824 NK-pop -0.00039 0.01569 -0.02506 0.980008 Pioneer-pop -2.2E-05 0.014816 -0.00149 0.998808 North -4.12147 0.078481 -52.5157 0 East 0.215717 0.059988 3.595976 0.000327 South 2.109024 0.066898 31.52577 8.2E-196 West 0.579501 0.058218 9.954001 4.38E-23 Population -0.00779 0.051869 -0.15016 0.880648
Test weight was examined in table 5.5 to determine if any of the variables affected test weight. The average test weight was 56.4 pounds per bushel. The test weight was not statistically different by brand. Hybrids with herbicide traits were 1.03 pounds per bushel lighter than conventional and hybrids with above ground traits were 0.40 pounds per bushel heavier than conventional. Both estimates are statistically significant.
38
The south region was significantly heavier due to environmental conditions (table 5.5). The north experienced early frost and a cooler fall with less sunlight and was 4.1 pounds per bushel lighter than the central region. The west was 0.6 pounds per bushel heavier. The east was 0.2 pounds per bushel heavier. None of the population variables were statistically significant.
5.2 Summary
Overall, the models indicated that an increase from 30,000 plants per acre to 40,000 plants per acre would result in about an 8.5 bushel per acre increase. The results were robust to alternative model specifications. In addition, there was no effect on moisture and test weight when increasing the planting population by 10,000 plants acre. The cost of increasing the population by 10,000 seeds per acre was roughly $38.87 per acre. With a yield benefit of 8.5 bushel, if the expected corn price was greater than $4.58 per bushel, the increase in population would be profitable.
39
CHAPTER VI: CONCLUSION
Discovering a positive interaction between population increase and yield increase is important because the challenge of feeding the world is important. Increasing corn yield on current land needs to occur to meet global population growth. This study used Answerplot data to analyze the effect of increasing plant population on corn yield in 2009. A total of 4,180 observations were used from around the cornbelt to analyze this relationship.
Multiple regression models were estimated and showed that in 2009 an increase in plant population from 30,000 to 40,000 plants per acre resulted in about an 8.5 bushel increase. This result was robust for various models. Economically, the cost per acre for current seed costs for this increase in plant population is about $38.87 per acre. At a corn price greater than $4.58 per bushel, increasing plant population would have made economic sense in 2009.
Other avenues that could be explored in the future are: row spacing, soil type, and fertility recommendations. The raw data used were also collected by multiple parties. The yields were on fixed acres. Additional yield data could be used, but varying acre amounts could prove difficult. Multiple years of data would be a benefit to the robustness of these results. Future research should include multiple years. This would increase the accuracy by adding weather risk and more observations. By adding more observations, confidence could be gained in the models to recommend seed population by management practices across years. Future research should also include more population levels and in that 30,000 and 40,000 plants per acre limit the ability to examine a nonlinear relationship between yield and population.
40
REFERENCES
Arjal, Renuka D, John D Prato, and Maurice L Peterson. "Response of corn to fertilizer, plant population, and planting date." California Agriculture, 1978: 14,15. Below, Fred, and Laura Gentry. "Producing 300 Bushel Corn Sustainably." 2011 Fluid
Fertilizer Foundation Forum. Scottsdale, AZ, Feb. 21 2011. 4.
Center for Food Integrity. Fun Farm Facts. 2009. http://www.farmersfeedus.org/fun-farm-facts/ (accessed Feburary 2010).
Chicago Board of Trade. Historical Price. 2008.
http://futures.tradingcharts.com/hist_CN.html (accessed 2012).
—. Historical Price Data. 2009. http://futures.tradingcharts.com/hist_CN.html (accessed 2012).
Chung, Jay H, James L Brewbaker, and Charles Ritter. Effects of Increasing Population Density on the Production of Corn in Hawaii. College of Tropical Agriculture and Human Resources, University of Hawaii, 1982.
Farm Journal Foundation. "International Hunger." Farmers Feeding the World. 2012. http://www.agweb.com/farmersfeedingtheworld/international_hunger.aspx (accessed January 2012).
Farnharm, Dale. "Corn Planting Guide." ISU Extention. Setember 2001. (accessed January 12, 2012).
Food and Agricultural Organization of the United Nations. "Feeding the World, Eradicating Hunger." World Summitt on Food Security. Rome, 2009. 18.
Gonzalo, M, JB Holland, TJ Vyn, and LM McIntyre. "Direct Mapping of density response in a population of B73Xmo17 recombinant inbred lines of maize." Heredity, 2010: 583-599.
Gonzola, Martin, Tony J Vyn, James B Holland, and Lauren M McIntyre. "Mapping Density Response in Maize: A direct approach for testing Genotype and Treatment Interactions." Genetics Society of America, 2006: 331-348.
Hashemi, Abolhassan M, Stephen J Herbert, and Daniel H Putnam. "Yield Response of Corn to Crowding Stress." Agronomy Journal, 2005: 839-846.
Hinze, Lori I, Stephen Kresovich, John D Nason, and Kendall R Lamkey. "Population Genetic Diversity in a Maize Reciprocal Recurrent Selection Program." Crop Science, 2005: 2435-2442.
41
Kashiani, P., G. Saleh, and S.N. Abdullah. "Variation and Genetic Studies on Selected Sweet corn inbred lines." Asian Journal of Crop Science, 2010: 78-84.
Lauer, Joe. "UW Extension." March 14, 2007. www.corn.agronomy.wisc.edu (accessed January 12, 2012).
Nafziger, Emerson D. "Getting Corn Plant Population Right." Crop Sciences, University of Illinois, n.d.
National Climatic Data Center/NESDIS/NOAA. Jan-Nov 2009 Statewide Precipitation Ranks. 2009. www.noaanews.noaa.gov (accessed 2012).
—. Jan-Nov Statewide Temperature Ranks. 2009. www.noaanews.noaa.gov (accessed 2012).
Porter, P.M, D.R Hicks, W.E Lueschen, J.H Ford, D.D Warnes, and T.R. Hoverstad. "Row Width/Plant Population affect Corn Response." Fluid Journal, 1998.
Ramsel, Phil, interview by Nate Schroeder. RPM Croplan Genetics (Febuary 2009). Scholting, Carl, interview by Nate Schroeder. RPM WinField Solutions (January 2009). USDA National Agriculture Statistical Service. "2007 Census Data." Annual every 5 years,
2007.
Weber, Andy CEO Farm Journal Media Group. "Farmers Feeding the World." Agriculture's Story. 2012. (accessed Jan 2012).
WinField Solutions. AnswerPlot..com. 2009. www.answerplot.com (accessed 2009). WinField Solutions. "Elite Genetics, Key Traits, Local Expertise." In Croplan Genetics
Seed Guide, by WinField Solutions, 6-9,18-19. 2009. WinField Solutions. "Price." 2009.