NBER WORKING PAPER SERIES
INFORMAL TAXATION
Benjamin A. Olken
Monica Singhal
Working Paper 15221
http://www.nber.org/papers/w15221
NATIONAL BUREAU OF ECONOMIC RESEARCH
1050 Massachusetts Avenue
Cambridge, MA 02138
August 2009
We thank Tim Besley, Ryan Bubb, Steve Coate, Amy Finkelstein, Ed Glaeser, Roger Gordon, Seema
Jayachandran, Henrik Kleven, Wojciech Kopczuk, Stephan Litschig, Erzo Luttmer, Rohini Pande,
Jim Poterba, and numerous seminar participants for comments. We thank Angelin Baskaran, Octavia
Foarta, Angela Kilby, Arash Nekoei, and Yusuf Neggers for excellent research assistance. We gratefully
acknowledge funding from the Harvard University Asia Center (Olken and Singhal), NICHD grant
R03HD051957 (Olken), and the Weatherhead Center for International Affairs and the Taubman Center
for State and Local Government (Singhal). We thank Rob Chase and Diane Steele at the World Bank
for providing us with data. The views expressed in this paper are those of the authors and do not necessarily
represent the views of the World Bank, the National Bureau of Economic Research, or any other institution.
NBER working papers are circulated for discussion and comment purposes. They have not been
peer-reviewed or been subject to the review by the NBER Board of Directors that accompanies official
NBER publications.
© 2009 by Benjamin A. Olken and Monica Singhal. All rights reserved. Short sections of text, not
to exceed two paragraphs, may be quoted without explicit permission provided that full credit, including
Informal Taxation
Benjamin A. Olken and Monica Singhal
NBER Working Paper No. 15221
August 2009
JEL No. H27,H41,O17
ABSTRACT
Informal payments are a frequently overlooked source of local public finance in developing countries.
We use microdata from ten countries to establish stylized facts on the magnitude, form, and distributional
implications of this "informal taxation." Informal taxation is widespread, particularly in rural areas,
with substantial in-kind labor payments. The wealthy pay more, but pay less in percentage terms, and
informal taxes are more regressive than formal taxes. Failing to include informal taxation underestimates
household tax burdens and revenue decentralization in developing countries. We propose a simple
model of information and enforcement constraints that parsimoniously explains the patterns in the
data.
Benjamin A. Olken
Department of Economics
MIT
50 Memorial Drive
Cambridge, MA 02142-1347
and NBER
Monica Singhal
Harvard University
JFK School of Government
79 JFK Street
Cambridge, MA 02138
and NBER
1
Introduction
A key function of government is the …nance and provision of local public goods. Taxation allows communities to overcome the free rider problem that would otherwise lead to underprovision of these goods. In many developing countries, formal direct taxation of households is limited, comprising only 18% of total tax revenues on average compared with 45% in developed countries (Gordon and Li 2005).1 Agricultural sectors are often entirely exempt from taxation, and local taxation is generally quite constrained (Burgess and Stern 1993, Bird 1990). These facts would suggest that local public goods are primarily …nanced outside the local community, either through direct provision or intergovernmental grants.
Substantial anecdotal evidence, however, suggests that local residents in many communities throughout the developing world do contribute substantially – outside the formal tax system – to the construction and maintenance of local public goods (e.g., Ostrom 1991). People pay in both money and labor to these projects, with often complex arrangements determining how much each household should pay and what penalties apply for those who free ride. Many countries even have speci…c vocabulary to describe these systems, such asgotong royong in Indonesia andharambee in Kenya.
We refer to these mechanisms of …nancing of local public goods as “informal taxation.” We de…ne informal taxation as a system of local public goods …nance coordinated by public o¢ cials but enforced socially rather than through the formal legal system.2 Our distinction between formal and informal (legal versus social enforcement) parallels the use of these terms in the informal insurance literature (e.g. Townsend 1994). The involvement of public o¢ cials, discussed in more detail below, distinguishes informal taxation from, for example, provision of local public goods by charities or other non-governmental organizations.
In this paper, we develop some of the …rst systematic micro-evidence on the magnitude, distrib-utional implications, and forms of informal taxation, using a micro dataset we assembled consisting
1
These …gures refer to personal income taxation and are calculated from Table 1 of Gordon and Li 2005.
2This is not to be confused with bribe payments, which are occasionally also referred to as informal taxation.
To the best of our knowledge, the system of …nancing local public goods through these types of payments was …rst described as informal taxation by Prud’homme 1992, who, in his study of local public goods provision in Zaire, de…ned informal taxation to include any "nonformal means utilized to …nance the provision of public goods and services."
of survey data from ten developing countries throughout the world. We then develop a simple framework for thinking about informal taxation that, with very few assumptions, matches the styl-ized facts we observe in the data. In the concluding section of the paper, we discuss the broader implications of our …ndings for public …nance and policy in developing countries.
The …rst stylized fact we document is that informal taxation is a widespread phenomenon, and it can form a substantial share of local revenue. The share of households making informal tax payments is 20% or higher in all but one country in our sample and exceeds 50% in several countries. Participation rates are always higher in rural areas than in urban areas. Across our sampled countries, informal taxes generally comprise a small share of household expenditure (0.85% in the modal country) and a modest share of total taxes paid by households (15.7% in the modal country). However, informal taxes can still be an important source of local public …nance. In our Indonesia sample, for example, including informal taxation almost triples the estimates of the amount of revenue under local control.
The second stylized fact we document is that, within individual communities, informal taxation is redistributive but regressive. Wealthier households in a community are generally more likely to participate in informal taxation schemes than poorer households. The elasticity of total payment with respect to household expenditure is positive but less than one in all countries, indicating that informal taxes rise with expenditure, but the average informal tax rate (i.e., informal taxes divided by total expenditure) falls with expenditure. Informal taxation is therefore regressive, but still provides redistribution if the local public good it …nances is valued equally across the income distribution. Informal taxes are more regressive than formal taxes, both within communities and when examined in aggregate at the national level.
The third stylized fact we document is that the form of payment di¤ers from a traditional tax; in particular, in-kind labor payments play a substantial role in informal taxation. Moreover, both the participation gradient and the elasticity of payment with respect to household expenditure are smaller for labor payments than for money payments, so that labor payments are relatively more important for poorer households. All three stylized facts we observe are remarkably consistent across countries.
Given these facts, we propose a simple model of informal taxation. Although informal taxation may appear suboptimal, we argue that it can in fact arise as the solution to a constrained optimal tax problem. In our model, communities in developing countries wish to …nance a public good in a social welfare maximizing way. Communities face an enforcement constraint (punishments for non-compliance may be limited) and two information constraints: a hidden income constraint (high ability types can pretend to be low ability types) and a shirking constraint (those supposed to be working on public projects can shirk).
We model formal and informal taxation as having di¤erent constraint parameters, arising from di¤erences in their tax technologies. In the informal system, enforcement happens through social sanctions rather than through courts. This means that the informal tax system can use information that is observable but not legally veri…able, so informal taxation mechanisms e¤ectively have better information than the formal tax system. On the other hand, by foregoing formal legal proceedings, the informal system must use less severe punishments – i.e., social sanctions instead of jail time – which limits the progressivity of the informal taxation system. The choice between formal and informal taxes therefore represents a trade-o¤ between enforcement and information.
The model requires few assumptions and parsimoniously explains the observed stylized facts. Informal taxes are likely to be preferred to formal taxes if evasion costs are low or if the community can e¤ectively levy social sanctions. We should therefore expect to see informal taxation in poorer countries and in rural areas. Informal taxation should have a positive income gradient but will not necessarily be progressive. Finally, labor payments can be used as a screening device, since unobservably high ability types face a higher cost of in-kind labor payments relative to monetary payments. This rationalizes the high observed prevalence of labor payments in the data and the fact that labor payments have a lower income elasticity than monetary payments.
We argue that the empirical evidence is more consistent with this model than with alternative models of public goods provision, such as altruism and user fees. Payment decisions do not appear to be made by households unilaterally: in our Indonesia sample, only 8% of households report that they decide for themselves whether to pay; 84% report that a local leader decides. A substantial share of households also report negative consequences for refusal to participate, consistent with the
anecdotal evidence on informal taxation. While it does appear in some cases that households are more likely to pay for goods from which they bene…t, a pure user fee model would not predict the income gradients observed in the data.
While our framework predicts that informal taxation is more likely to be prevalent in developing countries, these types of systems may arise whenever there are limits to formal taxation and such mechanisms are feasible. When Vermont’s school …nance redistribution law made …nancing schools through higher local taxes more expensive, some communities responded by explicitly pressuring households and businesses to make "voluntary" contributions to schools (Winerip 2003). School fund leaders in Manchester, for example, published lists of compliers and encouraged residents to call or visit non-contributer neighbors (Tomsho 2001). Residents described a variety of sanctions levied on non-contributers, ranging from speci…c punishments ("if there is a restaurant that didn’t pay, I know that I’m not going to eat there") to more intangible social sanctions ("it’s hard to look at those people in the same way").3 Although our empirical analysis focuses on developing countries, the model developed here is conceptually applicable to socially enforced extra-governmental provision of public goods more generally.
The paper proceeds as follows. Section 2 provides an overview of the existing literature and Section 3 describes the data. Section 4 presents the stylized facts. Section 5 develops our model of informal taxation, and Section 6 considers speci…c empirical evidence that distinguishes our model from other potential theories. Section 7 discusses the implications of our …ndings and concludes.
2
Existing Evidence on Informal Taxation
Qualitative evidence from a variety of settings suggests that informal taxation is a common form of local …nance for the construction and maintenance of public goods such as roads, schools, and water systems throughout the developing world (e.g., Ostrom 1991), although formal empirical evidence on informal taxation remains fairly limited. A range of studies have documented the presence of 3Similar extragovernmental mechanisms were observed in California when Proposition 13 limited local property
taxes (Brunner and Sonstelie 2003). Labor and money contributions to …re departments, libraries, and recreational services have also been shown to increase in response to …scal limitations (e.g., Ferris 1984, Bice and Hoyt 2000).
informal taxation in various countries in Latin America, Africa, and Asia.4
In many of these countries, informal tax systems appear to form a very important component of community development. In Indonesia, for example, the concepts of gotong royong (mutual assistance) andswadaya (self-help) have become deeply institutionalized within local communities: residents are expected to make labor and monetary payments toward development projects. 37% of the cost of village public goods examined by Rao (2004) in Indonesia are contributed by the community. In Kenya,harambee (pull together) projects accounted for 11.4% of national develop-ment expenditure between 1967 and 1973, and harambee-…nanced spending on particular sectors, such as education, matched or exceeded government expenditure (Mbithi and Rasmusson 1977).
Several patterns emerge from the range of anecdotes and studies of informal taxation. First, payments do not appear to be chosen by households individually. Rather, expected payments are generally coordinated by community leaders or a project committee. Households may be expected to provide a given monetary payment, as in the case of school fees in Kenya (Miguel and Gugerty 2005), or provide a certain number of days of labor (Roseman 1996, Ostrom 1991). In some cases, there may be a choice between paying in labor or in money (Njoh 2003).
Second, many of these studies document the existence of non-contributers and describe a range of punishments that may be imposed on such individuals. Miguel and Gugerty (2005) provide several anecdotal examples of social sanctions in the context of school …nancing in western Kenya.5 A common sanction is the public announcement of the names of parents who are late with fees; other forms of sanctions include "sending letters to the homes of parents late with fees, asking local church leaders to encourage payment during sermons, and making personal visits to the individual homes of debtors accompanied by the local Chief" (Miguel and Gugerty 2005). Other examples of punishments include …nes (Ostrom 1991) and the denial of access to communal resources, such as the use of a cattledip (Thomas 1987). It is possible that punishments could also include exclusion from community credit or risk-sharing arrangements or other types of social enforcement, as in the
4
A non-exhaustive list of countries includes Cameroon (Njoh 2003), China (Eckaus 2003), India (Rao 2004), Indonesia (Rao 2004, Beard 2007), Kenya (Mbithi and Rasmusson 1977, Thomas 1987, Barkan and Holmquist 1989, Miguel and Gugerty 2005, Ngau 1987), Nigeria (Barkan, McNulty and Ayeni 1991), Pakistan (Khwaja 2007), Peru (Larrabure 1966), and Zaire (Prud’homme 1992).
5
The paper argues that limited ability to impose social sanctions in ethnically diverse communities leads to lower …nancing of local public goods.
informal insurance and micro…nance literatures.
Our own direct experience with informal taxation in a village in Central Java, Indonesia, echoes many of these themes. In 2002, a village where one of the authors was staying received 29 drums of raw asphalt from the district government. In order to make use of the raw asphalt to resurface a road, the village needed to raise funds for additional materials (e.g., …nely crushed gravel, coarse gravel, sand) as well as labor. To solve this problem, the village head called a meeting in the neighborhood where the road would be built. At that meeting, the village head, neighborhood head and an informal community leader (a local school teacher), went around the room "assigning" payments to each household. These payments increased with income: poorer households would be asked to pay a small amount (usually a few days of labor), whereas wealthier households were asked to pay in money, with the wealthiest households asked to pay the most. The meeting did not specify what sanctions would be for non-payment; however, given that payments were assigned in a public meeting, one can presume that there would have been social pressure applied to those who failed to meet their assigned payment level.
To the best of our knowledge, quantitative work on the distribution of informal tax burdens has focused on two countries: Indonesia and Kenya. Beard (2007) …nds that Indonesian households with more assets or more education pay more in labor and money toward informal taxation; those with high household expenditure pay less. Note that these e¤ects are not unconditional: regressions include all of these factors as independent variables. In surveys of particular communities in Kenya, Thomas (1987) …nds that labor payments are widespread and that the rich are more likely to make cash payments than the poor, and Barkan and Holmquist (1989) …nd that participation and labor payments tend to follow an inverse U-shape with respect to landholding while payments in cash are increasing in landholding.
An open question is whether or not informal tax mechanisms appear similar across the broad range of countries in which they are observed. In the next sections of the paper, we provide systematic cross-country evidence to document several stylized facts about informal taxation.
3
Data
We compiled microdata from around the world to create a dataset that covers the phenomenon of informal taxation in as many countries as possible. We examined over 100 household surveys, including (but not limited to) every publicly available World Bank Living Standards Measurement Study (LSMS) survey.6 To be included in our sample, a survey needed to elicit information specif-ically about payment towards the provision of local public goods. A typical example of such a question is: "In the last 12 months did you personally or any other member of the household par-ticipate in any of the following ... parpar-ticipate in the collective construction of community works (roads, schools etc.)."7 Our sample includes every household survey that met this criterion. We did not include surveys that asked only about labor sharing agreements among neighbors or con-tributions to local social organizations or cases in which the labor was clearly compensated, such as paid public works days.8
In addition to these pre-existing datasets, we designed a special survey module on informal tax-ation for the Health and Eductax-ation Service Survey in Indonesia. This survey module included de-tailed questions on labor and monetary payments as well as questions on the decision-making process and enforcement of informal taxation not available on the other surveys in the sample. The Indone-sia survey was conducted by Gadjah Mada University and The World Bank as a baseline survey for a poverty-alleviation program. The survey took place in 5 provinces from June-September 2007, and covered a total of 12,000 households in over 2,300 villages. More details about the survey can be found in Olken, Onishi, and Wong (2008).
The types of community works mentioned on these surveys include roads, water and sanitation systems, schools, health centers, dams and irrigation systems, electricity systems, and cleaning of public roads and areas.9 While we refer to these goods as local public goods, they may be excludable in some cases. We return to this issue in Section 6.
6
The review of surveys was conducted in the summer of 2006.
7Guatemala, National Survey of Living Conditions, 2000. 8
It is still possible that in some cases those paying labor are partially compensated by being provided food or other bene…ts not observed in our data.
9
The Indonesia and Philippines surveys also includes payments towards religious places. All results remain very similar if we exclude those who only made these types of payments.
The resulting sample consists of household surveys from 10 countries: Albania, Ethiopia, Guatemala, Indonesia, Nigeria, Nicaragua, Panama, the Philippines, Vietnam and Zambia.10 The sample is geographically diverse, including countries from Europe, Latin America, Africa and Asia. Table 1 provides an overview of our sample of household surveys. The surveys were conducted between 1997 and 2007, and sample sizes range from approximately 1,500 to 30,000. The surveys are nationally representative with the exceptions of Ethiopia, Indonesia, and the Philippines, which were conducted in rural areas only. Indonesia and the Philippines focus on a poorer-than-average selection of rural areas, since both surveys were conducted as baseline surveys for poverty allevia-tion programs. As shown in the table, all surveys contain informaallevia-tion on in-kind labor payments toward public goods; monetary payments and quantity data are available for subsets of countries. Note that the recall period varies across surveys: while most surveys ask about payments over the past year, one survey (Philippines) asks only about the previous six months and two surveys (Nicaragua and Zambia) ask about the previous 5 years (see Appendix A for more details).
Summary statistics for each survey are given in Table 2. The summary statistics (as well as per-capita GDP from the World Development Indicators) indicate the breadth of countries covered by our data. For example, per-capita GDP in the surveyed countries ranges from a low of PP$774 in Zambia to a high of PP$6129 in Panama, and mean years of education for the household head ranges from a low of 2.5 in Ethiopia to a high of 9.6 in Albania.
We include survey data from all available countries in our empirical analysis in order to paint as complete a picture as possible of the informal taxation phenomenon. One caveat, however, is worth noting explicitly. To the best of our knowledge, public labor contributions are legally mandated in Vietnam. If an individual cannot ful…ll his required contribution, he must …nd a replacement worker or make a monetary payment equivalent to hiring a replacement at local labor costs.11 The
1 0
Two countries had multiple surveys: Vietnam and Indonesia. In Vietnam, surveys were conducted in 1998 and 2002; we use the 2002 data which has …ve times the sample size of the 1998 data. The 2000 Indonesia Family Life Survey (IFLS) asks about informal taxation, but only measures routine cleaning activities. We therefore use our survey module for Indonesia which has more comprehensive questions about informal tax payments. A potential concern with our sample of countries is that relevant survey questions are more likely to be included in countries where the phenomenon is prevalent. As discussed in Section 2, anecdotal evidence indicates that informal taxation is common in many other countries that are similar to our sampled countries.
1 1Speci…cally, as of the year 2000, each citizen (men 18-45 yrs old, women 18-35) is required to participate in public
service work, for 10 days per year. If one cannot participate, the individual needs to …nd some replacement worker or submit a …nancial contribution either to the commune/ward people’s committee or to the individual’s employing
payments observed in Vietnam may therefore be a formal tax rather than an informal tax; we discuss this in more detail below.
4
Stylized Facts and Implications
This section presents several stylized facts about informal taxation. We focus on the following questions that are relevant when thinking about any tax: where is it most prevalent? how large is it? who pays it? and how is it collected? The …rst subsection summarizes the prevalence and magnitude of informal taxation and compares the magnitude of informal taxation to formal tax payments made by households and to formal government expenditure. In the second subsection, we examine the distributional implications of informal tax payments and discuss the progressivity of informal taxation relative to formal taxation. The third subsection discusses how these taxes are collected and explores a feature of informal taxation that sharply distinguishes it from conventional taxation: payments are often in labor rather than money. The …nal subsection provides a brief discussion of the implications of these …ndings for public …nance in developing countries.
4.1 Prevalence and Magnitude of Informal Taxation
4.1.1 Descriptive statistics on prevalence and magnitude
We begin by presenting descriptive statistics to examine the most basic question about informal taxation: prevalence. Table 3 presents three sets of descriptive statistics: the share of households making informal taxation payments over the recall period (Panel A), the share of households making in-kind labor payments vs. payments in money and materials (Panel B), and the average amounts of those payments (Panel C) for each country in our sample.12
institution/enterprise. This payment is once per year (per individual), and the required amount is set equivalent to the hiring of replacements at local labor costs. The law speci…es di¤erent degrees of formal punishments depending the type of violations: for example, avoidance for the …rst time gets a warning and …ne. We thank Trang Nguyen for providing this information.
1 2
As noted above, the recall period di¤ers across surveys. We report annualized amounts for quantities but do not adjust the participation data. To facilitate interpretation, the surveys in this and subsequent tables are sorted by survey recall period. For surveys in which respondents were asked only about labor payments, the listed participation rates for "overall participation" can be thought of as lower bounds on true participation rates.
Informal taxation is prevalent in all surveyed countries (Panel A). With the exception of Alba-nia, participation rates are 20% or higher in all countries and exceed 50% in Ethiopia, Indonesia, and Vietnam. Informal taxation is more prevalent in rural areas in every country in our sample for which we have data on both. Across the sample, participation rates are between 27% (Vietnam) and 183% (Guatemala) higher in rural areas than in urban areas.
In-kind payments in the form of labor are common in all countries (Panel B). The share of households paying in labor is higher than the share of households paying in money in 3 of the 5 countries for which we have data on both labor and monetary payments (Indonesia, Nicaragua, and Zambia). In the other two countries (Panama and Vietnam), labor payments are still quite common, with 19 and 24 percent of households making payments in labor, respectively. The gap between urban and rural is smaller for monetary payments than for labor payments in all cases.
Panel C shows the magnitude of informal tax payments for all countries for which quantity data are available. The …gures shown represent annualized labor payments (in days) and annualized monetary payments (in 2000 PPP US dollars). Average labor payments vary from 0.2 days per year in Albania to 14.1 days per year in Ethiopia.
4.1.2 Informal taxes and formal taxes paid by households
To better gauge the magnitude of informal taxation, we compare it to two types of benchmarks. In this subsection, we examine the burden it imposes on households by comparing informal tax payments to household expenditure and to total taxes paid by households. These benchmarks are available for the same households for whom we have data on informal taxation payments, ensuring consistent samples for comparison. In the next subsection, we compare informal taxation to government budgets.
In order to make these comparisons, we monetize the labor payments made by households to construct a measure of total informal tax payments. To do so, we predict the wage for all working household members based on their education, age, gender, and urban/rural status, and value the labor contributions at the average predicted wage for all working household members.13
This method values the marginal and average wage of the household equally. This assumption is consistent with Benjamin (1992) who shows that household composition does not a¤ect own-farm labor supply for agricultural households in Indonesia, suggesting that labor markets for these households are competitive and complete. Since predicted wages vary across households, the magnitude of informal taxation is measured as the social cost of production.14 We use equivalence scale adjusted household expenditure as our measure of household income.15
Data on total tax payments comes from two sources. Direct formal taxes paid by households are calculated as the sum of all direct tax payments observed in the data, and include items such as land and buildings taxes and personal income taxes. Indirect formal taxes (VAT) are imputed from consumption data and VAT and excise rates for each country. We do not include expenditures on food in our VAT estimates, since most households in developing countries are unlikely to pay VAT on most food consumption in practice. Total formal taxes are the sum of direct and imputed indirect taxes. Further details on the calculation of direct and indirect taxes are given in Appendix
divided by 12 and the number of workers in the household. We then regress the household monthly wage rate on each individual’s education, age, and age squared interacted with a female dummy, an urban dummy, and a female x urban dummy. We then divide by the number of working days in a month, which we de…ne as 21.7, to get a measure of the household daily wage rate. 21.7'(365.25/12)*( 5/7), where 5/7 adjusts the wage rate for working days per week. We repeat this prediction separately for each country. We use the predicted daily wage rate, rather than the household daily wage rate, so that when we regress payments on household expenditures below, we will not be using expenditures on both the left hand and right hand sides of the same regression.
1 4Note that this is not necessarily the same as the value of the output produced, particularly if labor payments are
made by individuals whose wage rates exceed the unskilled wage rate. Note also that this measure may be biased if labor contributions are made by those with the lowest opportunity cost of time, making the average household wage an overestimate. On the hand, it is possible that some people who are listed as "working" do not work a full 260 work days per year, which would lead us to underestimate their true wage rate, or that those who contribute are prime-age males with a higher marginal product than the average in the household. We discuss speci…cations using labor measured in days rather than monetized days below.
1 5Income data from developing country household surveys is often unreliable, so we follow the standard convention
of using household expenditures as a proxy for household income throughout the paper. Since household expenditure includes direct and indirect taxes, it is conceptually a "pre-tax" measure. To be consistent, one might also want to add back income lost as a result of informal tax payments. Since our measure of the household wage rate is likely to be noisy, we do not make this adjustment.
Following Deaton 1997, we de…ne equivalent expenditure as household expenditure
(adults+ 1children+ 2inf ants)
Infants are de…ned as those aged 0-4; children are de…ned as those aged 5 to 14. Combining Deaton 1997’s estimates of total child costs and Olken 2005’s estimates of household economies of scale, we set 1 = 0:6and 2 = 0:5and
= 0:85.
As an alternative, we have veri…ed that all empirical results are qualitatively similar if we use log total household expenditure and a set of household size dummies instead of log equivalent expenditure.
A.
Using this data, we calculate informal taxes as a share of total household expenditure and informal taxes as a share of total household taxes (informal + direct formal + indirect formal). Table 4 presents the mean of these variables for each country in the dataset. Since some households may live in areas where informal taxation does not occur, we present both results for all households (rows 1 and 3) and for all households that have non-zero informal tax payments (rows 2 and 4).
Overall, informal taxation appears to comprise a small share of household expenditure, although there is substantial heterogeneity across countries. Mean informal taxation payments range from a low of 0.04% of household expenditure in Albania to a high of 3.8% in Ethiopia. Conditional on making any informal tax payments, shares range from 0.37% (Albania) to 6.8% (Ethiopia).
Informal taxes are a moderate share of total taxes paid by households: mean shares are 0.5% in Albania, 7% in the Philippines, 16% in Vietnam, 17% in Indonesia, and 27% in Ethiopia. As a share of total tax payments, informal taxes are therefore broadly comparable in magnitude to local or state taxes in the United States.
4.1.3 Informal taxes and formal government expenditure
To understand how important informal taxation is to local public …nance, we compare informal taxation to government budgets. We focus on Indonesia, where for the 2001 budget year we have data on both district expenditures and village expenditures for the districts and villages in our survey area.16 We convert all amounts to 2000 PPP dollars. We calculate the mean per-household level of informal taxes and formal taxes from the per-household survey, as well as the mean per-household level of village and district revenues and village and district expenditures for our sample area; results are given in Table 5.17
We …nd that informal taxes are large relative to village budgets. Average annual per household 1 6District budget data in Indonesia is available annually through 2005. Village budgets, however, are only collected
once every decade in the census of villages (PODES); the most recent data comes from the 2002-2003 census of villages, which asked about village budgets during 2001. We therefore use 2001 district budget data as well to ensure comparability with the village data.
1 7Note that the village budgets were available for 19 of the 20 districts in our household survey area. We have
therefore calculated all statistics in Table 5 on the same set of 19 districts to ensure maximum comparability. Note also that the household survey sample only includes subdistricts that are no more than 70% urban, so it potentially excludes the very urban central areas of a few districts.
village budgets are 43.67 dollars per year, whereas our household survey suggests that per household informal taxes are 49.86 dollars per year. Moreover, the o¢ cial village budget actually already includes 13.09 dollars per year in "on-the-books" informal tax payments. If we subtract the 13.09 dollars per year in informal tax payments from the village budget to avoid double-counting, then informal taxes –at 49.86 per year –are 1.6 times as large as all other sources of revenue in the village budget (30.59 dollars per year). The inclusion of informal taxation in the village budget indicates that local governments view informal taxation explicitly as a source of government revenue, and the magnitudes demonstrate that informal taxation is one of the primary ways through which local public goods are …nanced by these villages.
We next compare informal taxation to district budgets. Since Indonesia’s decentralization be-gan in 2001, Indonesian districts have primary responsibility for virtually all local public goods, including local infrastructure, water, health, and education.18 The budget is divided into routine expenditures (mostly civil servant salaries) and development expenditures (mostly capital expen-ditures).19 These district budgets also include the intergovernmental transfers to villages, so these budgets should be viewed as a superset of the village budgets. Informal taxation payments are 7% as large as total district budgets, and 22% as large as district spending on development expendi-tures. This implies that a non-trivial share of all spending on local public goods occurs through the informal taxation mechanism.
Third, we compare informal taxes with the other taxes that are under the control of local government: formal taxes and fees collected by the village and district governments. Table 5 shows that, other than informal taxation, sources of formal tax revenue under direct control of local governments are extremely limited, as most revenue comes from intergovernmental grants from the national government (which administers the VAT and other taxes). Informal taxes are 12 times larger than total village formal taxes and almost triple total district level formal taxes and fees. Informal taxes are therefore –by far –the largest source of …nance that is under local control.
The above …gures present estimates of informal taxes in which labor payments are monetized 1 8
Note that since 2001 was the …rst year of decentralization, districts may have unsure as to the total amount of central transfers they would receive and budgeted conservatively, resulting in a surplus.
1 9
Note that informal taxation payments are not reported in district budgets, so double-counting is not an issue in this comparison.
as described in the previous section. We have also constructed estimates of informal taxes in which labor payments are monetized using the local unskilled wage rate.20 The resulting estimates of per household informal taxes decline only slightly, from 49.86 to 44.30 dollars per year. This adjustment does not substantively a¤ect any of our conclusions about the importance of informal taxes as a local revenue source.
4.2 Distributional Implications of Informal Taxation
This section examines the distributional implications of informal taxation by looking at the rela-tionship between informal taxation payments and household expenditure. We begin by examining the distribution of informal taxation payments within communities, which tells us how the bur-den for …nancing a given level of public goods is borne across high and low income individuals in those communities. Since informal taxation payments are determined at the community level, this within-community analysis is the level of analysis one needs for developing models of informal taxation. We then compare the aggregate burden of informal and formal taxation across the in-come distribution. We do not compare informal taxes directly across communities within country, since the level, type, and quality of public goods provided are likely to vary unobservably across communities.
4.2.1 Informal taxation within communities
We …rst examine the participation margin – i.e., which households make informal taxation pay-ments. We estimate the following conditional logit speci…cation via maximum likelihood:
P PAYc j Hc X h=1 P AYhc=Tc ! = exphPHc h=1P AYhc( LN(EQU IV EXP)hc) i P dc2Scexp hPHc h=1dhc( LN(EQU IV EXP)hc) i (1) 2 0
The local unskilled wage rate is calculated using survey information provided by the village head. We sum the daily wage of a male laborer in the month of the interview in the village/ward with the average value per day of goods provided for consumption while working (if applicable). We then divided by the number of hours worked by laborers on an average day and multiplied by 6 to get the value of labor for a "normal" work day at the village level.
whereh represents a household, c represents a community,P AYhc is a dummy for whether house-hold c made any payments, P AYc is the vector of P AYhc for all households h in community c,
LN(EQU IV EXP) is a measure of log household expenditure per equivalent adult,Tc is the num-ber of respondents in community c who reported any payments, and Sc is the set of all possible vectorsdc=fd1c; :::; dHccgsuch that
PHc
h=1dhc=Tc.21 The key coe¢ cient of interest is , which is the elasticity of the probability of making payments with respect to equivalent household expendi-ture. Robust standard errors in this and subsequent regressions are adjusted for clustering at the community level.
The results are presented in Panel A of Table 6. Each cell in the table reports the coe¢ cient on log equivalent household expenditure ( ) from a separate regression of the form in equation (1).22 The estimated overall participation-expenditure gradient is statistically signi…cantly positive in 6 of the 10 countries in our sample and is never negative and statistically signi…cant. The modal elasticity among all 10 countries in the sample is about 0.2. This demonstrates that the probability of payment is increasing with household expenditure within communities, and this pattern is generally consistent throughout the the countries in our sample.
We next examine the relationship between the quantity of payments and expenditure for coun-tries for which data on the quantity of payments are available. Given the large number of ob-servations with no payments, we estimate this relationship as a …xed-e¤ects Poisson quasi-MLE regression with robust standard errors (Hausman, Hall and Griliches 1984, Wooldridge 1999; see also Wooldridge 2002). This estimates, by MLE, equations such that
E(P AY M EN T AM OU N Thc) = cexp ( LN(EQU IV EXP)hc) (2)
where c is a community …xed-e¤ect, andP AY M EN T M OU N T is the quantity of total payments (in local currency). Given the Poisson QMLE speci…cation, the resulting coe¢ cients can be interpreted as elasticities.
2 1Note that for the Philippines, Albania, Ethopia, Guatemala, and Nigeria, the P AY variable refers to in-kind
labor payments only. For all other countries, theP AY variable captures both monetary and in-kind payments.
2 2
As discussed above, we obtain similar results in this and subsequent speci…cations if we regress contributions on log household expenditure and add as controls dummies for household size (not shown).
To calculateP AY M EN T AM OU N T, we monetize labor payments using the imputed average household wage as described above.23 By allowing the wage to vary with household income, we incorporate the fact that providing a day of labor is more costly for those with high opportunity cost.
The results (Table 6, Panel B) show that total payments are increasing in expenditure in all countries for which we have quantity data, and the coe¢ cients are statistically signi…cant in all cases. The estimated elasticities of informal taxation payments with respect to equivalent expenditure are 0.40 in the Philippines, 0.33 in Albania, 0.13 in Ethiopia, 0.39 in Indonesia, and 0.08 in Vietnam. These elasticities are also strictly and statistically signi…cantly less than 1, indicating that while payments increase with expenditure, the share of household expenditures devoted to informal tax payments (i.e., the average tax rate) is declining with expenditure.24 Payments are also increasing in expenditure even conditional on making a positive informal tax payment (Table 6, Panel C), so the overall e¤ects are driven by the intensive margin as well as the extensive margin.
Together, the results tell a consistent story: within communities, the wealthy pay more in informal taxes than the poor on an absolute level, though they pay less as a share of their total resources.
4.2.2 Comparing formal and informal taxation
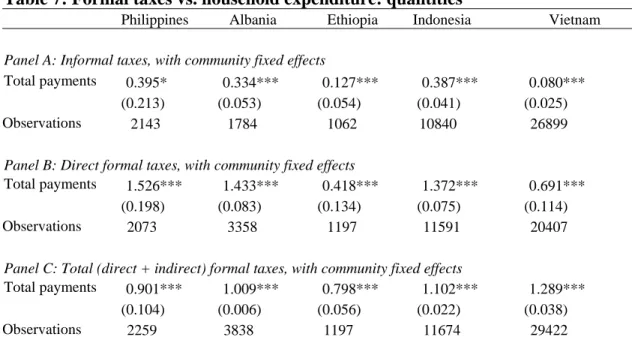
We next compare informal taxes to formal direct and indirect tax payments by households. The results are presented in Table 7. For comparison purposes, Panel A shows the relationship between informal taxes and equivalent household expenditures with community …xed e¤ects. Panel B repeats the same regressions for direct formal taxes, and Panel C repeats the regressions for total direct
2 3
As an alternative, we have considered a speci…cation in which we examine days, rather than monetizing by the wage rate (results not reported). As one would expect, the coe¢ cients examining just days are generally smaller than in the monetized days speci…cation, although the gradient remains positive and signi…cant in Albania and Indonesia and positive and insigni…cant in the Philippines and Ethiopia. The coe¢ cient for Vietnam is negative and signi…cant, which may re‡ect features of the mandatory labor payment system.
2 4
Note that monetizing labor payments at a common rate, rather than at the predicted household wage rate as we do, would make informal taxation appear even more regressive. One might be concerned that measurement error in household expenditure data could cause the estimates to be less than one even if informal taxation is truly progressive. However, applying the classical measurement error attenuation bias formula to our estimates shows that measurement error would have to account for more than 60% of the total variation in observed household expenditures in all countries in order for this to be the case.
and indirect formal taxes.25
The results in Table 7 show that in all countries we examine, the estimated elasticities of formal taxes with respect to household expenditure are greater than the estimated elasticities for informal taxes. For example, the elasticity of formal direct taxes with respect to household consumption Table 8 is 1.526 in the Philippines, 1.433 in Albania, and 1.372 in Indonesia, so that formal direct taxes are progressive in these countries. By comparison, the analogous elasticity for informal taxes is 0.395 in the Philippines, 0.334 in Albania, and 0.387 in Indonesia, so informal taxes are on average regressive. Informal taxes are levied by local governments, whereas VAT and formal direct taxes tend to be levied by state or national governments, so these are not necessarily taxes levied by the same level of government; nevertheless, these regressions are all within community, and the di¤erence in progressivity is substantial. Analogous regressions without community …xed e¤ects produce similar results.
Figure 1 illustrates these di¤erences graphically, plotting informal taxes, direct formal taxes and total formal taxes (i.e., direct + indirect), all expressed as percentages of total household expenditure. For each country, we plot the results of a non-parametric Fan regression (Fan 1992) of each variable against log equivalent household expenditure. These regressions do not include community …xed e¤ects, so they represent average progressivity or regressivity across our entire sample in each country. The solid lines in Figure 1 show informal taxes, the dashed lines shows direct formal taxes, and the dotted line shows total formal taxes. For comparison, we also plot a histogram of log equivalent household expenditure. To keep the graphs readable, we have excluded the bottom 0.5% and top 0.5% of the household expenditure distribution. The most striking fact about these graphs is that the formal tax system is progressive in most countries whereas the informal tax system is regressive. Including informal taxation therefore makes the total tax burden look more regressive than previously thought.
2 5
Note that since formal indirect taxes are imputed by applying VAT rates to di¤erent categories of consumption (see Appendix A), measurement error will bias the coe¢ cients on formal indirect taxes towards 1. In that sense the most meaningful comparisons are between informal taxes and formal direct taxes, both of which are estimated completely independently of household consumption.
4.3 Monetary vs. In-Kind Payments
A notable feature of informal taxation is that payments are often made in labor rather than money (Table 3). To better understand this phenomenon, it is useful to understand in more detail which types of households pay in labor versus money.
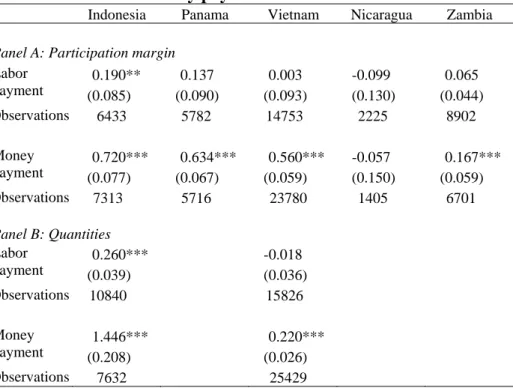
To do so, we re-estimate equations (1) and (2) separately for each type of payment, focusing on the countries for where we have data on both monetary and in-kind labor payments. In the quantity analysis, to be consistent with the previous tables, we continue to value labor payments at the household’s predicted average wage rate. Using days instead of monetized labor payments generally makes the reported estimates for labor smaller and accentuates the di¤erence between labor and money more than shown in the tables here.
The results for the participation margin – does the household pay any labor or any money – are presented in Panel A of Table 8, and the results on the quantity paid are presented in Panel B of Table 8. The results in both panels show a very clear pattern: for almost all countries in the sample, monetary payments increase more quickly with overall household expenditure than in-kind labor payments. This is true both on the participation margin and, for the two countries where we have quantity data, on the quantity margin as well. For example, looking within communities in Indonesia, the elasticity of labor payments with respect to household expenditure is 0.26, but the elasticity of monetary payments with respect to household expenditure is 1.45 (see Panel B of Table 8). This implies that monetary contributions are particularly concentrated at higher income levels, a fact we return to in the theoretical framework below.
4.4 Implications
These stylized facts have several implications for public …nance in developing countries. First, a substantial share of households in many developing countries participate in these mechanisms. Informal taxation can be the dominant source of revenue for local communities and may be a non-trivial component of national spending on public capital improvements in developing countries. Failing to take informal taxation into account will lead to underestimates of the tax burden faced by households, the size of the public sector, and the level of decentralization. Second, informal
taxation is redistributive but regressive, and this pattern is observed in almost all of our sample countries. Formal taxes appear to be more progressive than informal taxes, so estimates of formal taxes alone may result in overestimates of the overall progressivity of the tax system. Finally, a notable feature of informal taxation is that in-kind labor payments are an important source of …nance and are made even by households with relatively high household expenditure. While measuring a household’s true opportunity cost of time is di¢ cult, the …ndings certainly suggest that at least some households are making ine¢ cient payments in labor.
These …ndings also raise a number of questions. Why would communities choose such mecha-nisms of …nance, and why do they tend to be concentrated in developing countries and poor and rural areas? What determines the distribution of payments across individuals within a community, and why do wealthier households pay more than poorer households? Why are in-kind payments so prevalent in informal tax systems when they are rarely seen as part of modern formal tax systems, and why might ine¢ cient labor payments arise in equilibrium?
In the next section of the paper, we provide a framework for thinking about informal taxation. The goal of the model is two-fold: to formalize the trade-o¤s between informal taxation and formal taxation, and to show that the observed prevalence, distribution, and form of informal taxation can be explained by thinking of informal taxation as a solution to a constrained optimal taxation problem.
5
A Model of Informal Taxation
The stylized facts we observe are remarkably consistent across countries. This section develops a simple framework for thinking about informal taxation that does not require non-standard pref-erences, government corruption, or market failures in labor or credit markets, but instead treats informal taxation as one possible solution to an optimal tax problem, with asymmetric information and screening. We discuss alternative models in Section 6.
In our model, local governments face a standard problem: …nancing local public goods in a social welfare maximizing way. We consider three sources of departure from the …rst best. As
in standard taxation models, governments face information constraints about true earnings ability. Our model adds two additional constraints: governments may face constraints on their ability to enforce the desired tax schedule, and they may also face constraints on labor taxes, since individuals can shirk on required labor payments. These information and enforcement constraints limit the degree to which the government can achieve redistribution in …nancing the public good.
We model formal and informal taxes as having di¤erent constraint parameters arising from di¤erences in their tax technologies. In the informal system, enforcement happens through social sanctions rather than through courts. This means that the informal system must use less severe punishments than the formal system, i.e., social sanctions instead of jail time. However, the informal tax system can use information that does not meet the burden of proof required in court (i.e., information that is observable but not veri…able), so it e¤ectively has better information than the formal tax system. 26
We demonstrate that informal taxation may be the optimal solution to the government’s con-strained maximization problem and show that the model’s predictions are consistent with the observed patterns of informal tax prevalence. We also show that the predictions of the model match the stylized facts on the distribution and form of informal tax payments.
Modeling these payments as the equilibrium of a screening mechanism di¤ers from the literature on voluntary contributions to public goods, which often models contributions driven by a personal desire to a¤ect the level of the public good (e.g., Olson 1965), a warm-glow from donations (e.g., Andreoni 1990), or to signal wealth to others (e.g., Glazer and Konrad 1996). others have modeled private provision of public goods in a collective action framework (e.g., Bagnoli and Lipman 1989, Bergstrom, Blume and Varian 1986). Masclet, et al. (2003) and Falk et al. (2005) have emphasized the role of social sanctions as a mechanism through which the free rider problem can be overcome, and Fehr and Gachter (2000) show experimentally that cooperators are willing to punish free-riders even if this is costly for them and even if they cannot expect future bene…ts from their punishment
2 6
Another possible constraint on redistribution is exit from the local community. Exit would a¤ect both formal and informal taxes in the same way, so for simplicity, we do not consider the issue of exit here. In practice, mobility is often low in developing countries (Bardhan 2002). Abramitzky (2008) explores the issue of exit as a constraint on redistribution in a di¤erent context, that of Israeli kibbutzim.
activities.27 To the best of our knowledge, little work has focused on formally modeling informal tax mechanisms speci…cally. An exception is Wilson (1992), who argues that cooperation in a repeated prisoner’s dilemma game may be sustainable in the context of harambee programs in Kenya.
This section proceeds as follows. We begin in section 5.1 by setting up the general social planner’s maximization problem as a two-type screening model with enforcement and information constraints and discuss characteristics of the general solution. We then introduce informal and formal taxation in the context of this model by varying the enforcement and information constraints. Section 5.2 discusses the implications of the model for the empirics of informal taxation.
5.1 Model
5.1.1 Setup
Suppose that there are N individuals. A fraction of the individuals have wage wH and a frac-tion 1 have wage wL where wL < wH. We assume that w is private information and that each individual has an endowment of time 1 which they spend working. Since we are primarily interested in the tradeo¤ between enforcement and information, we model all behavioral responses coming through an evasion decision rather than through a labor supply decision. This assumption seems plausible in the contexts we are studying, and also allows us to capture the idea that local communities may have information on earnings ability rather than just earnings. Each individual’s wealth is therefore equal to his wage rate. There are no savings, so individuals consume their entire wealth after paying any taxes.
Each individualican potentially consume two goods, the private good (wi) and the public good (g). If the public good is provided, all individuals consume it andg= 1; if it is not provided, then
g= 0. We assume that utility over the private good is concave and that the utility from the private 2 7
On the empirical side, the lower public good provision in ethnically diverse communities has been explained using the theory of social sanctions: Miguel and Gugerty (2005) argue that social sanctions are harder to enforce between di¤erent ethnic groups, which explains the lower contributions to public goods in diverse communities. Alesina et al. (1999) also show empirically that more diverse communities have lower public good provision.
and public good are separable, i.e.
U =u(wi) + g
where u is concave and indicates the value from consuming the public good. We assume that u
has the property that the coe¢ cient of relative risk aversion is greater than1(i.e., wuu0(00w()w) >1).28 The public good costs Gto produce, and once produced is both non-rival and non-excludable.
G is determined exogenously.29 For the public good to be provided, total government revenue R
must be greater than or equal toG. We assume that providing the public good is e¢ cient, so that the …rst-best involves providing the public good.
We assume that the goal of the government is to …nance the public good in a way that maximizes social welfare. Taxes cannot be negative; in other words, redistribution occurs only through progressive payments toward the public good.30
Taxes can potentially be levied in two forms: money and labor. De…ne H and L as the monetary payments from the high and low type. De…ne H and L as the labor payments from the high and low type, de…ned as a share of each type’s total time budget. After-tax income for type iis then wi(1 i) i.
We assume that i is publicly valued at the low type wage rate wL, i.e., is always used for low-skill tasks. This implies that labor by the high type is ine¢ cient, since it is valued at the opportunity cost wH by the high type but valued at wL in the government budget constraint. As we show below, this asymmetry in the value of labor means that the government can use labor as 2 8This assumption guarantees a single-crossing property which is necessary to allow screening using labor taxes
( ), discussed in more detail below. To see this, note that
@2U
@ @w = wu
00(w) u0(w)
If wuu0(00w()w) >1, then
@2U
@ @w >0, so that the marginal utility cost of an extra hour worked is strictly increasing in wealth.
2 9We focus here on the decisions made by local government trying to raised a …xed amount of revenue to …nance
a public good, abstracting from intergovernmental transfers and endogenous public good size.
3 0In a system where a large share of payments take the form of in-kind unskilled labor, positive net transfers (i.e.,
net receipt of unskilled labor) could be di¢ cult to implement. In addition, we can observe only payments (either zero or positive) to the public good in the data. General transfer payments, if any, may occur through a di¤erent mechanism. In this respect, we can think of informal taxation as somewhat analagous to a property tax system (a tax levied to …nance a set of goods) that may exist in addition to a traditional income tax and transfer system.
a screening device.31
We assume that the social planner faces three types of constraints in designing the optimal allocation. First, there is theenforcement constraint: if a given type fails to pay his required taxes, the planner can impose a utility punishment up to a maximum ofP. This punishmentP enters the planner’s problem as an IR constraint. Second, there is thehidden income constraint: by paying a utility cost D, a high type can hide his income and pretend to be a low type. Third, there is the shirking constraint: by paying a utility cost S, the type who is supposed to do the higher amount of work in labor can shirk and do only the lowest amount of labor required of any type (denoted ).32 The hidden income and shirking constraints enter the planner’s problem as IC constraints. Together, the triplet of costs, (P; D; S), is what we refer to as the technology of the tax system. We will model informal vs. formal taxation as having di¤erent tax system technologies.
5.1.2 Planner’s problem and characteristics of the solution
Faced with a given tax technology (P; D; S), the social planner’s problem is to maximize social welfare subject to the enforcement (IR), hidden income (IC), and shirking (IC) constraints, i.e., he solves:
max
( i; i)
(u(wH(1 H) H)) + (1 ) (u(wL(1 L) L)) + (3)
subject to the enforcement constraints (IR):
u(wH) P u(wH(1 H) H) (ECH)
u(wL) P u(wL(1 L) L) (ECL)
3 1
While use of labor as a screening device has been considered in the design of income maintenance programs (e.g., Besley and Coate 1992), it has not, to the best of our knowledge, been considered in the context of raising revenue.
3 2Note that hiding income allows the high type to pretend to be the low type and pay the labor and money taxes
required by the low type, whereas shirking allows each type to do the minimum amount of required labor without a¤ecting the monetary taxes.
hidden income constraints (IC):
u(wH(1 L) L) D u(wH(1 H) H) (HIH)
u(wL(1 H) H) D u(wL(1 L) L) (HIL)
shirking constraints (IC):
u(wH(1 ) H) S u(wH(1 H) H) (SCH)
u(wL(1 ) L) S u(wL(1 L) L) (SCL)
the government budget constraint:
( H +wL H) + (1 ) ( L+wL L) =
G N
and non-negativity constraints:
i 0, i 0 8i
Note that in the …rst best (when no constraints bind), the planner will set taxes so that the after-tax marginal utilities are equal for the two types; if the non-negativity constraint binds, the optimum in the …rst-best will be to set L= 0 and H = GN.
Several comments are worth making about the general solution to this problem. We …rst examine the form of tax payments of each type and then discuss the distributional implications.
Remark 1 The high type will always pay in money, not in labor.
Proof. All proofs are given in Appendix B.
The fact that the high type always pays in money, not labor, is the equivalent of the "no distortion at the top" result from the optimal tax literature (Mirrlees 1971). Note that this is not simply a productive e¢ ciency result; as we discuss below in Section 5.3, it can be optimal to have
low types make ine¢ cient payments in labor, but it will never be optimal to have the highest type do so.
The shirking constraint determines the degree to which labor can be used as a screening device and therefore the form of payment of the low type:
Remark 2 As the utility cost of shirking(S)increases, the low type’s taxes will weakly shift towards taxes in labor, i.e., @
wL L
WL L+ L
@S 0, with the inequality strict whenever ECH does not bind and L>0.
Since an hour of the low type’s labor is publicly valued at the low type’s outside wage rate, having the low type pay in labor does not a¤ect the government budget constraint. It does, however, allow for screening by a¤ecting the high type’s hidden income constraint: it would now cost the high type more in foregone income if he were to deviate to the low type’s tax package and pay labor instead of money. As long as ECH is slack (in other words, as long as it is possible to increase the tax payment of the high type without violating his IR constraint), then shifting the low type toward labor will allow the planner to improve social welfare.
If the shirking constraint for the low type does bind (from Remark 1, we know that = 0 at the optimum), then there are limits to the degree to which labor can be used as a screening device. In this case, L could be positive, and the inability to screen using labor could reduce the overall progressivity of the tax system or make it no longer optimal to provide the public good. Note that if instead the required labor was high skilled (could only be provided by the high type), there would be no screening bene…t from labor taxes. One implication is that such projects are less likely to take place.
We next examine the distribution of payments:
Remark 3 As long as the planner has some information (either D > 0 or S > 0) and P > u(wH) u wH NG , then if the public good is provided, total payments will be strictly increasing in household expenditure, i.e., it will always be the case that H +wH H > L+wL L:
system will be redistributive –i.e., the high type will pay more in taxes than the low type.33 This result comes directly from the fact that the planner is maximizing social welfare and the marginal utility of income is higher for the low type. The di¤erence in tax payments between the two types is weakly increasing in the wage gap between the two types.
The fact that the high type pays more does not necessarily imply that the tax system will be progressive –i.e., it does not imply that the high type will pay more in taxes as a share of income than the low type. In fact, whether the tax system is progressive or regressive is theoretically ambiguous and depends on the parameters of the model.
It is also important to note that while the utility costs (P; D; S) represent a social loss, none of these costs should be borne in equilibrium. E¢ ciency costs relative to the …rst best instead take two forms. First, the public good may not be provided whereas it will always be provided in the …rst best. This may occur if the government cannot satisfy the enforcement and information constraints and still meet its budget constraint or if redistribution is limited enough that providing the public good actually reduces social welfare. Second, in a multiple type case, it may be optimal for the government to require ine¢ cient labor payments from individuals whose wage rate exceeds the unskilled wage rate, since those labor payments serve as a screening device for higher wage types. We discuss extensions to the multiple type case in more detail below.
5.1.3 Formal vs. informal taxes
We model formal and informal taxation as having di¤erent technology triplets. Formal taxes are thus represented by the triplet (PF; DF; SF) whereas informal taxes are represented by the triplet(PI; DI; SI). We assume that PF PI – i.e., the punishments that can be imposed by the courts, conditional on detecting non-compliance, are at least as great as the punishments that can be imposed informally through social sanctions.34 By using the formal legal system, the social 3 3We monetize labor payments by the high type using the high type’s wage rate, since this measure is most relevant
for considering the distribution of tax burdens.
3 4Note that social sanctions must be levied by individual community members, not by the social planner directly.
However, we can think of the social planner as coordinating the community on a particular equilibrium by choosing the schedule of social sanctions to be implemented by the community. If each individual in the community’s cost of enforcing a social sanction on someone else is less than the cost of receiving a social sanction themselves, there is an equilibrium where everyone in the community enforces the social sanction on non tax payers, as well as enforces
planner can in theory levy an unlimited punishment if the individual does not meet his required payments (for example, through imprisonment); in the informal tax system, there are likely to be limits on the sanctions that can be imposed for non-payment. We can think of the costs of evading income(D)or evading labor taxes(S)as inversely related to the information the community needs to impose punishment. A conviction in the formal legal system is likely to require a higher level of proof than a community needs to impose informal punishments, which implies that DF DI and SF SI. The choice between formal and informal taxation thus entails a trade-o¤ between enforcement (P) and information(Dand S).
Considering a limiting case may be useful for intuition. AsPF ! 1andDI! 1, formal taxes are limited by the IC constraints (hidden income and shirking) whereas informal taxes are limited by IR constraints (punishments). Note that there are two potential sources of informational advantage in the informal system: communities e¤ectively have more information about true earnings ability and they are better able to monitor labor payments. Either of these advantages is su¢ cient to generate the result that informal taxation may be preferable to formal taxation; we believe both are relevant in explaining the observed stylized facts, as we discuss below.
5.2 The informal tax framework and the stylized facts
5.2.1 The choice between formal and informal taxes
It is straightforward to see that loosening any of the constraints faced by the local government will weakly allow it to achieve higher social welfare. This framework therefore suggests that informal taxation is likely to result in a social welfare improvement relative to formal taxation when: (1) the ability of the community to levy social sanctions(PI)is high; (2) there is more available information about incomes informally than formally(DF < DI); and (3) the ability to monitor labor payments informally is greater than the ability to monitor formally (SF < SI).
The prevalence of informal taxation throughout our sample of developing countries, particularly
the social sanction on anyone who deviates and does not enforce a social sanction when they are supposed to do so. Perroni and Scharf (2007) note thatany tax schedule must ultimately be sustained by the collective willingness of the group to enforce the schedule, and Fehr and Gachter (2000) discuss the willingness of individuals to punish free riders even if such punishments are costly.
in rural areas, is consistent with the existing evidence that informal insurance and credit markets may function more e¤ectively in rural areas, where information is better and villagers are better able to levy informal sanctions for default (Townsend 1995, Besley and Coate 1995, Banerjee and Newman 1998, Ghatak 1999). The ability to verify income legally may also be more di¢ cult in developing countries, since many individuals work in or can easily shift into the informal sector.35 Unsurprisingly, informal taxation mechanisms are not generally observed in developed countries, where it is harder to hide income and where social sanctions may be less e¤ective.36
Our model has considered the choice between formal and informal taxation made by a given local government. Even within developing countries, information and social enforcement are likely to be e¤ective within small communities. This is consistent with the observation that informal taxes tend to be levied at local levels, rather than by higher levels of government.
The framework also clari…es why labor payments are more commonly observed in informal taxation systems rather than in formal tax systems. Although labor payments are always desirable as a screening device, they are also likely to be hard to verify legally. Therefore, the community can more easily make use of labor payments as a screening device through the informal system. Note that labor taxes are sometimes implemented through the formal tax schedule. Systems of corvee labor, for example, were common at one time in Europe and elsewhere, and mandatory labor taxes still exist in some countries, such as Vietnam. It may be that in at least some of these contexts, local landlords or o¢ cials did not have to meet the burden of proof required by a court in order to punish non-compliers, resulting in a highSF.37
5.2.2 The distribution and form of informal taxes
The informal tax model makes a number of predictions about the distribution and form of informal tax payments. As discussed above, the framework suggests that informal tax payments should be 3 5Similarly, while landholding may be legally veri…able in theory, land taxes in developing countries have also
proven di¢ cult to implement in practice (Burgess and Stern 1993).
3 6As noted in the introduction, however, such systems can arise even in countries like the United States in situations
in which formal taxation is limited.
3 7A number of studies have documented substantial absenteeism in sectors such as health and education in
devel-oping countries (e.g., Banerjee and Du‡o 2006), which suggests that the e¤ectiveness of formal public works projects may be constrained by shirking as well.
increasing with household expenditures. We …nd that the elasticity of total payment with respect to household expenditure is positive in all countries (shown in Table 6), consistent with the prediction of the model. Moreover, in the simple two-type case, it will be optimal for the public good to be …nanced solely by the high types if income inequality is su¢ c