3Department of Economics, Iowa State University, Ames, IA 50011 (phone: 515-294-8107;
fax: 515-294-0221; e-mail: [email protected]).
In this paper, we argue that (bilateral) auctions of production quotas induced a rapid convergence in dairy farm size within provinces in the early years of Canada’s supply management policy and that this effect was stronger in provinces with a larger number of dairy farms. This contributed to the smallness and homogeneity of Quebec dairy farms relative to dairy farms in Western Canada. In Quebec, most dairy farms still rely on the tie-stall milking system, while dairy farms in Western provinces are larger and use larger-scale, lower-cost technologies. Regulations on Quebec’s quota exchange have slowed down the pace at which a farm can acquire production quota, exacerbating the effects of input lumpiness, on dairy farm efficiency. Low trading on the production exchange severely constrains production adjustments, making, scale, allocative, and technical inefficiencies more persistent and investment in herd expansion unprofitable.
Dans cet article, nous avanc¸ons que les m´ecanismes permettant l’´echange de quotas de production ont engendr´e une convergence dans la taille des troupeaux laitiers, surtout dans les provinces o`u le nombre de fermes est ´elev´e. Cela a contribu´e `a l’homog´en´eit´e et `a la petite taille des fermes laiti`eres qu´eb´ecoises par rapport `a celles dans l’Ouest canadien. Les fermes qu´eb´ecoises utilisent en majorit´e un syst`eme de traite de stabulation entrav´ee alors que les fermes de l’Ouest canadien utilisent des technologies qui entraˆınent de plus bas coˆuts mais aussi production `a plus grande ´echelle. La r´eglementation du m´ecanisme d’´echange de quotas de production a contribu´e aux difficult´es des producteurs `a augmenter leur quota de production et `a l’amplification des effets de non-divisibilit´e des intrants sur l’efficience des fermes. Les faibles volumes ´echang´es ont diminu´e la capacit´e des fermes `a ajuster leur production, contribuant ainsi `a la persistance d’inefficiences technique, allocative et d’´echelle et aux difficult´es `a abandonner la stabulation entrav´ee.
INTRODUCTION
A supply management (SM) policy governs the Canadian dairy sector since the early 1970s. The policy revolves around a national production quota, based on costs of produc-tion and estimated domestic demand, which is allocated to provincial marketing boards responsible for the marketing of milk within provincial borders. By restricting supply,
Canadian Journal of Agricultural Economics 65 (2017) 613–641 DOI: 10.1111/cjag.12156
Canada’s SM dairy policy enables large transfers from consumers to dairy producers, dairy product manufacturers, and other agents along the dairy supply chain. To gauge how large the transfers to producers are, we can rely on the 2016 Organisation for Eco-nomic Co-operation single commodity transfers (SCTs) which measure the importance of monetary transfers from consumers and taxpayers relative to gross farm receipts for a specific commodity. For milk, Canada’s SCT is 44%, well above the SCTs of the United States (13%) and the European Union (EU) (5%). In these countries, support is provided by dairy programs funded by taxpayers. Canada’s support for its dairy industry also stands out when compared to its support for other productions, like pig meat (1.6%),
Canola (2.7%), poultry (2.9%), and even eggs (33%).1The maintenance of high
domes-tic prices requires a strict control of competing cheaper imports. This is accomplished through restrictive tariff-rate quotas (TRQs) which impose a low tariff rate on a small import quota while imports in excess of the quota are taxed at a high tariff rate. In fact, the
overquota tariff rates are prohibitively high and overquota imports cannot be profitable.2
Diafiltered milk, known as ultrafiltered milk in the United States, did not exist when Canada drafted its import control list. Duty-free imports of diafiltered milk created a breach in Canada’s strategy to prevent imports from reducing the demand for milk on the part of cheese manufacturers. A second breach has just been created with the implementation of the Canada-EU Comprehensive Economic and Trade Agreement
(CETA). A gradual enlargement of cheese import quotas is being implemented.3 The
first breach was dealt with by introducing a new milk class (Class 7) in provincial milk
pricing grids to price out imported diafiltered milk.4 U.S. authorities are likely to file
a World Trade Organization (WTO) complaint about Class 7, but for the time being Class 7 should contribute to growth in Canadian milk production. The government response to the second breach is the recent announcement of two new programs, the dairy farm investment program and the dairy processing investment fund. The former is a cost-share program that will provide up to $250,000 per farm to support investments in productivity enhancements. The implementation of an eventual North American Free Trade Agreement (NAFTA) 2.0 will most likely open another breach since Canada had agreed to concessions of roughly 3% of its domestic markets for SM products in the failed Trans-Pacific Partnership (TPP).
1Source http://www.oecd.org/tad/agricultural-policies/producerandconsumersupportestimates
database.htm#country.
2In the case of cheese imports, the import quota amounts to roughly 5% of the domestic
consump-tion. These within-quota imports are taxed at $0.04/kg (less than 1%), but any overquota imports would be taxed at 245%. Imports of other dairy products, like ice cream and yogurt, are taxed in a similar fashion.
3The EU currently has two-thirds of the 205,000 tons/year import quota. Cheese imports will
increase to 36,500 tons/year by 2022.
4Class 7 allow Canadian dairy manufacturers to purchase at low prices skim milk components
to manufacture dairy ingredients to displace imports of diafiltered milk. Canadian dairy farmers receive roughly $40/hectoliter (hl) for milk going into milk 7, which is much lower than what they get for milk going into Classes 1–5 according to the Canadian Dairy Information Center (2015). Cheese manufacturers remain constrained by compositional standards that impose floors on the quantity of fresh milk to be used in the production of cheese. See Felt et al (2012) for an economic analysis of these standards.
Colombia and Alberta the proportions are 4% and 10%. Moving from one milking system to another is costly because it entails investing in building, machinery, equipment, cows, and production quota.
A significant increase in the demand for butter and speciality and cheddar cheeses in 2016 has provided impetus to on-farm investment. The recent upturn in the demand for dairy products induced emissions of additional production quota for all dairy farmers. Since producers have incentive to equate herd size to barn capacity, some producers had to decide between investing in new production capacity or to sell production quota. One farm invested $2.2 million in milking robots and production quotas to increase
production from 100 kg/butterfat (bf)/day to 200 kg/bf/day.6 Province-wide, Quebec
dairy producers reportedly invested over $550 million in new buildings, machinery, and equipment in 2016 (Le Producteur de Lait Qu´eb´ecois 2017). This is a major turn of events because in 2011, two Quebec dairy farmers who had made large investments to increase their production capacity were facing bankruptcy because they did not own enough production quotas to operate at a profitable scale. In the end, these farmers received, exceptionally, a priority of purchase (La Terre de Chez Nous 2011). The announcement of the dairy farm investment program has added to the investment momentum. It remains to be seen whether the program will favor switching to more efficient milking systems or expansions of tie-stall operations.
The small size of Quebec dairy farms makes them particularly vulnerable to greater import penetration or a potential phasing out of the SM program. Without a structural change in the Quebec dairy industry, the competitive position of Quebec dairy farmers can only erode over time, making the SM policy increasingly costly and difficult to modernize or replace. In this paper, we shed light as to why Quebec dairy farms evolved the way they did and why it is so difficult to get out of what could be construed as a technological trap. We argue that SM and the tradability of production quotas have had a profound impact on the evolution of dairy industry in Canada. The ability to exchange production quotas has made farms more homogeneous as average cost differences arising from
5The average herd in Quebec is slightly over 60 cows, while in the United States it is 183 cows.
There is also an animal welfare argument for switching away from the tie-stall system. Several jurisdictions, like Norway, have banned the construction of new tie-stall dairy barns (Barkema et al 2015).
T ab le 1 . C anadian d airy far m s b y m ilking system type a nd b y pr o v ince Tie stall F ree stall R obotic system # of far ms Ann u al her d incr ease % Pr o v ince % o f far ms Av e. h er d siz e % of far ms Av e. h er d siz e % of far ms Av e. h er d siz e 2014 2002 2002–07 2008–14 British Columbia (BC) 3 .7 56.3 8 7.4 163.9 8.8 113.0 455 691 4.34 4.81 Alberta (AB) 9 .7 79.7 8 1.0 148.2 9.2 136.3 566 820 2.83 2.75 Saska tche w an (SK) 10.9 77.2 8 2.2 192.8 6.9 144.1 166 318 4.65 5.57 Manitoba (MB) 34.6 78.3 4 9.2 186.5 16.2 168.7 308 583 6.18 5.05 Ontario (ON) 68.0 57.4 2 6.4 127.3 5.6 101.7 3,926 6,013 2.14 1.25 Quebec (QC) 88.9 54.6 6 .4 112.2 4.7 9 8.1 5 ,894 8,502 1.43 0.63 Ne w Bruns wick (NB) 43.3 57.4 5 1.2 117.1 5.5 7 2.6 206 302 2.68 1.8 No v a Scotia (NS) 45.0 54.5 5 2.3 109.1 2.8 110.3 229 345 2.2 2 .74 Prince Ed w a rd Island (PEI) 59.1 64.2 3 7.5 104.0 3.4 194.3 180 316 2.05 2.54 Ne wf oundland & La br ador (NL) 20.0 103 60.0 161.3 20.0 106.0 32 41 11.75 2.72 All C anada 71.7 -22.7 -5 .6 9,429 Sour ce: C anadian D airy Inf o rm at ion Center (2015). Boldfaced v a lues re fer to Q ue bec d at a.
like barn size can severely constrain the profitability of a dairy farm expansion. In Quebec’s supply managed dairy industry, the limited availability of production quotas has been a severe hurdle to increases in production capacity and the adoption of more competitive milking technologies. Some inputs are lumpy, in the sense that they are available in few
discrete quantities that may not match the farmer’s desired quantity.8 We show that
output adjustments are critical to maintain scale, allocative, and technical efficiencies. Surprisingly, the interaction effect between regulations and input lumpiness is a source of technical inefficiency that previous studies do not recognize. By themselves, regulations restricting production adjustments affect only on a farm’s ability to operate at an efficient scale that exhausts all economies of scale. A scale-inefficient farmer still has incentives to adjust its input mix in relation to changes in inputs prices (allocative efficiency) and to get the most from all of the inputs (technical efficiency). Similarly, by itself the lumpiness of certain inputs (e.g., milking equipment, machinery, hired labor) should affect primarily allocative and scale efficiencies, limiting a farmer’s ability to adjust its mix of inputs in relation to changes in input prices and forcing output adjustments. However, we show that the combination of restrictions on production adjustments and input lumpiness induces a pattern of technical inefficiency characterized by a jump followed by a correcting phase. Inefficiency scores from an input-distance function estimated using an unbalanced panel of Quebec dairy farms support this hypothetical pattern. The decomposition of technical inefficiency accounts not only for the policy effects, but also for the more traditional sociodemographic variables and regional effects (Singbo and Larue 2016).
Our findings have important policy implications. First, SM policies have limited the capacity of farms to expand, especially in the east, resulting in a significant east– west differential in farm size. The implication is that adaptation to a more liberalized
7A double auction is an auction mechanism through which sellers and buyers simultaneously
announce their respective asks and bids which are then used by an auctioneer to call a clearing price. Buyers whose bid was weakly higher than the clearing price pay that price and sellers with asks that were weakly lower than the clearing price get to sell their products at that price.
8Input lumpiness is a common problem that is especially acute in the brewing business as the
popularity of canned beers is increasing. Canadian brewers source their cans from two U.S. suppliers, Crown Holdings and Ball Corporation. The minimum order of aluminum cans is 149,376 (24 pallets of 6,224 cans), a “tall order” for microbrewers. See http://plus.lapresse.ca/screens/96e03096-6703-4c5c-84ec-21a8ce6b34bc%7C_0.html.
trading environment will be much more difficult on small eastern dairy farms than on larger western dairy farms that operate at a more cost effective scale. Second, current regulations limit the trade of quotas in Quebec and the ease with which output can adjust. This magnifies the inefficiencies arising from input lumpiness, deters investments in lower cost technologies requiring larger scale of production, and makes any transition to a more liberal trading system all the more difficult. The takeaway is that it is imperative to improve the SM policy and make Quebec’s dairy farms more competitive now, as we begin implementing CETA and might be implementing new NAFTA provisions in the near future. With more Quebec dairy farms operating at scales comparable to U.S. dairy farms, a SM phase-out will become politically more feasible.
The first section discusses Canada’s SM policy and studies about the performance of Canadian dairy farms. Scale inefficiency is the object of many studies, but none dwells on the theoretical link between policy, regulations, and technical inefficiency and none look for policy-induced inefficiencies when conducting empirical analyses. The second section presents the econometric model while the third section presents our empirical results. The last section dwells on the implications of the results for federal policy makers, provincial regulators, and dairy farmers.
REGIONAL DIFFERENCES IN FARM SIZE
Table 1 shows substantial differences in average farm size for different milking systems. Removing the highest and lowest entries, the range in average herd sizes for the tie-stall, free stall, and robotic milking systems are, respectively, 55–80, 109–187, and 98–168 heads. The tie-stall system has been around for a long time and it is particularly well suited for small herds. Larger dairy farms have abandoned the tie-stall system because it is too labor intensive. An Iowa farm survey shows that investment in a low-cost milking parlor typically entails a jump in herd size, from an average of 73 cows to an average of 112 cows, to secure increases in labor productivity (Bentley et al 2012). Table 1 highlights substantial differences across provinces about the relative popularity of each milking system. Almost 89% of Quebec’s dairy farms and 68% of Ontario’s dairy farms are tie-stall farms while only 3.7% of farms use this milking system in British Columbia. It is also clear from Table 1 that Quebec and Ontario farms tend to be small relative to Western Canadian farms regardless of the milking system. It is also apparent in Table 1 that growth in herd size has been much slower in Quebec and Ontario.
Adoption of a new technology like a new milking system by a farm corresponds
to a move from one cost function to another, like average cost functions AC1 and AC2
in Figure 1. Recent technological advances have given rise to different types of milking
parlors suitable for different herd sizes.9However, when Canada’s SM policy was designed
in the 1960s, there were fewer technological choices and most farms were very small. Let
us assume that all farms were operating along the AC1and MC1cost curves in Figure 1.
9The envelope of these cost curves is L-shaped according to Mosheim and Lovell (2009). Thus,
there is apparently a minimum efficient scale at a herd size between 1,000 and 2,000 heads. This scale of operation is almost nonexistent in Canada implying that there are significant economies for Canadian dairy farms to exploit. Fair Oaks farms in Indiana has a 30,000-cow herd and mega dairy farms have been recently built in China in response to the Russian ban on dairy imports from the EU.
Figure 1. Technological jumps and farm homogeneity
The SM policy constrains production on individual farms, but it allows for the trading of production quota units within provinces to allow farmers with higher marginal valuations to buy from farmers with lower marginal valuations, hence favoring efficiency. Consider a farmer who has A units of quota and a second farmer who has C units of quota, where each quota unit is equivalent to the milk output of a single cow. These farmers have incentives to trade. The farmers’ respective quota rents or valuations for a block of
B-A =C-B units are given by the area between the price and their marginal cost. In
Figure 1, the farmer with A units of quota has an incentive to increase production to B to exploit economies of scale. The other farmer has an incentive to downsize to operate at a more efficient scale at B. If allowed, the two farmers would trade and would end up with the same herd size. An unregulated system where farmers are free to trade their quotas favors efficiency. Elskamp and Hailu (2017) show empirically that policies capping quota prices in the Ontario dairy industry slowed down quota transaction between inefficient and efficient dairy farms.
Production quota transactions occur on provincial exchanges and some gather a very large number of participants (1,000–2,000) while others are very small (sometimes fewer than five participants). If scale effects have a strong incidence on costs of production, then the tradability of production quotas under SM encouraged convergence in herd size in the early years of the policy when the number of dairy farms in each province was much larger than what it is today. In the short run, under a single production technology, farmers’ valuations for production quota became similar as differences in quota valuations were quickly arbitraged on efficient provincial exchanges months after month. In the longer run, with the introduction of new production technologies, dairy farmers were willing to make new investment to increase production and operate at a more efficient scale. However, the homogeneity in valuations made provincial exchanges increasingly one-sided as most farmers, wanting to expand, were short of quota. Moreover, the fixed volume of quota attributed to each province and the slow expansion of the total meant that small quantities of new quotas were introduced. The number of transactions was small in the 1980s and early 1990s and the bulk of production quota put up for sale came from retiring farmers. Lambert et al (1995) report that only 3–4% of Ontario and Quebec provincial quota was traded in 1990. Lane and Brinkman (1988) reported that 80% of the quota units put up for sale in Ontario were from retiring farmers.
Entry was difficult even in the early years of the SM policy and this contributed to the homogeneity of dairy farms and the rate of decline in the number of dairy farms. Romain and Sumner (2001) pointed this out when comparing average herd sizes for Canada, the United States, California, and Quebec. They noted that the average herd size in Canada and in the United States was about the same in 1976, but that the average herd size in the United States began to grow much faster than in Canada from the mid 1980s until 2000. Interprovincial trade in production quota is generally banned and differences in average herd size across provinces became more noticeable. Interprovincial quota trading between Quebec and Ontario took place during a few months in 1997 and 1998, and it was put to an end because large quantities of quota were leaving Ontario. At the time, the average herd size in Ontario was 25% larger than that in Quebec. Schmitz (2008) observes that this outcome was predicted by Lambert et al (1995) who estimated supply and demand functions for production quota in Quebec and Ontario to make an inference about the pattern of trade. Lambert et al (1995) show the importance of scale effects and returns from nondairy production in explaining the valuations of production quota.
Quebec dairy farms were not always smaller. The average Quebec dairy farm was larger than its counterpart in the rest of Canada in 1976 (29 cows vs. 24 cows). But, it has since grown at a slower rate, reaching 46 cows by 2000 while the average herd in the rest of
Canada had 57 cows then (Romain and Sumner 2001).10Domestic growth in production
was slow in all provinces, but less so in Western Canada. Asymmetry in population growth motivated the switch in the allocation of Market Sharing Quota (MSQ) for industrial milk in 2000 from the 90-10 rule, which granted 90% of a MSQ increase based on a province’s historical MSQ share and 10% based on the province’s share of the Canadian population,
to the 10-90 rule.11Milk production in British Columbia, Saskatchewan, and Manitoba
grew by more than twice the rate observed in Quebec and Ontario between 1996 and 2013 (16–19% vs. 7%). Thus, there was a relatively greater availability of production quota in Western Canada than in Quebec and Ontario.
The gap in average size between provinces has widened considerably over time and restriction on the trade of production quotas across provinces played a role. In provinces where the number of dairy farms was large, like Quebec and Ontario, the homogeneity in valuations made the price of quota more stable, but it also created a large difference between the number of buyers and sellers. As a result, production quota put up for sale by farmers exiting the industry was divided up among a large number of scale-inefficient bidders with similar valuations, making production expansion a lengthy process. Fur-thermore, various regulations have exacerbated the problem. In Quebec, the volume of
quota that a producer can buy is limited to no more than 10% of its quota endowment.12
10There were 122,914 dairy farms in Canada in 1970, compared to 14,660 in 2006 (Canadian
Dairy Information Center 2015) and this rate of decline is the same as that of the United States. MacDonald et al (2007) report that there were 648,000 dairy farms in the United States in 1970 and that only 75,000 were left by 2006.
11The Domestic Dairy Product Innovation Program also helps provinces where new products are
developed to keep the increase in quota due to market development. For more details, see p. 2 of http://www.dfns.ca/Vol12No9.pdf.
12See section VII, paragraph 30 of the R`eglement sur les quotas des producteurs de lait(http://legisquebec.gouv.qc.ca/fr/ShowDoc/cr/M-35.1,%20r.%20208).
Figure 2. Prices (a) and volume traded (b) on Quebec’s production quota exchange
Thus, it is more difficult for small, scale-inefficient producers to acquire larger volumes of quota. Starting in 2007, Quebec’s marketing board imposed a price ceiling and it has been retaining a fraction of all quota units sold to constitute a reserve to help beginning farm-ers. The volume of quota traded declined following the gradual decline in price ceiling to its CAD$25,000/kg/day target as shown in Figure 2. The price ceiling censors high bids and prevents the market from efficiently allocating quota units to farmers who could get the highest returns from owning them. Production quotas in Quebec were sold at prices in excess of CAD$30,000/kg/day in 2006 prior to the price ceiling era. In a recent paper, Chernoff (2015) estimated that the price of quota in 2010 in Quebec would have been
CAD$32,000/kg without the price ceiling, which is indicative of severe rationing.13 A
Figure 3. Number of buyers and sellers involved in production quota trades in Quebec
price ceiling is also in effect in other P5 provinces and its adverse welfare effect in Ontario has been documented by Cairns and Meilke (2012).
The difference between the numbers of buyers and sellers in Quebec’s quota exchange in Figure 3 shows how difficult it is for a Quebec dairy farm to acquire additional produc-tion quota. There was already a tremendous difference in the number of buyers and sellers before 2007 when Quebec’s marketing board introduced a price ceiling. Transactions on the Quebec exchange can take place only if there is enough production quota offered for each buyer willing to pay the transaction price (i.e., the ceiling price in the last five years) to get a minimum of 0.1 kg/day (about 10% of a cow’s production). This condition was not met one-third of the time in 2014 and this is why there were no sales recorded for four months in 2014. During 2014, there was on average 260 kg/day distributed on any given month to an average of 2,300 buyers. At an average quota purchase of 0.11 kg/day per buyer, the addition of a single cow to a herd requires over eight monthly purchases. All else equal, this implies that the transition of a tie-stall 55-cow farm to a free-stall 120-cow farm would take almost 48 years. Fortunately, the demand for milk has increased in 2016 and this offsetting effect has allowed some farmers to embark on expansion projects.
compare it to unrestricted quota prices prevailing at the time. In BC, 2010 quota prices hovered around $38,500/kg. Alberta prices varied between $34,000/kg and $38,000/kg while in Manitoba and Saskatchwan quota prices varied between $27,000/kg and $33,000/kg and $23,000/kg to $33,000/kg. The 2017 quota prices in BC fluctuate around $42,000/kg, while in NB there were sales below the $24,000/kg ceiling.
as much as 20 kg/bf/day in a single transaction.
INPUT LUMPS, TECHNOLOGICAL JUMPS, AND EFFICIENCY
Since their adoption, Canada’s SM programs have been criticized for imposing deadweight losses and too large a burden on consumers, for being regressive, for segmenting the Cana-dian market, and hence limiting the gains from interprovincial trade (e.g., Veeman 1982, 1988; Larue 1994; Cardwell et al 2013). Other critiques pointed out to differential effect of trade liberalization under SM policies (Vercammen and Schmitz 1992; Alston and Spriggs 1998; Larue et al 2007; Pouliot and Larue 2012). Some authors have argued that SM programs are responsible for the use of compositional standards as trade barriers (Felt et al 2012) and prevent the tapping of export opportunities (Carter and Stein-bach 2013). The literature says little about how Canada’s SM dairy policy might affect allocative and technical efficiencies. In fact, previous studies reporting about technical efficiencies typically decompose technical efficiency in terms of demographic variables and farm characteristics (e.g., Mbaga et al 2003; Singbo and Larue 2016), but some have allowed for agglomeration externalities/knowledge spillovers (e.g., Tveras and Battese 2006; Hailu and Deaton 2016). The exception perhaps is Slade and Hailu (2016) who compare allocative and technical efficiency between dairy farms in Ontario and New York State.
The performance of Canada’s dairy farms under SM has been the object of many studies over the years. SM entails scale inefficiency and Moschini (1988) was among the first to document this. Even with a SM policy, farmers still have incentives to adjust their inputs in response to variations in input prices and to try to get the most from their inputs. These arguments suggest that Canadian dairy farmers should be allocatively and technically efficient.
Lumps and Allocative and Scale Inefficiencies
Let us first consider the implications of lumpy inputs. Such inputs are not perfectly divisible and are available in one or a few set sizes that makes it difficult to meet exact
14See http://www.saskmilk.ca/index.php/quota-production/quota-exchange.
15The number of sellers began to increase shortly before the announcement about the conclusion
requirements (i.e., to match the marginal value of the input with its cost). Sumner (2014, p. 157) cites farm machinery, including milking parlors, and managerial capital as being lumpy, while other authors mention that land is a lumpy input (e.g., Reardon et al 1994). In a tight labor market, a farmer may be forced to offer a minimum number of paid hours per week, say 40, even though the expected demand is for 35 at given input and output prices, to prevent his hired hand from taking a 40-hour/week job elsewhere. All else equal, there would be “unused” labor available, but the farmer would most likely respond by either substituting labor for another input or by increasing production to get a return on the additional 5 hours/week of labor that he is paying for and not using. Likewise, for capital, a dairy farmer with 20 cows could invest in a milking robot capable of milking 50 cows and end up with underused capital. Lumps have important implications on efficiency because they can be a source of economies of scale, as pointed out by Sumner (2014), and they limit substitution possibilities between inputs. Some lumpy inputs can be used in part or fully. For example, a dairy barn with 60 stalls may house from 0 to 60 cows. Other lumpy inputs, like tractors, employ the same engine whether they are used for light work or heavy work. Finally, some inputs that are usually not considered lumpy, like cows, are lumpy when production quota is available in small increments of 0.1–0.3 kg/day on any given month.
To better see how lumpiness relates to inefficiencies, consider a simple example with two inputs, capital and labor combined through a Cobb–Douglas production function
given byY=K0.5L0.5. In a world where inputs are divisible, wherewis the wage rate andr
is the rental rate, the farm’s cost minimization problem yieldsKe=Y
√
w/r,Le=Y
√
r/w
and a minimum cost function given by C(w,r,Y)=2Y√rw. Allocative efficiency is
satisfied because the capital–labor ratio equals the relative price of labor,k≡Ke/Le=
w/r. The farm is also scale efficient given the constant return to scale from the Cobb–
Douglas production function.
Now consider the case with lumpy capital and divisible labor. Capital is only available
in increments of 100 units such that ¯K=100,200, . . . . For a quantity of capital ¯K,
the problem of the farm is to minimize its labor cost for a given output ¯Y. From solving
the cost minimization problem, we find a cost function CK( ¯K,Y, w,r) =rK¯ +wLK,
whereLK≡ Y
2 ¯
K. This cost function is weakly larger than the cost function when capital is
not lumpy because input quantities may not be consistent with allocative efficiency. For
input costsw=r=1, a quantity of capital ¯K=100 and outputY=100, the cost of a
farm isCK(100,100,1,1)=200 and this is equal to the cost for the case where capital is
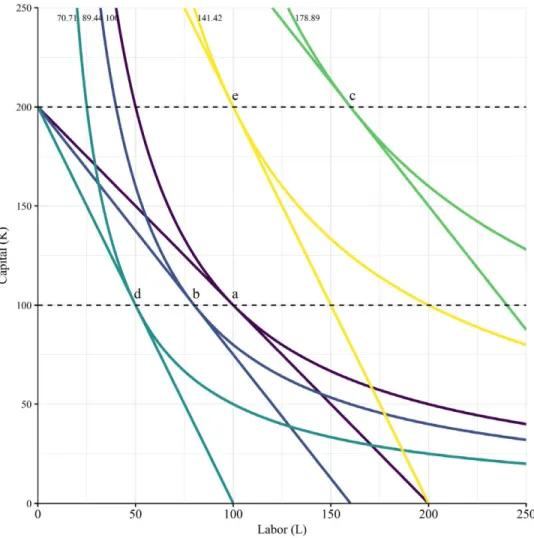
not lumpy,C(1,1,100)=200. This is depicted by pointain Figure 4.
Now, let the wagewrise from 1 to 1.25 so that the relative price of capital decreases.
If capital is not lumpy, the optimal level of capital is 111.803 and the optimal level
of labor is 89.44 for the same level of production Y=100. The cost of production is
C(1.25,1,100)=223.6. With lumpy capital, producing 100 units of output can be done
with the original level of capital (i.e., ¯K =100) at a costCK(100,100,1.25,1)=225 or
with twice as much capital (but less labor) at a cost of CK(200,100,1.25,1)=262.5.
Keeping the input bundle the same is the cheaper option, but it still entails extra cost due to allocative inefficiency.
Decreasing output and labor or increasing output, capital, and labor can restore
allocative efficiency. Recall that allocative efficiency requires that Ke/Le=w/r. From
Figure 4. Input lumpiness and allocative efficiency
yields an outputYe=89.44. Similarly, for ¯K =200, we find that Le=160 and Ye=
178.88. Given constant returns to scale, doubling inputs entails doubling output under allocative efficiency. Sumner (2014) indicates that lumpy inputs can give rise to economies of scale. As a result, output adjustments can improve scale efficiency. To illustrate, we can
compare the average cost of production for efficient levels of outputs (pointsaandcin
Figure 4) to the average cost of production when the output remains atY=100. Simple
computations show thatC(1.25,1,Ye)/Ye=2.236 andCK(100,100,1.25,1)/100=2.25.
Had the change in the wage been larger, the cost of lumpiness would have been larger and the choice not to buy a second lump of capital less obvious. For example, when
the wage rate increases to 2, CK(100,100,2,1)/100=CK(200,100,2,1)/100=3 and
C(2,1,Ye)/Ye=2.82 forYe=70.71,141.42, . . .In this instance, restoring allocative and
scale efficiencies can be done by decreasing output to 70.71 (i.e., pointdin Figure 4) or
is difficult to adjust under a SM policy, particularly in Quebec where unused quota in a given month cannot be leased or sold as in Maritime Provinces. Because it is also more difficult to make temporary output increases in a tie-stall barn than in a free-stall one, it is harder for Quebec dairy farms to correct allocative and scale inefficiencies. This lack of upward output flexibility explains why some Quebec dairy farmers have had difficulties filling their quota in recent months in light of the increase in the demand for milk.
It is also important to note that the cost of lumpiness rises with the share of the lumpy input in the cost function and with the size of the lumps. If capital was available in lumps of 200 instead of 100, the average cost of production at initial input prices
w=r=1 and output (100) would have beenCK(200,100,1,1)/100=2.5 as opposed to
CK(100,100,1,1)/100=2 and the farm would like to double its production to restore
efficiency. As this example shows, the additional cost arising from input lumpiness can be substantial when the lumps are large.
This last point has important implications for farms that are planning to transition away from the tied-stall milking technology because this entails large investments and sub-stantial output increases to achieve allocative and scale efficiencies. The next subsection dwells on the incidence of technological jumps on a different type of inefficiency.
Jumps and Technical Inefficiency
Consider now two milking technologies, 0 and 1, which require capital investments K0
andK1. The choice of technology imposes an upper bound on the number of cows that
can be milked. Accordingly, a farm can produce with excess capacity or at full capacity
given its choice of barn and equipment.16 Besides capital, production requires cows and
labor. Cows and labor are partly substitutable, but substitution possibilities vanish as the number of cows become too small and isoquants become flat at some levels of labor.
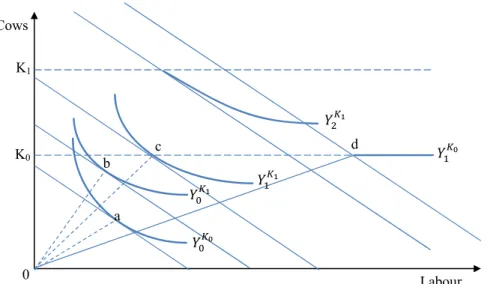
In Figure 5, input combinations alongYK0
0 produce output levelY0given investmentK0
while input combinations alongYK1
0 produce the same level of output under the alternative
technology. Given the relative price of labor, aK0-farm with a production quota ofY0is
best to produce at pointa, does not employ the maximum number of cows allowed by its
capital investment, and hence has unused capital. AK1-farm with the same quota would
produce at pointb and is not using its capital at capacity. The cow–labor ratio of the
K1-farm is given by the slope of the dotted line 0bwhile that of theK0-farm is given by
the slope of the dotted line 0a. Even though both types of farms faced the same relative
input price, they use inputs in different proportions. The K0-farm uses relatively more
labor than theK1-farm and at that level of output it has lower cost since it operates on
lower iso-cost line. In terms of technical efficiency, both farms are inefficient as they have unused capital.
For an outputY0, technology 0 is a better choice than technology 1. However, because
the marginal rate of substitution is zero when the output is large enough for the constraint on the number of cows to bind, adding labor does not increase the output. In Figure 5,
the isoquantYK0
1 is a straight line because adding labor does not add to production. The
cost to produce outputY1is much lower for theK1-farm than for theK0-farm. While the
K0-farm is at capacity, theK1-farm could still add more cows to its production. AtY1, the
16The production functions can take the following form:Y
Figure 5. Technological jump
K1-farm has a lower cost of production and is technically inefficient while theK0-farm is
technically efficient, but has a higher cost of production. To produce at full capacity, the
K1-farm must purchase more quota to increase output toY2K1.
In Quebec, the production quota that a farmer could expect to purchase on any given month on the quota exchange dropped significantly, especially between 2009 and 2011, and the volume remained low until a few months prior to the conclusion of the TPP
negotiations in late 2015 (see Figure 2).17Farms that had wished to expand, by investing
into a new technology or by making capital investment under an old technology, in years prior to 2009, experienced an instant reduction in the pace at which they could reduce underutilized capital and technical inefficiency. The extended transition toward efficiency jeopardized the financial feasibility of large expansion projects. Accordingly, one would expect an increase in technical inefficiency as farmers that had began expansion projects in previous years ended up operating at higher than planned levels of technical inefficiency while farmers who had considered expanding revised or canceled their plan.
The small quantities of quota available on the Quebec exchange made the switch to a lower-cost milking system an unprofitable proposition. As mentioned earlier, two Quebec dairy farmers who had made large investments to increase their production capacity were facing bankruptcy when they were given an exceptional priority of purchase on the quota exchange (La Terre de Chez Nous 2011). Under these conditions, Quebec dairy producers have had no incentive to switch away from the tie-stall milking system and begin “catching up” with western Canadian and U.S. dairy producers. The difficulty in securing
17Trade agreements are known to have anticipated effects (e.g., Magee 2008). The surge in the
number of sellers prior to the end of the TPP negotiations is consistent with long-term profit reductions arising from expected market access concessions. Naturally, this does not preclude other factors from influencing selling decisions.
a large bloc of production quota constitutes a formidable hurdle that keeps Quebec dairy producers technologically trapped.
Dynamic Efficiency
Our discussion so far focused on the concepts of allocative, scale, and technical efficiency in a static setting as does most of the literature. Stefanou (2009) discusses production effi-ciency in a dynamic setting, distinguishing short-run from long-run adjustment processes and the implication for the definition of efficiency. As traditionally assumed in production economics, capital and possibly other factors are fixed in the short run and cannot be adjusted. As a result, only a subset of factors, like materials and production labor, can be adjusted in the short run. Conversely, the long run is the time horizon over which all production factors are variable. Even though a firm is constrained in its ability to adjust in the short run, a firm plans its investment for the long run. Ultimately, the difference between the short and the long runs boils to adjustment cost. The cost to adjust some factors is prohibitive in the short run and this is why these factors are treated as fixed.
In a dynamic model, external or internal costs to the firm prevent adjustment to the optimal quantity of capital in the short run. Adjustment cost prevents firms from making their operation more efficient rapidly. The dynamic stochastic frontier model has the advantage to provide information on the expected efficiency score that will prevail in an industry in the long run as well as the firm-specific paths of adjustment (Emvalomatis 2012). If adjustment costs are external to a firm, then one cannot argue that a firm is inefficient (Stefanou 2009) because the observed inefficiency is the firm’s optimal response to a short-run cost. There is a growing literature on dynamic adjustments (e.g., Silva and Stefanou 2003, 2007; Kapelko et al 2017), most predicated on the notion that some inputs are fixed in the short run. In contrast, our argument focuses on the limited supply of rights to produce, even though we acknowledge that there are constraints limiting the adjustments of some inputs. The construction of a new barn or the expansion of an old one takes time. In the dairy industry, hired labor scarcity is often alluded to rationalize the acquisition of milking robots.
The dynamics about the drop in production quota availability are quite simple. Even before the major drop in the availability of production quota on the exchange, a farm could not secure a large bloc of production quota all at once. Thus, a farm that was investing in production capacity expecting to secure a bloc of say 48 kg over a year, through 12 successive purchases averaging 4 kg, would embark on a pattern of declining inefficiency. Once the capital investment is in place, any slack from insufficient production quota induces inefficiency would gradually fall as more production quota is acquired. If the quantity that can be obtained each month on the quota exchange drops in response to a
regulatory change,18this extends the production acquisition process and hence the period
over which there is inefficiency. Producers who had invested in capacity, but were short of production quota, saw the profitability of their investment fall. Producers who expected the drop to be short lived or an increase in trades in the near future had no reason to abandon their expansion plans. The two aforementioned dairy producers who obtained a purchase priority in 2011 were visibly in this category. However, as it became more
18A binding-price ceiling on quota prices increases the number of buyers, reduces the number of
Method
We use a stochastic distance function approach as in Singbo and Larue (2016) to test whether the theoretical pattern of technical inefficiency described above is supported by data about dairy farms in Quebec. The hypothesis revolves around a jump in technical in-efficiency when the price ceiling was adopted, followed by a smooth decrease in technical inefficiency beginning when the volume of production quota traded dropped drastically. We will observe the hypothesized jump in technical inefficiency if dairy farms operating with underused capital were significantly constrained in increasing output to restore tech-nical efficiency. The hypothesized downward trend subsequent to the jump in techtech-nical inefficiency should be observed if farms that had been considering expansion projects put them on hold once it became clear that there would be less production quota for sale. Meanwhile, the farms who had expanded and were operating at an inefficient scale kept purchasing small quantities of production quota and slowly became more efficient. A rapid decline in the volume of production quota traded began in 2009, two years after the price ceiling regulation, and our theoretical argument suggests that it is around this date that it should be easiest to detect the peculiar pattern of technical inefficiency discussed
above.19
Stochastic frontier distance functions are particularly useful in the analysis of scale and technical efficiency in the presence of multiple outputs and inputs (for details, see Kumbhakar and Lovell 2003, p. 48; Morrison-Paul and Nehring 2005). Quebec dairy farms produce milk, beef from culled cows, other livestock products, and crops using several inputs, namely, cows, land, machinery, other capital, labor, and energy. Newman and Matthews (2007) point out that an input-oriented distance function is a better in-strument than an output-oriented one when outputs constraints on output adjustment apply. This is clearly the case for outputs under the dairy SM policy. Kumbhakar et al
19It should also be pointed out that the MSQ, a proxy for national industrial milk demand, was
essentially stagnant between 2008 and 2010, which contrasts with the large increase in 2016. Because the MSQ is allocated to provinces, large MSQ increases alleviates the output adjustments problems of Quebec dairy producers. The allocation of milk to processing plants in Quebec is regulated by theconvention de mise en march´e du laitwhich defers day-to-day management to the provincial marketing board. As for the allocation of milk, fluid milk for consumption has first priority followed by milk used for yogurt and ice cream, cheese, and finally butter and powder. Because butter is less perishable, it is used as a buffer to deal with unexpected fluctuations in supply and demand.
(2008) use a stochastic input distance function to show that Norwegian dairy farmers responded to policy-induced constraints on milk production by increasing meat pro-duction. Slade and Hailu (2016) also use a stochastic input distance function. They report that large dairy farms in Ontario are more technically efficient and cost effi-cient than smaller ones. One of the advantages of distance functions is that estimation does not require input prices. While we can analyze technical and scale efficiencies with a stochastic distance function, we cannot analyze allocative efficiency without reliable input prices.
The input distance DI(X,Y,t) identifies the smallest input vector X necessary to
produce output vectorY, defined according to the set of input vectors L(Y,t) capable
of producing the output vector at time t. It describes how much an input vector may
be proportionally contracted holding the output vector fixed. The multioutput input-requirement function allowing for deviations from the frontier is as follows:
DI(X,Y,t)=max{ρ :ρ >0,(X/ρ)∈L(Y,t)} (1)
where DI(X,Y,t) is a measure of the radial distance from (X,Y) to the production
function, ρ is a scalar, L(Y,t) is the set of input vectors, and X=(x1, . . . ,xN)∈RN+
which in yeartcan produce the output vectorY=(y1, . . . ,yM)∈RM+. We use a translog
function to approximate the input distance function because of its capacity to approximate arbitrary technologies. We normalize inputs in the distance function using the land input
(x3). For farmiat timet, the technological frontier and stochastic components are related
as follows: −ln (x3it)=α0+ N n=3 αnlnx∗nit+ 1 2 N n=3 N k=3 αnklnxnit∗ lnxkit∗ + M m=1 βmlnymit+ 1 2 M m=1 M l=1 βmllnymitlnylit+ M m=1 N n=3 γmnlnymitlnxnit∗ + N n=3 δtxntlnxnit∗ + M m=1 δt ymtlnymit+δtt+δttt2+vit−uit (2)
wherexnit∗ =xnit/x3it∀n,i,t,vit is a random statistical noise, andui t is a one-sided error
term representing a technical inefficiency measure with lnDiI(Xi,Yi,t)=uit≥0 where
DiI(Xi,Yi,t)≥1 is the value of the input distance function of theith farm using input
vectorXiand producing output vectorYiin yeart. It is important to recall the regularity
conditions associated with the input distance function are homogeneity of degree one in input quantities (i.e., linear homogeneity inputs) and symmetry. Linear homogeneity in inputs implies that the parameters in the above equation must be restricted such that:
N n=1αn=1; N k=1αnk=0; N n=1γmn =0; and N
n=1δtxn =0. The symmetry property
is imposed by restrictingαnk=αkn(n,k=1, . . . ,N) andβml =βlm(m,l =1, . . . ,M). In
the model specification, linear homogeneity is imposed by normalizing the input vector by one of the inputs.
conditional mean model was developed in the context of panel data estimators and as
such, it can be applied to cross-section and panel data (Stata 2015, p. 795).20 To test for
the hypothesized inefficiency pattern, we begin by specifying the farm-specific inefficiency
μitterm as:
μit =ψ0+ψ1T+ψ2age+ψ3off−farm work+ψ4south+ψ5north+ψ6D2009a
+ψ7T∗D2009a (3)
D2009a =1 if year≥2009 andD2009a =0 otherwise. The purpose of this variable is to
capture the jump in technical inefficiency due to the drop in the availability of production quota. Our prior about the coefficient for this variable is that it should be positive. The
time trendT=1, 2, . . . and its interaction withD2009a, allows for different trends around
the hypothesized jump. We expect a negative sign forψ7. For robustness, we also estimated
specifications with year-specific effects,D20xx=1 if year=20xxandD20xx=0 otherwise,
withoutT, D2009a and T∗D2009a, to allow for multiple jumps and more flexible trend
patterns.
Age is a continuous variable. Older farmers could be less inefficient because of their experience, but they might also be less likely to make long-term investments and be proficient with new information technologies. We do not have a clear prior about how age affects efficiency. Off-farm work is a binary variable that equals one when the farm operator engages in off-farm work and zero otherwise. Dairy farmers involved in off-farm work have less time to devote to their dairy business and this should increase inefficiency. On the other hand, their herd is on average smaller, they have less land, produce less of other agricultural outputs, and they are less likely to embark on time-consuming
expansion projects. Accordingly, the incidence of off-farm work isa prioriambiguous.
Following Rasmussen (2010) and Mosheim and Lovell (2009), we include regional binary
20The Battese and Coelli (1992) estimator is commonly used to analyze trends in technical
inef-ficiency in panel data. Because it allows only for linear trends, it cannot be used to test for the pattern inferred from our theoretical analysis. The conditional mean model offers more flexibility, at little cost for the estimation of farm-specific inefficiency scores because our panel is unbalanced and there are (unfortunately) many gaps. Trade-offs are common in frontier estimation. Amsler et al (2016, p. 286) ignore the panel structure of their data and use a Cobb–Douglas form to focus on estimators correcting for input endogeneity.
variables in the decomposition of the inefficiency component to capture regional effects.21 The central region is the default. Naturally, other variables were considered in searching for an appropriate specification.
The endogeneity of some inputs in the estimation of production functions is po-tentially problematic. The argument is that there are firm-specific productivity shocks observed by managers or farmers (but unobserved by econometricians) that allow man-agers or farmers to adjust some inputs and hence production. Treating all inputs as exogenous introduces a bias in this context. Recent contributions by Amsler et al (2016) and Latruffe et al (2017) show different ways of addressing the issue in the context of stochastic production frontier estimation. The premise is that some inputs can be used more intensively to boost output in response to a positive productivity shock. As for the estimation of an input distance function, Tsionas et al (2015) argue that input ratios may also be endogenous as firms or farms attempt to make adjustments to be allocatively efficient in producing exogenous levels of outputs as per our theoretical discussion in the previous section. The proposed correction requires input prices which are often not available, as in our case, or unreliable. However, in a context of production with lumpy inputs and difficulties in acquiring production quota, input ratios should be more rigid in the face of input price variations and the endogeneity of input ratios should be a lesser concern in our case.
Data
The data are similar to those in Singbo and Larue (2016). The data are a farm account
series from theGroupe Conseils Agricoles du Quebec, a management group in the province
of Quebec, and thus only members of this group are part of the sample. Management advisers collected the data during farm visits. Thus, our sample is not random. The data include operator characteristics, revenue and costs of production, marketing practices, production technology, and management practices. We limit our data sample to dairy farms whose dairy farm cash receipts was at least 70% of their farm’s total farm cash receipts so that each farm primarily focuses on dairy production. The data for this study cover the 2001–10 period with gaps in 2003 and 2004.
Entries and exists contributed to the unbalancedness of the data along with missing data and the deletion of observations due to inconsistencies. After cleaning the data, 182 farms and 549 observations remained. Of those, 78% pertain to operations headed by a man. Our panels have gaps because some farms had missing variables for one or more years. For others, observations are available only before or after the hypothesized jump. These make up 38% of all observations. Dairy production is concentrated in the southern part along the St. Lawrence River which accounts for about 70% of the dairy farms in Quebec.
The data consist of two outputs (milk and beef and other nondairy) and five inputs (feedstuff, labor, land, machinery, and other capital). Cattle are an inevitable byproduct of milk production and this is why it is lumped with it. Aggregation of outputs into the
21The interpretation of regional effects in the inefficiency term is that as a group, some farmers
might face constraints that limit their ability to get the most from their inputs (Rasmussen 2010). Regional effects could potentially justify the estimation of different frontiers as in Mbaga et al (2003), but this would reduce the sample size in the estimation.
terest, depreciation, maintenance, and insurance on buildings, cost of insemination and control, and energy. The output and input prices used are prices from yearly Agricultural
Price Statistics from various sources likeLa Financi`ere Agricole du Qu´ebecandLe Centre
d’Expertise en Production Laiti`ere Qu´ebec-Atlantique(VALACTA). Cost shares are de-termined in a similar way as the revenue shares mentioned above. All input and output variables are mean-corrected prior to estimation, so that the coefficients of the first-order terms can be directly interpreted as distance elasticities evaluated at the geometric mean of the data.
Input and output variables were aggregated using T ¨ornqvist indices. The dairy output includes milk sales, sales of embryos, and sales of culled cows. The second output variable aggregates crop sales and sales of other livestock. Labor includes family and hired workers. We transformed the input and output variables prior to estimation. First, we applied logs, then we normalized at their geometric mean and finally we divided it by the land input to impose the linear homogeneity property of the input distance function.
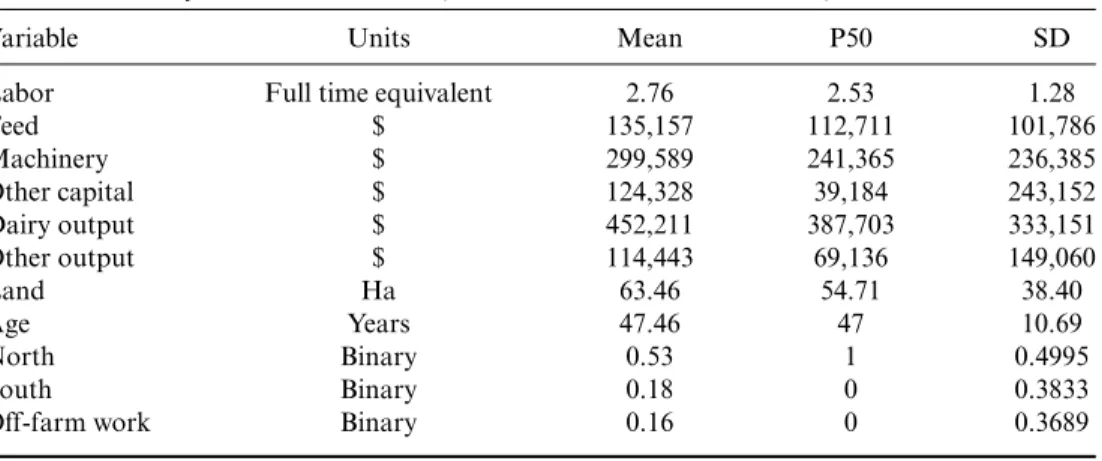
Table 2 presents descriptive statistics about the inputs, outputs, and operator char-acteristics. The mean, median, and standard deviation are reported to give some insights about central tendencies, dispersion, and skewness. The average operator is 47 years old. Off-farm revenues were reported for 16% of our observations and the average revenue
Table 2. Summary of selected variables (number of observations, N=549)
Variable Units Mean P50 SD
Labor Full time equivalent 2.76 2.53 1.28
Feed $ 135,157 112,711 101,786 Machinery $ 299,589 241,365 236,385 Other capital $ 124,328 39,184 243,152 Dairy output $ 452,211 387,703 333,151 Other output $ 114,443 69,136 149,060 Land Ha 63.46 54.71 38.40 Age Years 47.46 47 10.69 North Binary 0.53 1 0.4995 South Binary 0.18 0 0.3833
from dairy outputs slightly exceeds $452,000 per year, compared to $114,000 for other outputs. The median revenues being smaller than the means suggest that the distributions of revenues are skewed to the right as a few larger farms pull the means to the right.
Results
Our hypothesis is about a nonmonotone trend in technical inefficiency and one might wonder whether the presence or absence of trend in the estimation of the frontier might affect the estimated technical efficiency pattern. Models with linear and quadratic trends failed to converge. We estimated a model as in Equations (2) and (3), but without linear and quadratic time trends in the frontier and compared it to a model without any trend effects/disembodied technological change in the frontier. The models being nested, we
implemented a parametric test, χ2(6)=7.15, p-value of 0.30, which failed to flag a
significant difference between the fit of the two models. We concluded that trend-input and trend-ouput interaction effects were not important. This restricted model is our model 1. Then, we estimated a model with a linear time trend in the frontier/Equation (2), but without a linear time trend in the inefficiency component/Equation (3) to see whether the switching of the linear trend across equations would alter significantly the results. These models are nonnested, but their log likelihood functions are very close (428 vs. 425) even though the linear trend effect, which enters the frontier equation in one model and the inefficiency equation in the other, is significant in both models.
The technical inefficiency parameters from two models are presented in Table 3. These are the estimated parameters of Equation (3), jointly estimated with the frontier parameters presented in the Appendix. The coefficients in Table 3 for models 1 and 2 are very similar which suggests that whether a linear time trend is in the frontier equation or in the inefficiency decomposition equation does not matter. It has already been ascertained that interactions between a time trend and inputs and outputs had little effect on the decomposition of technical inefficiency. Thus, standard trend effects are not very important in this case.
The coefficients for age are positive and statistically significant which means that older farmers tend to be less efficient. To put the size of the coefficients in perspective, a 20-year age differential increases technical inefficiency by 0.028 and the average level of technical efficiency is 0.68. This level is lower than that the 0.87 reported in Singbo and Larue (2016) and the 0.81 in Hailu and Deaton (2016) for Ontario farms. Off-farm work has a small negative effect on technical inefficiency, which might appear surprising considering that operators working outside the farm have less time to spend on running their farm. However, in our sample, farmers engaging in off-farm work have fewer cows, lower dairy revenue, and lower other revenue and hence have less to do on their farm. Perhaps, off-farm income should be modeled as a third output in the distance function. Location matters and farms located in northern regions of Quebec tend to be more inefficient than otherwise similar farms located in central and southern regions. Mbaga et al (2003) found similar results in presenting results for dairy farms located in areas where corn cannot be profitably grown and in areas where corn production is profitable. The coefficient on the time trend for model 1 in Table 3 confirms the existence of forces reducing inefficiency over time, which means that less efficient farms are catching up with the more efficient ones. There is a large jump in inefficiency in 2009 followed by a
D2005 n.a. n.a. −0.1127*** (0.0166) D2006 n.a. n.a. −0.0719*** (0.0182) D2007 n.a. n.a. −0.0489*** (0.0182) D2008 n.a. n.a. 0.07230*** (0.0212) D2009a 0.4898*** 0.4897*** n.a. (0.1738) (0.1738) Time*D2009a −0.0362** −0.0362** n.a. (0.0183) (0.0183) D2009 n.a. n.a. 0.1615*** (0.0198) D2010 n.a. n.a. −0.0432** (0.0173) Constant 0.2790*** 0.2521*** 0.2733*** (0.0356) (0.0325) (0.0335) Ave. eff. 2001–08 0.7136 0.7154 0.7250 [0.54–0.99] [0.54–0.99] [0.55–0.99] Ave. eff. 2009 0.6203 0.6073 0.6254 [0.48–0.78] [0.47–0.76] [0.49–0.77] Ave. eff. 2010 0.6447 0.6279 0.6511 [0.46–0.87] [0.45–0.85] [0.48–0.87] Notes: Standard errors in parentheses.
*p<0.10,**p<0.05,***p<0.01. Minimum and maximum efficiency scores in brackets.
downward trend as expected. The drop in the volume of production quota traded that began in early 2009 had a huge effect on technical inefficiency.
To assess the robustness of our results, we estimated the models only on farms for which we had data prior and after 2009, which reduced the sample size to 340. We also estimated the models with dummy variables in the distance function and in the decom-position of the inefficiency to account for farms that exited prior to 2009 and farms that entered in 2009 or after. The purpose was to ascertain whether selection effects
arising from entries and exits could be strong enough to impact on the evidence about a nonmonotonic trend. The results were very close to the ones reported both qualitatively and quantitatively. Since the objective was to validate that the rationing of production quota has significant effects on efficiencies, we assumed that the biggest jump in technical inefficiency would coincide with the year that showed the largest reduction in the volume of trade on the Quebec quota exchange. We relaxed this assumption by estimating models with an inefficiency decomposition specification allowing for a time trend and dummy variables for specific years beginning in 2007, the beginning of the price ceiling era, all the way to 2010, as well age, off-farm work, and regional variables. The coefficients on the time trend, age, off-farm work, and the regional dummies are almost identical to the ones reported in Table 3. The coefficients for 2007 and 2008 were positive and statisti-cally significant, but less than half the size of the coefficient for 2009. The coefficient for 2010 was not statistically significant, signaling a return to a lower level of technical inefficiency. This pattern is also consistent with our theoretical hypothesis, except that it suggests that technical inefficiency began to increase prior to 2009 while confirming that the maximum level of technical inefficiency occurred in 2009. Finally, we introduced year dummies for all years along with age, off-farm work, and regional dummies to validate the assumption of a downward trend in technical inefficiency prior to 2007. It turned out that there was absence of trend between 2002 and 2004, a negative trend between 2005 and 2007, a positive trend in 2008 and 2009, and a drop in 2010. We report the tech-nical inefficiency decomposition coefficients of this model with the zero trend imposed between 2002 and 2004 in the last column of Table 3. The average level of technical inef-ficiency in this last model is 0.37, which is essentially the same as in the more constrained models.
The bottom part of Table 3 reports average efficiency between 2001 and 2008, and for 2009 and 2010. The numbers inside the brackets are the minimum and maximum efficiency scores. The most flexible specification, model 3, which does not impose any particular pattern of inefficiency, produces very similar results to models 1 and 2. This is indeed reassuring, but the above results must be interpreted with caution in light of the deficiencies of our data set, including the early end of our sample in 2010.
CONCLUDING REMARKS AND POLICY IMPLICATIONS
Canada’s SM policy governing its dairy sector has been operating for decades. It has shielded the industry from major trade liberalization initiatives in the past, but the im-plementation of CETA will bring TRQ enlargements and modifications to NAFTA may bring further liberalization. Canada’s SM policy has provided Canadian dairy farmers with high and stable returns, but it has adversely affected their ability to compete under trade liberalization, especially in Quebec where the average herd size is particularly small and where most farms rely on the tie-stall milking system. The obvious questions that come to mind is why are Quebec dairy farms smaller and what is preventing them from “catching up”? We show that Quebec dairy farms were more vulnerable to scale ineffi-ciency than farms in Western provinces even before Quebec imposed a price ceiling on its quota exchange. The price ceiling and other regulations exacerbated the asymmetry in the number of buyers and sellers, reducing the probability of trade and the volume that an individual buyer can expect to get.
dairy farms shrink, reduce the average price of milk for farmers, and exacerbate the inefficiencies discussed above. Under the status quo, many small farms will continue buying small increments of quota from farms exiting the industry and too few will be able to make the technological switch to be competitive. The competitive disadvantage of Quebec dairy farms has rationalized the long-held position to exclude the dairy sector from market access concessions. There were simply “too many to fail.” This strategy will no longer work because Canada has made market access concessions and more are sure to follow. Production quota must be made available to individual farms wishing to make technological and herd size adjustments to be competitive. This can be done by first removing exchange regulations preventing rapid herd expansions such as the price ceiling, the limit on the volume that a farmer can purchase on any given month, and quota location ties in the purchase of a dairy farm. Then, P5 regional exchanges should be merged to allow interprovincial quota trades and farmers should be able to lease unused quota. The same could be done in Western Canada. Dairy farmers exiting would be fairly compensated for their production quota by other dairy farmers taking steps to be “in it for the long haul.” This would allow regional competitive advantage to dictate the reallocation of production quota and make the industry more resilient to market access concessions. If the politics are such that Canada’s dairy SM program is to remain in place for years to come, then it is in the national interest to improve it. Making the Canadian dairy sector more competitive through SM improvements would lower domestic costs, bring about output increases, and domestic price reductions which in turn would translate into reduced margins on imported dairy products. A more competitive Canadian dairy market would be less appealing for foreign firms and less of a priority for foreign trade negotiators.
ACKNOWLEDGMENTS
The authors wish to thank two anonymous reviewers and the editors for insightful comments and suggestions. Funding from FQRSC-´equipe de recherche and from the Canada Research Chair program is gratefully acknowledged.
REFERENCES
Alston,J. and J. Spriggs.1998. Endogenous policy and supply management in a post-GATT world.
Amsler,C.,A. Prokhorov and P. Schmidt.2016. Endogeneity in stochastic frontier models.Journal of Econometrics190: 280–88.
Barkema,H. W.,M. A. G. von Keyserlingk,J. P. Kastelic,T. J. M. Lam,C. Luby,J.-P. Roy,S. J. Leblanc,G. P. Keefe and D. F. Kelton.2015. Changes in the dairy industry affecting dairy cattle health and welfare.Journal of Dairy Science98: 7428–45.
Battese, G. E. and T. Coelli. 1992. Frontier production functions, technical efficiency and panel data: With application to paddy farmers in India. Journal of Productivity Analysis 3: 153–69.
Bentley, J., K. Schulte, L. Timms and L. Tranel. 2012. Low Cost Parlor System-Producer Survey. Iowa State University Extension and Outreach. http://www.extension.iastate. edu/dairyteam/milking-systems (accessed on August 5, 2015).
Cairns,A. and K. Meilke.2012. Price ceilings on milk production quota values: Future or folly?
Canadian Journal of Agricultural Economics60: 93–112.
Canadian Dairy Information Center. 2015. Canada’s dairy industry at a glance. http://www.dairyinfo.gc.ca/index_e.php?s1=cdi-ilc&s2=aag-ail (accessed on August 5, 2015).
Cardwell,R.,C. Lawley and D. Xiang.2013. Milked and feathered: The regressive welfare effects of Canada’s supply management regime.Canadian Public Policy41: 2013–62.
Carter,C. A. and S. Steinbach.2013. Emerging Markets, Agricultural Trade and Canada’s Relative Performance. Paper presented at the Third Annual Canadian Agricultural Policy Conference, Ottawa, January 23-25. http://www.ag-innovation.usask.ca/2013policyconference.html (accessed October 12, 2017).
Chernoff,A. W. 2015. Between a cap and a higher price: Modeling the price of dairy quotas under price ceiling legislation.Canadian Journal of Economics48 (4): 1403–29.
Elskamp,R. and G. Hailu.2017. The impact of market intervention on quota mobility: The case of the Ontario dairy industry.Canadian Journal of Agricultural Economics65: 249–70.
Emvalomatis,G. 2012. Adjustment and unobserved heterogeneity in dynamic stochastic frontier models.Journal of Productivity Analysis37 (1): 7–16.
Felt,M.-H.,B. Larue and J.-P. Gervais.2012. Compositional standards, import permits and market structure: The case of Canadian cheese imports.The World Economy35: 1053–72.
Gosselin, E. 2015. Un Qu´ebec Entrav´e dans un Canada Libre. Le Coop´erateur 44 (4): 36. http://www.lacoop.coop/cooperateur/articles/2012/02/p36.asp (accessed October 6, 2017).
Greene,W. H.,2008. The econometric approach to efficiency analysis. InThe Measurement of Productive Efficiency and Productivity Growth, edited by H. O. Fried, C. A. K. Lovell and S. S. Schmidt, pp. New York: Oxford University Press, Inc. 92–250.
Hailu,G. and B. Deaton.2016. Agglomeration effects in Ontario’s dairy farming.The American Journal of Agricultural Economics98: 1055–73.
Kapelko,M.,A. O. Lansink and S. E. Stefanou.2017. Input-specific dynamic productivity change: Measurement and application to European dairy manufacturing firms. Journal of Agricultural Economics68: 579–99.
Kumbhakar,S. C.,G. Lien,O. Flaten and R. Tveteras.2008. Impacts of Norwegian milk quotas on output growth: A modified distance function approach.Journal of Agricultural Economics59: 350–69.
Kumbhakar,S. C. and C. A. K. Lovell.2003.Stochastic Frontier Analysis, p. 333. Cambridge, UK: Cambridge University Press.
Lambert,R.,R. Romain,B. Basillais and C. Roy.1995. Analyse de la Lib´eralisation des ´Echanges de Quotas entre le Qu´ebec et l’Ontario dans le Secteur Laitier.Revue Canadienne d’Agro´economie
43: 209–23.
Lane,S. and G. Brinkman.1988. A Study of Milk Quota Prices in Ontario. Ontario Milk Marketing Board Report, Guelph.
MacDonald,J.,E. O’