HiddenLevers Statistical Analysis Approach
HiddenLevers' core model uses a multilevel approach to find meaningful relationships between macro-economic indicators (levers) and investment assets. The model currently analyzes US stocks, ETFs, ADRs, mutual funds, currencies, and options.
The statistical analysis underlying HiddenLevers is currently composed of two stages: a regression model that calculates the relationships between every economic lever and every asset, and an intelligent filtering process that separates out correlation from causation within this large universe of regression data. The two stages of the HiddenLevers model are described in detail below.
Stage 1: HiddenLevers Regression Model
HiddenLevers currently performs regression analysis of each stock against the S&P 500 (a proxy for the market) and each indicator. The regression is performed in a manner consistent with the CAPM (capital asset pricing model), where a stock’s rate of return is regressed against the return of the
market-at-large. In HiddenLevers’ model, the stock’s percentage return is regressed against the return
on the S&P 500 and the return (or percentage change) of the indicator in question.
The basic form of the equation follows: Asset return = A * (lever return) + B * (S&P return) + C
Since up to 70% of any given stock’s return is based on overall market returns, a simple correlation of the indicator and investment can be misleading. Instead, the regression coefficient representing a stock’s sensitivity to a particular economic indicator is calculated using both the change in the
indicator and the change in the market, as shown in the example equation above. HiddenLevers thus controls for the effect of the market when measuring the correlation between a stock and a lever, leading to a more accurate measure of the relationship.
Once the regression analysis is complete, HiddenLevers captures as lever impact coefficients (correlations) only those regression results which are statistically significant within a standard 95% confidence interval. These results become the actual investment-lever relationships used to drive the HiddenLevers stock screener and scenario analysis.
HiddenLevers currently uses a decade of data to perform most statistical analysis, except when the investment has not been in existence for a decade. A decade of data is preferable since it provides enough data to observe statistically significant relationships, without extending the time-frame so far that it falls into a potentially different macro-economic era. It’s important to note that relationships between particular stocks and levers may change over time; HiddenLevers accounts for this by running its statistical engine on a nightly basis in order to ensure that recent changes are taken into account. In an upcoming release, HiddenLevers plans to calculate these relationships for multiple time periods in order to better model how correlations change over time.
Stage 2: Guided Filtering of Data to Find Causation
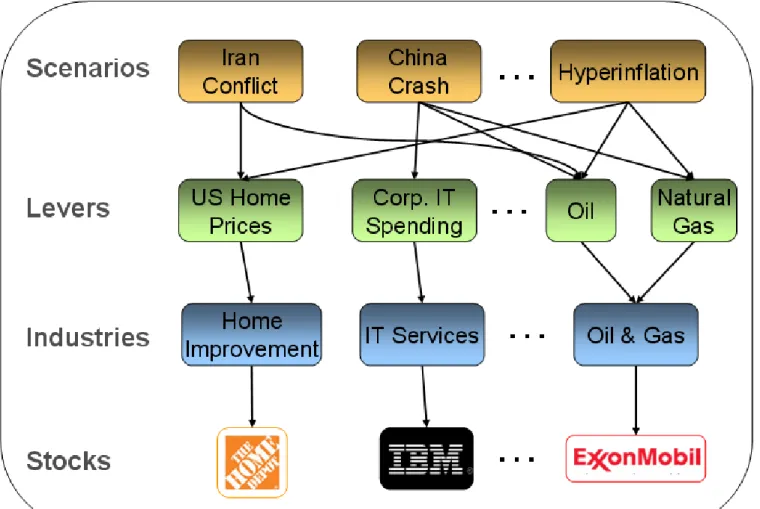
The Stage 1 HiddenLevers regression model runs hundreds of thousands of regressions total, and produces tens of thousands of statistically significant results. Not all of these relationships represent causation between a lever and a stock, however. With such a large dataset, many of the relationships are just correlation. For instance, Apple stock (AAPL) is correlated with gold prices over the last decade in statistical models, but this does not imply that gold's rise caused AAPL stock to rise. In order to eliminate results like these, HiddenLevers has implemented a guided filtering process. The following image shows how stocks (and ETFs and ADRs) are mapped to industries in
HiddenLevers, which are in turn mapped to economic levers. These mappings form the core of the guided filtering process:
HiddenLevers' guided filtering process involves the following steps:
1. Creation of proprietary industry list: HiddenLevers has created a proprietary industry list, adding
new industries where needed to capture the intricacies of the modern economy. Existing industry lists like the S&P GICS do not have categories for solar energy, wind energy, or other new industries. Existing industry lists also lack the precision needed for HiddenLevers’ economic modeling. HiddenLevers has added industries like Fast Food and Transaction Processing to capture these gaps, and has mapped all US stocks, ETFs, ADRs, and mutual funds to the list.
2. Mapping stocks to industries: HiddenLevers maps investments to its proprietary industry list,
mapping one stock to multiple industries when necessary to correctly model its business. Apple (AAPL), for instance, is mapped to both the Personal Computers and Wireless Devices industries, since it has a significant presence in both industries. ETFs and other funds are mapped to special industries which categorize funds by sector or general fund type.
3. Mapping economic levers to industries: Economic levers are mapped to industries based on
fundamental analysis on which indicators have a causal relationship with the industry. Oil and natural gas are mapped to a number of energy production-related industries, for instance.
Foreclosure rates are mapped to housing and real estate finance-related industries. HiddenLevers performs ongoing research to improve the mappings between economic indicators and industries.
4. Utilize the mappings to filter regression data: The relationships between industries and
economic levers are used to form a complete list of levers that might impact each investment. This list is then compared against the full regression results for each investment. If a lever from the list of potential impacts has statistically significant regression results, it is included in HiddenLevers
database. If a lever not on the list has a statistically significant relationship with the stock, then it is subjected to a more stringent set of empirical tests to determine causation. If the relationship passes these tests as well, then it is included in HiddenLevers database.
The guided filtering process described above eliminates tens of thousands of correlations between stocks and levers which do not show sufficient evidence of causation. This significantly improves the quality of the data produced by the HiddenLevers engine as compared to traditional statistical models. HiddenLevers model is able to show which levers truly impact different stocks and ETFs, and to differentiate these from simple correlations.
Appendix: Visual Examples of Regression Fit & Filtering Process
To better illustrate how the two-stage statistical analysis model works, three visual examples are provided below. The first example shows a good regression fit which is included in HiddenLevers' model, while the second example shows a mutual fund which closely follows the S&P, likely drowning out correlation with any other lever. The final example shows a correlation which is excluded through the filtering process.
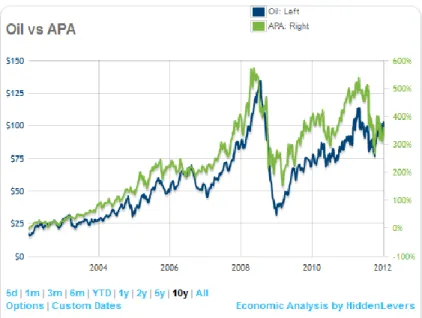
Example 1: APA vs Oil
Figure 2: Apache Oil vs. Oil Prices
Apache Oil, a large independent oil & gas driller in the US, has a strong positive correlation oil prices over time. The model quantifies this relationship through regression analysis and includes it for use in scenario modeling.
Example 2: vs S&P 500
Figure 3: Davis NY Venture Fund vs S&P 500
Example 2 shows a large actively managed mutual fund ($25B assets) which tracks the S&P 500 so closely that it's unlikely to show meaningful correlations to any other lever in HiddenLevers model. The tight fit to the S&P overwhelms other levers in the regression analysis – this funds returns are in
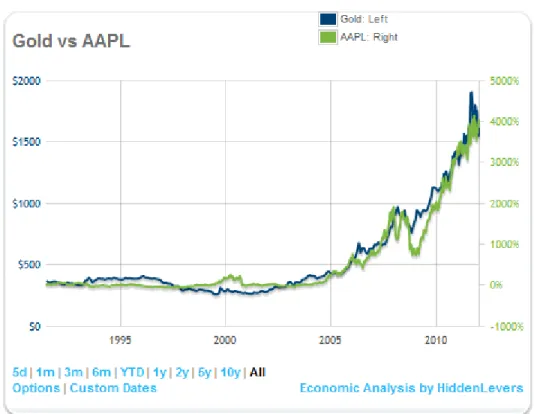
Example 3: AAPL vs Gold
Figure 4: Apple Inc vs Gold Prices
Apple's stock price and the price of gold have risen seemingly in lockstep for over a decade. A regression analysis finds a high degree of correlation here with a very high level of confidence. Fundamental analysis (and common sense) don't provide any plausible reason for this relationship, however. Base on the industries that Apple participates in, HiddenLevers' stage 2 filtering process identifies this sort of relationship as a statistical coincidence, and evidence of correlation without causation. Apple is not tied to gold prices in HiddenLevers models as a result – though this data is stored and can be referenced by users if desired.