R e c e n t c h a n g e s t o floo d pl ai n
c h a r a c t e r a n d fu n c tio n ali ty i n
E n gl a n d
E n t wi s tl e , N S , H e r i t a g e , GL, S c h ofi el d, LA a n d Willi a m s o n , RJ
h t t p :// dx. d oi.o r g / 1 0 . 1 0 1 6 /j. c a t e n a . 2 0 1 8 . 1 1 . 0 1 8
T i t l e
R e c e n t c h a n g e s t o flo o d pl ai n c h a r a c t e r a n d f u n c tio n ality i n
E n g l a n d
A u t h o r s
E n t wi s tl e, N S , H e r i t a g e , GL, S c h ofi el d, LA a n d Willi a m s o n ,
RJ
Typ e
Ar ticl e
U RL
T hi s v e r si o n is a v ail a bl e a t :
h t t p :// u sir. s alfo r d . a c . u k /i d/ e p ri n t/ 4 8 8 9 0 /
P u b l i s h e d D a t e
2 0 1 8
U S IR is a d i gi t al c oll e c ti o n of t h e r e s e a r c h o u t p u t of t h e U n iv e r si ty of S alfo r d .
W h e r e c o p y ri g h t p e r m i t s , f ull t e x t m a t e r i al h el d i n t h e r e p o si t o r y is m a d e
f r e ely a v ail a bl e o nli n e a n d c a n b e r e a d , d o w nl o a d e d a n d c o pi e d fo r n o
n-c o m m e r n-ci al p r iv a t e s t u d y o r r e s e a r n-c h p u r p o s e s . Pl e a s e n-c h e n-c k t h e m a n u s n-c ri p t
fo r a n y f u r t h e r c o p y ri g h t r e s t r i c ti o n s .
Contents lists available atScienceDirect
Catena
journal homepage:www.elsevier.com/locate/catena
Recent changes to
fl
oodplain character and functionality in England
N.S. Entwistle
a,⁎, G.L. Heritage
b, L.A. Scho
fi
eld
c, R.J. Williamson
daUniversity of Salford, School of Environment and Life Sciences, Peel Building, Salford M5 4WT, UK bAquaUoS, Univeresity of Salford, Salford, M5 4WT, UK
cYork St John University, School of Humanities, Religion and Philosophy, York YO31 7EX, UK dMellor Archaeological Trust, Stockport SK6 5PL, UK
A R T I C L E I N F O
Keywords:
Floodplains Flooding Land management Wetlands
A B S T R A C T
Regime analysis suggests that temperate alluvial watercourses overtop their banks on average once every 1.5 years transferring water and sediment across the valleyfloor to formfloodplains helping maintain a strong hydrological connection between in-channel and overbank form and process. Flooding also causes erosion, se-diment transfer and deposition creating a variety offloodplain morphologic units and functional connectivity with the main river. The result is a morphologically and ecologically varied wetland dominated ecotone where diversity is sustained by the action andflooding and shallow groundwater processes. Floodplains are, however, sensitive to disruption and many have been significantly degraded since the Bronze Age as a result of activities that alterflooding and groundwater processes and manage vegetation communities. The current (2015)fl ood-plain condition and trends of change since 1990, for England are presented here using land use data for 1990, 2000, 2007 and 2015. Floodplain system degradation has been found to be both widespread and severe across the whole of the country. The 1990 data set showed that intensive agriculture occupied around 38% offl ood-plain zones expanding to 53% by 2000 before slowing slightly to covering 62% in 2007. Between 2007 and 2015 the coverage remained relatively static (64%) with some suggestion that arable areas were being transformed to pasture. Wetland areas in the form of fen, marsh, swamp and bog have been devastated with the data sets indicating that these fundamentalfloodplain units have been all but lost. Upland and lowland areas are both severely impacted with a near ubiquitous loss of naturalfloodplain functioning. Despite this some 31% of rivers in England are classified as good or better under the European Water Framework Directive classification system calling into question the UK WFD status classification process.
1. Introduction
Floodplains have long been recognised as globally sensitive and threatened ecosystems (Petts et al., 1989). Past research shows that they are presently highly modified from their natural state and re-present one of the most threatened ecosystems worldwide (Olson and Dinerstein, 1998). It is estimated that there are between 0.8 million (Mitsch and Gosselink, 2000) and 2.2 million km2 of rivers and lake related floodplains across the world (Ramsar and IUCN, 1999) con-tributing to around a quarter of all land based ecosystem services (Mitsch and Gosselink, 2000). Broad estimates reported byTockner and Stanford (2002)suggest that around 80% - 90% offloodplains across Europe are now intensively cultivated, estimates for North America suggest thisfigure is 46% (excluding northern Canada and Alaska) and 11% offloodplains are farmed across Africa. These estimates are sup-ported for North America situation byErwin (2009)who described 90%
of floodplains there as ‘cultivated’ and non-functional. Global in-formation on land cover and land cover change has been generated through the analysis of satellite data combined with local ground truthing (Cardille et al., 2002;Goldewijk, 2001;Ramankutty and Foley, 1999). These studies suggest that over the last 50 years, land use changes have increased impacting the biosphere more than at any other period in human history (Board, 2005). The loss offloodplains to ur-banisation is also well documented,Dewan and Yamaguchi (2009), reported a loss of 31% of rivers andfloodplains to urbanisation in Dhaka, Bangladesh, whilstAmoateng et al. (2018)showed an 83% loss of rivers andfloodplains between 1985 and 2103 in Kumasi, Ghana. These statistics support the view thatfloodplain condition and func-tionality is in a critical situation across Europe (Wenger et al., 1990;
Klimo and Hager, 2001;Buijse et al., 2002).
Dynamic landscapes exhibit high spatial and temporal environ-mental heterogeneity and strong speciosity (Connell, 1978). Naturally
https://doi.org/10.1016/j.catena.2018.11.018
Received 9 July 2018; Received in revised form 8 November 2018; Accepted 14 November 2018 ⁎Corresponding author.
E-mail address:[email protected](N.S. Entwistle).
0341-8162/ © 2018 The Authors. Published by Elsevier B.V. This is an open access article under the CC BY-NC-ND license (http://creativecommons.org/licenses/BY-NC-ND/4.0/).
functioningfluvial systems represent some of the most dynamic land-scapes on the planet, have a very high conservation value (Ratcliffe, 1977). They also display some of the highest biological productivity and ecosystem diversity on Earth (Tockner and Stanford, 2002), prin-cipally due to their dynamic behaviour and also their transitional nature as they form the ecotone between terrestrial and aquatic en-vironments. However, when the natural dynamics offloodplain systems are subdued or lost the system becomes dysfunctional and the loss of dynamism results in environmental homogeneity and stasis. Diversity is reduced under such conditions with the landscape becoming dominated by a few key species best adapted to the imposed conditions (Stanford et al., 1996).
Functionalfloodplains are controlled by a diverse set of processes.
Amoros and Roux (1988) andJunk et al. (1989) found that fl ood-controlled disturbances stimulate geomorphic processes and promote vegetative succession to help form complex and dynamic spatial vege-tation mosaics related tofloodplain morphology.Thoms (2003) eluci-dated further on the controls on diversity noting the role of surface and subsurface hydrological regime and disturbance processes and historic geomorphological activity is also important in influencing thefl ood-plain template (Nanson and Croke, 1992). Of principal importance across valley bottom areas are functional wetland habitats including fen, marsh, swamp, bog and reeds. All of these are currently threatened globally (van Diggelen et al., 2006).
Severefloodplain degradation is widespread, linked to the habitat fragmentation and associated process disruption impacting the overall integrity offluvial ecosystems (Dynesius and Nilsson, 1994;Schiemer, 1999;Tockner et al., 2008) and ecology (Junk, 1997). This degradation is principally associated with human intervention and has resulted in a severe and rapid decline in freshwater biodiversity. Direct habitat al-teration linked to land use, drainage manipulation andflood control are the principal impact mechanisms (Krause et al., 2011; Tockner and Stanford, 2002; Zedler and Kercher, 2005), however, water pollution and the spread of invasive species have also contributed.
River degradation has been quantified across Great Britain fol-lowing the European Water Framework Directive (WFD). Water bodies are initially categorised as ‘artificial’, ‘heavily modified’ and ‘near natural’ (non-designated dependent on their degree of alteration). Statistics provided by the UK Joint Nature Conservation Committee (Fig. 1) illustrate the generally poor state of UK rivers, only 31% of water bodies are currently achieving‘Good’ecological status/potential and almost no change in status level has been reported throughout the period of operation of the directive. It is interesting to note, in the context of this paper, that the classification process concentrates on in-channel condition, largely ignoringfloodplain presence and this lack of consideration will undoubtedly seefloodplains further ignored as part of the current WFD driven restoration agenda.
Lewin (2013)observed that floodplain degradation has been oc-curring for the last 400 years and notes how the disruption to geo-morphological process associated with the disconnection of rivers from theirfloodplains impacts patterns of erosion and deposition influencing channel dynamics and alteringflood risk.Seager et al. (2012)assessed the general physical character of rivers and streams across England and Wales in 1995–1996 and 2007–2008. From a stratified random sample of the 4849 River Habitat Survey sites they estimated that only 11% of river length was ‘near-natural’, this figure rose to 25% when only predominantly unmodified reaches were included. Due to the failure of River Habitat Survey protocol to consider floodplain character this component of thefluvial system was neglected. A single river study by
Bentley et al. (2016)reported reduced hydromorphic diversity along an historically modified length of the River Wharfe. Theirfindings suggest that recent and historic direct and indirect human modification of channel morphology have severely impacted system form and beha-viour.
Further insight into wider modification tofloodplain areas was re-ported byHeritage et al. (2016)in their investigation of eight rivers in England and Wales, where theirfloodplain connectivity and land use
findings suggest that historic engineering and current management of both the channel and valleyfloor has been significantly impacted even on these high value systems. Floodplains along all eight watercourses exhibited a loss of geomorphic functionality and natural habitat due to farming.
These studies may be contextualised into the wider understanding of floodplain evolution through the Holocene. The character of UK
floodplains has been shown to have changed significantly since the last ice age (~11 ka), responding to climatic change and anthropogenic influences (Hoffmann et al., 2008;Brown et al., 2013;Macklin et al., 2014). Climate driven change is most closely associated with early Holocenefloodplain response withMacklin et al. (2014)identifying 15
flood rich periods in the UK sedimentary record andHoffmann et al. (2008) recognising 9 for Germany. Of these, only 4 are coincident suggesting more local geographical influence on system response and this is supported by Johnstone et al. (2006) who demonstrate the greater sensitivity toflooding of upland over lowland UK catchments.
Brown et al. (2018)note the presence of stable multi-thread channel systemsflowing over woodedfloodplains through until the Bronze Age (around 2500 BCE), where forest clearance and cultivation led to ex-tensivefine sediment delivery and storage across valley bottoms. Sub-sequent intensification of agriculture has allowed this development to persist through to the present day often with several metres offine sediment alluviation present acrossfloodplain surfaces (see for example the River Culm and the River Frome presented inBrown et al., 2018).
Lespez et al. (2011)also note increasingfine sediment alluviation in the form of overbank deposits burying organic deposits and leading to the loss of extensive wetland habitat across Western Europe principally from the Iron Age onwards (800 BCE). The persistence of this wide-spread transformation tofloodplain character is linked to cultivation induced fine sediment supply increase intensified by the subsequent persistence of this sediment as Colluvial and alluvial deposits (see
Brown et al., 2013).
As such,floodplains in the UK and Europe have experienced allu-viation and indirect and direct transformation of functional habitat over at least the last 3000 years, more recently this has intensified and this paper attempts to document these impacts with reference tofloodplain habitat change over the period 1990–2015. It adopts a GIS-based ap-proach to quantify land use change within 100-yearflood zone outline analysing the impact of agricultural practices onfloodplain character over this 25 year period.
2. Method
[image:3.595.40.287.569.729.2]The methodology adopted by this study involved three key stages. Firstly,floodplain areas were attributed to the rivers of England. The
Fig. 1.Water Framework Directive status summary for UK Rivers (2008–2015).
N.S. Entwistle et al. Catena 174 (2019) 490–498
Ordnance SurveyOpen Riversvector line dataset (version 04/2017) was used to define the river network, with individual rivers delineated by
‘watercourse name’. To make the size of the dataset more manageable, only rivers in England where the word‘River’precedes the name were considered; therefore, including most major rivers and excluding minor tributaries. This resulted in a total of 807 watercourses being analysed; representing 24,055.42 km of England's river network. To establish the
floodplain extent, 100-year return period inundation mapping was used (Environment Agency Flood Zone 3). Thefloodplain was segmented by river using buffers, so that each river has an associatedfloodplain area. The buffer search distance was 1000 m on either side of the river, meaning that any floodplain areas with bottom widths larger than 2000 m were excluded from analysis. Although this is a limitation, in practice only 2% of the total number of rivers analysed were affected by taking this approach. Furthermore, the focus of this paper is on com-paring land usechange; the spatial area analysed for this majority da-taset remained the same throughout the analysis to facilitate this comparison. The analysis described below generated data on over 6700 km2of England'sfloodplain area.
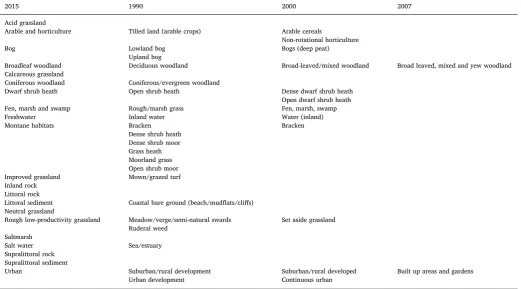
Secondly, land cover data was sourced and standardized over the 1990–2015 period. Land cover data for England was provided by Centre of Ecology and Hydrology (CEH), for the years 1990, 2000, 2007 and 2015 (Fuller et al., 1994, 2002;Morton et al., 2011;Rowland et al., 2017). The 1990 version is only available as a 25 m raster, this dataset therefore required vectorization prior to analysis. Using the habitat codes, habitat descriptors were added to the 1990 and 2000 datasets, sourced from CEH documentation. Comparison of the land cover cate-gories across the four data sets revealed an inconsistency in land cover type categories over the 25-year period. For example, additional divi-sions were used in 1990 and 2000, compared with the 2007 and 2015 data. It was therefore necessary to standardize the classes between the datasets to facilitate direct comparison of the land cover extents. The categories defined in the 2015 data were used as a template, and the
1990, 2000 and 2007 land cover types were appropriately matched to the schema. This resulted in the changes shown inTable 1.
Finally, these datasets were then analysed together to generate statistics relating tofloodplain character. The riverfloodplain polygons were intersected with the land cover data (Fig. 2), and then summarized by land cover type to calculate totalfloodplain land cover area for each category. This was then used along with the total area of each river
floodplain, to determine the percentage cover of each land cover type by river, for the four dates. This allowed the percentage change in
floodplain land cover to be assessed and the same workflow was fol-lowed to calculate percentage cover rationalised to WFD water body. 3. Results
2015 areal coveragefigures for allfloodplain in England (Fig. 3) suggests that around 65% of the total floodplain area has been ex-tensively altered due to agriculture. Prominent changes were to arable and horticulture with improved grazing also severely impacting natural
floodplain ecology. Fen, marsh, swamp and bog, habitats more char-acteristic of functionalfloodplains, have been reduced to just over 0.5% of totalfloodplain area. Simple presence/absence analysis of the 2015 data set. The results (Fig. 3) support the distribution statements made previously. Natural fen, marsh and swamp habitat, was recorded on only 102 watercoursefloodplains, (< 18% of the total present). All but two rivers (99.6%) are impacted to some degree by agriculture.
[image:4.595.39.561.455.744.2]The 2015 data has also been used to investigate the spatial pattern of land use (Fig. 4), revealing the distribution and dominance of each category across England. Natural fen, marsh, swamp and bog is now extremely sparsely distributed across the country and, where present, it forms only a small fraction of each floodplain area (Fig. 4a). This contrasts strongly with the distribution offloodplain under arable use (Fig. 4b), this land use type dominates across the area around the Wash, Lincolnshire & Humberside, where coverage often exceeds 75% of each
Table 1
Required changes to historic land cover nomenclature to facilitate comparison over time. Thefirst column shows 2015 land cover categories which were used in this analysis. The subsequent columns document the original land cover categories from previous datasets (1990, 2000, 2007) that were amended to match 2015.
2015 1990 2000 2007
Acid grassland
Arable and horticulture Tilled land (arable crops) Arable cereals
Non-rotational horticulture
Bog Lowland bog
Upland bog
Bogs (deep peat)
Broadleaf woodland Deciduous woodland Broad-leaved/mixed woodland Broad leaved, mixed and yew woodland Calcareous grassland
Coniferous woodland Coniferous/evergreen woodland
Dwarf shrub heath Open shrub heath Dense dwarf shrub heath
Open dwarf shrub heath
Fen, marsh and swamp Rough/marsh grass Fen, marsh, swamp
Freshwater Inland water Water (inland)
Montane habitats Bracken
Dense shrub heath Dense shrub moor Grass heath Moorland grass Open shrub moor
Bracken
Improved grassland Mown/grazed turf
Inland rock Littoral rock
Littoral sediment Coastal bare ground (beach/mudflats/cliffs) Neutral grassland
Rough low-productivity grassland Meadow/verge/semi-natural swards Ruderal weed
Set aside grassland
Saltmarsh
Salt water Sea/estuary
Supralittoral rock Supralittoral sediment
Urban Suburban/rural development
Urban development
Suburban/rural developed Continuous urban
riverfloodplain. Rough grassland, a valuable dryerfloodplain habitat, is found mostly in the north and west of England (Fig. 4c). Where present it is patchy and sub-dominant with coverage levels generally below 25% of the totalfloodplain for each river.
Dominance of a particular land use type at a local scale was in-vestigated through extraction of the frequency of areal coverage cate-gories across all rivers for 2015 data. It is clear (Table 2) that almost all fen, marsh, swamp and bog is present at coverages below 1% across individualfloodplain areas. Most individualfloodplains exhibit neutral grassland cover of between 5 and 10% but this is still an unnaturally lowfigure. These statistics contrast with the strong dominance of arable and improved grassland which cover between 40% and 95% of most individualfloodplains. (SeeTable 3.)
Changes in floodplain land use were investigated for the period between 1990 and 2015. Farming as represented by arable, horticulture and pasture (Fig. 5a) shows a clear shift in distribution toward more intensive land usage over time with the majority of rivers displaying coverage values of between 15% and 60% in 1990 rising to between 35% and 75% in 2000 before the rate of change lessens to occupy
between 65% and 95% of overallfloodplain area in 2007 and 80% to 95% 2015.
In stark contrast, wetland area (Fen, marsh, swamp and bog) was already severely reduced over natural by 1990 (Fig. 5b) with the ma-jority of rivers displaying coverage of between 1% and 3% of total
floodplain. Even these low values show a further significant reduction through to 2000 with percentage coverage reduced to below 1% on almost all rivers throughout England. The 2007 and 2015 land cover surveys show no significant change from the position in 2000. Un-cultivated rough grassland shows similar trends with much greater areal coverage (15–50% by river) measured in 1990 declining to be-tween 5 and 10% for the majority of rivers by 2000 and < 5% for 2007 and 2015 (Fig. 5c).
[image:5.595.69.512.57.290.2]Also of interest is the degree to which individual rivers have changed their land use pattern, only 38 English rivers have shown an overall reduction in farmed area (Fig. 6a) with losses of generally < 10% whilst the rest of the rivers have seen farming use increase in the 25 year data record, most by 2 to 25% but some by as much as 80%. Wetland change over this period has seen the majority of rivers remain
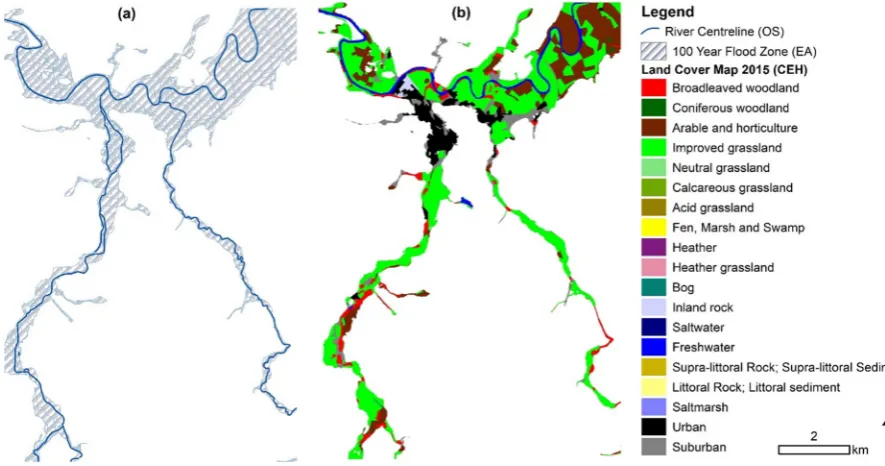
Fig. 2.GIS analysis offloodplains in England, by combining (a) a river centerline (to delineate the individual rivers) (© Crown copyright) and the 100-yearflood zone extent (© Environment Agency) with (b) historic land cover maps (2015 shown here) (© NERC).
Fig. 3.Floodplain land use in 2015 averaged across all rivers in England.
N.S. Entwistle et al. Catena 174 (2019) 490–498
[image:5.595.125.470.327.508.2]static (Fig. 6b) with 48 showing some improvement and a similarfigure showing an equal decline.
4. Discussion
Data published by Newbold (1998) covered lowland floodplains which were estimated to originally cover some 2,000,000 ha but which had been reduced by 86% to 274,000 ha by the 1980s. Of this area only some 46,600 ha of floodplain remain protected under SSSI status (Newbold 1998). He argued that functional floodplain loss up to the 1980's was principally due to drainage which also impacts significantly on the ecology. Bailey (1998) noted at the time that the impact of agriculture onfloodplain form and function had yet to be quantified. More recent studies (Foley et al., 2005;Gibbs et al., 2008;Gibbs and Salmon, 2015; Lambin and Meyfroidt, 2011) reveal that farming of
floodplains has led to significant losses of biodiversity, reduced their role in flood mitigation, increased soil loss are and reduced carbon storage.
This paper presents a comprehensive nationwide assessment of current (2015)floodplain condition and trends of change (since 1990)
for England. It has used land use andfloodplain area information to-gether to analyse of the degree offloodplain alteration away from a natural connected river and overbank system characterised by fen marsh, swamp and bog, toward impacted, heavily managed systems characterised by improved grassland and arable land use. The data reveals the near complete destruction of functional wetland habitat. Only small, and highly isolated remnant areas now remain occu-pying < 0.5% offloodplain area on less than a quarter of English wa-tercourses.
[image:6.595.76.525.54.253.2]Newbold (1998)estimated there was originally some 2,000,000 ha of lowlandfloodplain in the UK which had been reduced by 86% to 274,000 ha by the turn of the century. This study has found that the 100-year return period flood zone mapping developed by the En-vironment Agency covers approximately 563,519 ha of the UK land surface (including uplandfloodplains) of which only around 0.5% is now functional wetland (~3000 ha). The decline even since 1990 when there was 1.8% of floodplains covered in wetland has been severe especially when placed in an ecological context and suggests that the generalfigures provided byTockner and Stanford (2002)that in Europe and North America, “….up to 90% of floodplains are already
Fig. 4.Floodplain land-use maps for England (a) Fen, marsh and swamp (black) and Bog (Red), (b) Arable and Horticultural (Black) and Improved grassland (Red) (c) Rough grassland. (For interpretation of the references to color in thisfigure legend, the reader is referred to the web version of this article.)
Table 2
Variation in percentage area for key land use types 2015, (inset providing further detail at lower percentage land cover types).
Arable and horticulture Bog Fen marsh and swamp Improved grassland Neutral grassland Urban Fen marsh swamp bog Arable and pasture
0 9.12 92.34 81.39 1.28 51.28 5.47 0.00 0.00
5 21.72 6.93 16.79 3.28 40.33 47.81 97.45 2.74
10 17.34 0.18 0.73 4.01 4.38 20.07 0.91 2.01
15 11.13 0.18 0.55 3.10 2.01 7.85 0.73 1.46
20 6.02 0.00 0.00 4.38 0.73 3.65 0.00 1.28
25 6.39 0.00 0.18 4.93 0.36 3.83 0.18 2.55
30 4.74 0.18 0.00 6.20 0.18 2.37 0.18 2.37
35 4.56 0.18 0.00 7.12 0.36 1.82 0.18 3.10
40 4.01 0.00 0.18 7.30 0.36 1.46 0.18 3.83
45 2.74 0.00 0.18 6.57 0.00 1.09 0.18 3.65
50 3.28 0.00 0.00 5.84 0.00 0.91 0.00 4.38
55 2.19 0.00 0.00 8.58 0.00 0.91 0.00 3.83
60 2.37 0.00 0.00 7.85 0.00 0.55 0.00 5.11
65 0.91 0.00 0.00 5.84 0.00 0.55 0.00 6.39
70 0.55 0.00 0.00 7.66 0.00 0.73 0.00 6.93
75 0.36 0.00 0.00 4.93 0.00 0.36 0.00 7.48
80 0.55 0.00 0.00 3.83 0.00 0.00 0.00 8.76
85 1.09 0.00 0.00 3.83 0.00 0.00 0.00 9.85
90 0.18 0.00 0.00 1.64 0.00 0.36 0.00 9.12
95 0.55 0.00 0.00 1.46 0.00 0.18 0.00 10.95
[image:6.595.41.557.538.745.2]‘cultivated’ and therefore functionally extinct” is likely an under-estimate for English rivers. The land drainage grants of the 1970's saw 84,000 ha drained with no measurable increase in agricultural yield (Purseglove, 1998) and it would appear that although such grants fell away in the 1980's the loss of wetland has continued through to 2000 and our current attempts to improve watercourse form and function through restoration is having no significant measurable impact on
floodplain form and function.
Biodiversity can only be improved through increasing species numbers and extending species distribution (Andrewartha and Birch, 1954). This requires provision of the resources that are needed by an-imals and plants in order to reproduce and functional habitat is primary in this regard.Tockner and Stanford (2002)emphasised the urgent need to preserve existing, intactfloodplain rivers and to restore functionality to those rivers that retain some level of ecological integrity. It would appear from the data on Englishfloodplains that few if any systems fall into these categories due to the levels of change to geomorphological and ecological character and functionality. Plant and animal species associated with English river systems are already under extreme pres-sure and many have gone extinct on systems where they were formerly present. The prediction of a dramatic reduction and loss offloodplain species in thefirst 20 years of this millennium made byTockner and Stanford (2002) has already actually occurred across England in the 20th century linked to human induced changes to form and function.
Gibbs and Salmon (2015)note the inevitability offloodplain de-gradation as a result of agricultural expansion. Here, our analysis for Englishfloodplains goes further, revealing how changing agricultural practices has resulted in progressive degradation offloodplain ecosys-tems with trends of increasingfloodplain homogenisation and the loss of nearly all functionalfloodplain habitats. Similarly, the link between subdued system dynamics and a loss of diversity made by Connell (1978)is amply demonstrated by the results presented here. The de-struction of both natural habitat and system functionality across English
floodplains has resulted in a major reduction in biodiversity and this is further exacerbated by active land-use manipulation to further suppress the natural functioning of river andfloodplain systems, most notably throughflood management suppressingfloodplain system functioning and through alterations to the lowflow regime impacting water table levels across thefloodplain.
River biota are often well adapted to rapid change and populations impacted locally by an event such as aflood may be replaced by re-colonisers moving in from refuge areas along the system once
[image:7.595.309.557.50.535.2]conditions return within more normal bounds. However, all species function within natural environmental limits and when these limits are exceeded, particularly for long periods of time or where they are par-ticularly severe, then species cannot adapt and are no longer able to survive (Stanford et al., 1996). Such a situation is now near ubiquitous across Englishfloodplains for almost all nativefloodplain species. Di-versity has been decimated as environmental controls have been altered and are maintained in such a way that any return to natural levels is prohibited. The preponderance of a near homogenous landscape, where natural processes are almost completely suppressed and will continue to be suppressed through active management, offers little hope of any return to a more natural, dynamic and diverse system unless agri-cultural practices, not just onfloodplains but also across the wider catchment are fundamentally altered. Small scale restoration may partially restore some river andfloodplain processes, but suppression
Table 3
Percentage cover of arable, horticulture and Improved grassland for all Good status river water bodies in England (2015 data).
Arable & horticulture Improved grassland Both
0 0.00 0.00 0.00
5 21.28 3.72 1.86
10 15.96 4.52 1.60
15 13.56 5.05 2.13
20 7.18 2.93 2.93
25 9.04 3.46 1.06
30 5.05 5.59 1.33
35 7.71 5.05 2.66
40 3.99 5.05 2.93
45 2.93 4.79 2.39
50 2.93 9.31 4.52
55 1.86 5.85 5.59
60 0.80 6.38 5.05
65 1.86 6.65 7.45
70 0.27 3.72 6.12
75 0.80 6.12 6.65
80 0.53 5.85 7.45
85 1.06 4.26 5.32
90 0.00 4.52 9.84
95 0.80 1.60 5.59
100 1.06 2.13 9.04
Fig. 5.Temporal change (1990–2015) in (a) farmed area, (b) wetland and (c) rough grassland measured as a percentage of total individualfloodplain area across the 550 main river systems in England.
N.S. Entwistle et al. Catena 174 (2019) 490–498
[image:7.595.40.289.88.293.2]elsewhere will mean that ecological gains remain highly localised and fundamentally unsustainable into the long term.
The impact offloodplain neutering has been shown to extend be-yond the valley bottom to influence the ecology of the watercourse.
Aarts et al. (2004)demonstrated that overall,fish species richness and diversity declined with decreasing hydrological connectivity. This is most true for specialist rather than more generalistfish species resulting in a loss of biodiversity and one or two species proliferate. As such attempts to improve riverinefisheries must also consider the condition of thefloodplain. It is suggested that ourfindings of near complete and persistent natural habitat loss across Englishfloodplains is hampering the recovery of many watercourse fisheries and future efforts must concentrate on restoring floodplain as well as in-channel form and functionality.
The level of natural floodplain habitat destruction demonstrated here and in previous studies (Tockner et al., 2008;Heritage et al., 2016;
Seager et al., 2012) amply demonstrate the serious loss offloodplain natural structure and functionality principally as a result of anthro-pogenic modification of rivers andfloodplains. It is argued that this near complete loss of geomorphological and ecological functionality ranks alongside the changes from braided to anastomosed and anasto-mosed to alluviating single thread systems discussed by Brown et al. (2018)marking a fundamental state change.
5. Conclusions
Humans have long influenced valley bottom ecosystems with
impacts recorded consistently across Europe since the Bronze Age (Brown et al., 2018), consistently suppressing the ecosystem dynamics and associated landscape disturbance regimes that sustain habitats, and biotic communities leading to permanent loss of environmental het-erogeneity and biodiversity (Warren and Liss, 1980). This was re-iterated byStanford et al. (1996)who note that the proper functioning of a river andfloodplain system requires that processes operating across these environments are appropriately connected. When these are sev-ered biodiversity is reduced. It would appear from the data presented earlier that biodiversity across English floodplains has been sub-stantively reduced and, by inference, the same can most likely be said for the river environment. It would appear that agriculture practices have not only impactedfloodplain habitat character but have also im-pacted the process operating to maintain river and floodplain func-tioning. Only by addressing the impacts on controlling processes will physical attempts to restore floodplain systems achieve success.
Stanford et al. (1996)also classify long term changes to river basins into three categories, water pollution, food web manipulation and imposi-tion of barriers impacting on temperature and materials fluxes. The severing of riverine ecosystem connectivity is known to occur in all three spatial planes and is probably the most persistent influence by humans on river landscapes world-wide (Dynesius and Nilsson, 1994). This is certainly confirmed by the data presented in this paper in the case of Englishfloodplains with majorflow and sediment transfer dis-continuities impacting laterally to degradefloodplain form and function and impact on biodiversity.
[image:8.595.139.468.55.427.2]England has been described as a crowded country where there is a
need to strike a balance between competing demands on limited land space (Pardoe et al., 2011). Whilst Nilsson et al. (2005)claimed that
flow regulation represented the most pervasive change wrought by humans on fluvial systems world-wide. In the case of England and probably for many other countries where agricultural intensification has occurred this is probably rivalled by the impact that farming has had on floodplain form and process. It was responsible for the state change to heavily alluviated valley bottoms from the Bronze Age on-wards (Macklin et al., 2014) and more recently for the loss of functional geomorphic units and associated habitats and biodiversity demon-strated in this paper.
The near complete alteration of Englishfloodplains suggests that the resultant changes tofloodplain form and dynamics are now so severe that naturalisation may now be impossible. At best, current attempts to redress the balance through restoration will mean that we will end up with a set of isolated floodplain sites where partial morphologic storation will have occurred. These sites may also display partial re-storation of system functionality, however the eventual influence of persistent wider perturbations will mean that any increase in species richness will deteriorate and these sites will require increasing un-forecast local management to persist. Such a conclusion is stark offering little hope of ever significantly reversingfloodplain and wider linked
fluvial system degradation despite concerted local effort. Contemporary human influence and land manage practice over historic time is to blame for this situation and it is clear from the trends in the data pre-sented that little appears to have improved over the last 25 years de-spite initiatives and subsidies targeted at improving farming practices to impact less on the environment.
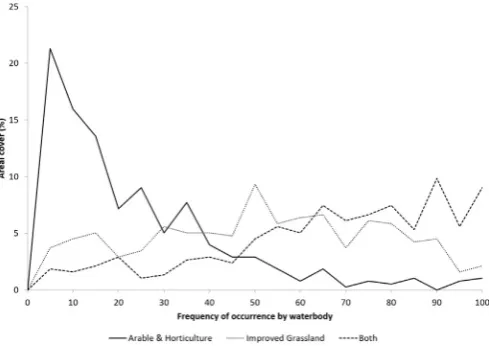
It is useful to review thefigures above with the Water Framework Directive measure of river quality. The land use data for 2017 was further broken down according to current water body status generating 2975 auditable units. Each water body has an assigned status those at
“Good”status (375 units) were selected.Fig. 7illustrates the areal cover distribution for Arable and horticultural land use and improved grass-land as a percentage of the overall water bodyfloodplain area. Arable and horticulture covers in excess of 50% of the floodplain area on around 15% of Good status water bodies, this increases to around 50% for area under improved grassland and when the two are considered together between 70 and 75% of Good status waterbodies are covered by at least 50% farm land. Around half of these water bodies are utilised over 90% by farming.
These data are a stark reflection of the failure of the Water Framework Directive standards currently employed in England to consider thefloodplain as part of the assessment. This has resulted in water bodies being classified at Good ecological status when their
floodplain condition is almost certainly significantly degraded and their
floodplain functionality lost. Acknowledgements
The authors would like to acknowledge thefinancial support for this work provided by Co-op Insurance, and the provision of raw data by the UK Environment Agency and the Centre for Ecology and Hydrology. Constructive anonymous reviews helped rationalise the paper content. References
Aarts, B.G., Brink, F.W., Nienhuis, P.H., 2004. Habitat loss as the main cause of the slow recovery offish faunas of regulated large rivers in Europe: the transversalfloodplain gradient. River Res. Appl. 20 (1), 3–23.
Amoateng, P., Finlayson, C.M., Howard, J., Wilson, B., 2018. Dwindling rivers and
floodplains in Kumasi, Ghana: A socio-spatial analysis of the extent and trend. Appl. Geogr. 90, 82–95.
Amoros, C., Roux, A.L., 1988. Interaction between water bodies within thefloodplains of large rivers: function and development of connectivity. In: Schreiber, K.F. (Ed.), Connectivity in Landscape Ecology. 29. Münstersche Geographische Arbeiten, Paderborn, Germany, pp. 125–130.
Andrewartha, H.G., Birch, L.C., 1954. The Distribution and Abundance of Animals. University of Chicago Press, Chicago (281 pp.).
Bailey, R.G. (Ed.), 1998. United Kingdom Floodplains. Westbury Acad. and Scientific Publ..
Bentley, S.G., England, J., Heritage, G.L., Reid, H., Mould, D., Bithell, C., 2016. Long-reach biotope mapping: deriving lowflow hydraulic habitat from aerial imagery. River Res. Appl. 32 (7), 1597–1608.https://doi.org/10.1002/rra.3000.
Board, M.A., 2005. Millennium ecosystem assessment. New Island, Washington, DC, pp. 13.
Brown, A., Toms, P., Carey, C., Rhodes, E., 2013. Geomorphology of the Anthropocene: time-transgressive discontinuities of human-induced alluviation. Anthropocene 1, 3–13.
Brown, A.G., Lespez, L., Sear, D.A., Macaire, J.J., Houben, P., Klimek, K., ... Pears, B., 2018. Natural vs anthropogenic streams in Europe: history, ecology and implications for restoration, river-rewilding and riverine ecosystem services. Earth Sci. Rev.
Buijse, A.D., Coops, H., Staras, M., Jans, L.H., Van Geest, G.J., Grift, R.E., Ibelings, B.W., Oosterberg, W., Roozen, F.C., 2002. Restoration strategies for riverfloodplains along large lowland rivers in Europe. Freshw. Biol. 47 (4), 889–907.
Cardille, J.A., Foley, J.A., Costa, M.H., 2002. Characterizing patterns of agricultural land use in Amazonia by merging satellite classifications and census data. Global Biogeochem. Cycles 16 (3).
Connell, J.H., 1978. Diversity in tropical rain forests and coral reefs. Science 199, 1302–1310.
Dewan, A.M., Yamaguchi, Y., 2009. Land use and land cover change in Greater Dhaka, Bangladesh: using remote sensing to promote sustainable urbanization. Appl. Geogr. 29, 390–401.
van Diggelen, R., Middleton, B., Bakker, J., Grootjans, A., Wassen, M., 2006. Fens and
floodplains of the temperate zone: present status, threats, conservation and restora-tion. Appl. Veg. Sci. 9 (2), 157–162.
Dynesius, M., Nilsson, C., 1994. Fragmentation andflow regulation of river systems in the northern third of the world. Science 266, 753–762.
Erwin, K.L., 2009. Wetlands and global climate change: the role of wetland restoration in a changing world. Wetl. Ecol. Manag. 17 (1), 71.
Foley, J.A., DeFries, R., Asner, G.P., Barford, C., Bonan, G., Carpenter, S.R., ... Helkowski, J.H., 2005. Global consequences of land use. Science 309 (5734), 570–574.
Fuller, R.M., Groom, G.B., Jones, A.R., 1994. The Land Cover Map of Great Britain: an automated classification of Landsat Thematic Mapper data. Photogramm. Eng. Remote. Sens. 60, 553–562.
Fuller, R.M., Smith, G.M., Sanderson, J.M., Hill, R.A., Thomson, A.G., 2002. The UK Land Cover Map 2000: construction of a parcel-based vector map from satellite images. Cartogr. J. 39, 15–25.
Gibbs, H.K., Salmon, J.M., 2015. Mapping the world's degraded lands. Appl. Geogr. 57, 12–21.
Gibbs, H.K., Johnston, M., Foley, J.A., Holloway, T., Monfreda, C., Ramankutty, N., Zaks, D., 2008. Carbon payback times for crop-based biofuel expansion in the tropics: the effects of changing yield and technology. Environ. Res. Lett. 3 (3), 034001.
Goldewijk, K.K., 2001. Estimating global land use change over the past 300 years: the HYDE database. Global Biogeochem. Cycles 15 (2), 417–433.
Heritage, G.L., Entwistle, N.S., Bentley, S., 2016. Floodplains: the forgotten and abused component of thefluvial system. In: FLOODrisk 2016 3rd European Conference on Flood Risk Management Innovation, Implementation, Integration.
Hoffmann, T., Lang, A., Dikau, R., 2008. Holocene river activity: analysing 14C-dated
fluvial and colluvial sediments from Germany. Quat. Sci. Rev. 27 (21-22), 2031–2040.
Johnstone, E., Macklin, M.G., Lewin, J., 2006. The development and application of a database of radiocarbon-dated Holocenefluvial deposits in Great Britain. Catena 66 (1-2), 14–23.
[image:9.595.41.286.56.229.2]Junk, W.J., 1997. General aspects offloodplain ecology with special reference to Amazonianfloodplains. In: The Central Amazon Floodplain. Springer, Berlin, Heidelberg, pp. 3–20.
Fig. 7.Percentage of arable, horticulture and Improved Grassland for all good status river water bodies in England (2015 data).
N.S. Entwistle et al. Catena 174 (2019) 490–498
Junk, W.J., Bayley, P.B., Sparks, R.E., 1989. Theflood pulse concept in river-floodplain systems (2001) In: Klimo, E., Hager, H. (Eds.), The Floodplain Forests in Europe.
Klimo, E., Hager, H. (Eds.), 2001. The Floodplain Forests in Europe: Current Situations and Perspectives. 10 Brill.
Krause, B., Culmsee, H., Wesche, K., Bergmeier, E., Leuschner, C., 2011. Habitat loss of
floodplain meadows in north Germany since the 1950s. Biodivers. Conserv. 20 (11), 2347–2364.
Lambin, E.F., Meyfroidt, P., 2011. Global land use change, economic globalization, and the looming land scarcity. Proc. Natl. Acad. Sci. 108 (9), 3465–3472.
Lespez, L., Drezen, Y., Garnier, A., Rasse, M., Eichhorn, B., Ozainne, S., ... Huysecom, E., 2011. High-resolutionfluvial records of Holocene environmental changes in the Sahel: the Yamé River at Ounjougou (Mali, West Africa). Quat. Sci. Rev. 30 (5-6), 737–756.
Lewin, J., 2013. Enlightenment and the GMfloodplain. Earth Surf. Process. Landf. 38 (1), 17–29.
Macklin, M.G., Lewin, J., Jones, A.F., 2014. Anthropogenic alluvium: an evidence-based meta-analysis for the UK Holocene. Anthropocene 6, 26–38.
Mitsch, W.J., Gosselink, J.G., 2000. Wetlands. Wiley, New York, USA.
Morton, D., Rowland, C., Wood, C., Meek, L., Marston, C., Smith, G., Simpson, I.C., 2011. Final report for LCM2007–the new UK land cover map. In: CS Technical Report No 11/07 NERC/Centre for Ecology & Hydrology, (108 pp.).
Nanson, G.C., Croke, J.C., 1992. A genetic classification offloodplains. Geomorphology 4 (6), 459–486.
Newbold, C., 1998. The nature conservation importance offloodplains in England and Wales–with particular reference to theirflora. In: United Kingdom Floodplains, pp. 171–183.
Nilsson, C., Reidy, C.A., Dynesius, M., Revenga, C., 2005. Fragmentation andflow reg-ulation of the world's large river systems. Science 308 (5720), 405–408.
Olson, D.M., Dinerstein, E., 1998. The Global 200: a representation approach to conser-ving the Earth’s most biologically valuable ecoregions. Conserv. Biol. 12 (3), 502–515.
Pardoe, J., Penning-Rowsell, E., Tunstall, S., 2011. Floodplain conflicts: regulation and negotiation. Nat. Hazards Earth Syst. Sci. 11 (10), 2889–2902.
Petts, G.E., Möller, H., Roux, A.L., 1989. Historical Change of Large Alluvial Rivers:
Western Europe.
Purseglove, J., 1998. Taming the Flood: History and Natural History of Rivers and Wetlands. Oxford University Press, Oxford, U.K.
Ramankutty, N., Foley, J.A., 1999. Estimating historical changes in global land cover: croplands from 1700 to 1992. Global Biogeochem. Cycles 13 (4), 997–1027. Ramsar & IUCN, 1999. Wetlands and Global Change [www document]. URL. http://
www.ramsar.org/key_unfccc_bkgd.htm.
Ratcliffe, D., 1977. A nature conservation review: the selection of biolog. sites of national importance to nature conservation in Britain. 1 Cambridge University Press. Rowland, C.S., Morton, R.D., Carrasco, L., McShane, G., O'Neil, A.W., Wood, C.M., 2017.
Land Cover Map 2015 (vector, GB). NERC Environmental Information Data Centrehttps://doi.org/10.5285/6c6c9203-7333-4d96-88ab-78925e7a4e73.
Schiemer, F., 1999. Conservation of biodiversity infloodplain rivers. Arch. Hydrobiol. 11 (Supplement 115), 423–438 Large Rivers.
Seager, K., Baker, L., Parsons, H., Raven, P.J., Vaughan, I.P., 2012. The rivers and streams of England and Wales: an overview of their physical character in 2007–2008 and changes since 1995–1996. In: Boon, P.J., Raven, P.J. (Eds.), River Conservation and Management. Wiley, Chichester, pp. 29–43.
Stanford, J.A., Ward, J.V., Liss, W.J., Frissell, C.A., Williams, R.N., Lichatowich, J.A., Coutant, C.C., 1996. A general protocol for restoration of regulated rivers. Regul. Rivers: Res. Manage. 12 (4‐5), 391–413.
Thoms, M.C., 2003. Floodplain–river ecosystems: lateral connections and the implications of human interference. Geomorphology 56 (3), 335–349.
Tockner, K., Stanford, J.A., 2002. Riverineflood plains: present state and future trends. Environ. Conserv. 29, 308–330.
Tockner, K., Bunn, S.E., Gordon, C., Naiman, R.J., Quinn, G.P., Stanford, J.A., 2008. 4 Á Flood Plains: Critically Threatened Ecosystems.
Warren, C.E., Liss, W.J., 1980. Adaptation to aquatic environments. In: Lackey, Robert T., Nielsen, Larry A. (Eds.), Fisheries Management.
Wenger, E.L., Zinke, A., Gutzweiler, K.A., 1990. Present situation of the European
floodplain forests. For. Ecol. Manage. 33, 5–12.