Strategic Business Case
Planning and Regulation
Route Planning
New Lines
Contents
EXECUTIVE SUMMARY 1
1 INTRODUCTION 5
Context 5
New Lines Programme 5
Developing the Strategic Business Case 6
Business Case Report 10
2 APPROACH 11
Strategic Business Case 11
Strategic Assessment of Option 11
Risk 12
3 SCHEME DESCRIPTION 15
Overview of New Line Option Development 15
Technical Assumptions 15
Operating and Operation Planning Assumptions 17
Route Planning Assumptions 21
Stage 1: Conceptual Route Strategy 24
Stage 2: Developing the best performing Route Option 26
Creating the New Line Notional Timetables 30
Potential Service Additions to the Chosen New Line Scheme 32
Overview of Classic Lines Recast 33
Reference Case 34 4 COST MODELLING 35 Infrastructure Costs 35 Summary of Methodology 35 Key Assumptions 37 Results 38 Benchmarking of Costs 39
Infrastructure Operating, Maintenance and Renewals Costs 40
Classic Line Maintenance Costs 42
Operating Costs 42
Classic Line Operating Cost Changes 45
Results 46
Other Income 47
5 DEMAND, REVENUE AND BENEFIT FORECASTING 49
Overview of Approach 49
Current Rail Demand 51
Looking to the Future 51
The Impact of New Lines 52
Impact on Air Demand 60
Results Benchmarking 61
The Impact of the Classic Rail Recast 64
Tests of Robustness 69
Potential Model Refinements 74
Valuation of additional freight capacity 74
6 ECONOMIC ASSESSMENT 77 Introduction 77 Approach Overview 77 Benefits Approach 79 Financial impacts 80 Economic Results 80
Wider Economic Benefits 87
Tests of Robustness and Sensitivity Tests 88
7 HEATHROW OPTIONS 93
Connecting the New Line with Heathrow 93
The market for Heathrow New Line services 99
The demand impact of New Lines 102
The Case for New Lines serving Heathrow 105
8 HS1 OPTIONS 109
Introduction 109
Potential demand 110
Impacts on the case for New Lines 112
9 STATEMENT OF OUTPUTS 113
Introduction 113
Maximise competitiveness and productivity 113
Address climate change 114
Protect people’s safety, security and health 114
Improve quality of life 114
Promote greater equality of opportunity 116
Summary 117
10 ENVIRONMENTAL IMPACT ASSESSMENT 119
General Environmental Impact of a New Line 119
Issues Related to the chosen scheme 119
Assumptions 120
11 RISKS AND OPPORTUNITIES 123
Risks 123
Opportunities 128
12 CONCLUSIONS 131
Recommendation 132
Figures
Figure 0.1 Core New Line Service Options - High Level Results 2 Figure 0.2 Further Developed New Line Service Options – High Level Results 3
Figure 1.1 Developing the Strategic Business Case 6
Figure 1.2 Stage 1 Option Assessment: London to Manchester and Birmingham 8 Figure 1.3 Stage 2 Option Assessment: Strategic Business Case Options 9
Figure 2.1 Illustration of Forecast Uncertainty 12
Figure 3.1 Platform and Track Layout at Intermediate Stations 16 Figure 3.2 Net Present Value Of Components Assuming Different Speeds of
Operation 20
Figure 3.3 Assumed New Line Speed Profile 21
Figure 3.4 Route 1 Plan and Train service Specification for Options MB1.0a and
MB1.0b 25 Figure 3.5 Route 2 Plan and Train service Specification for Options MB2.0a, MB2.0b
and MB2.0c 25
Figure 3.6 Option MB1.1 Route Plan and Train Service Specification (TSS) 27 Figure 3.7 Options MB1.2 and MB1.4 Route Plans and Train Service Specification
Figure 3.8 Options MB1.2.1 and MB1.4.1 Train Service Specification (TSS) 29 Figure 3.9 Options MB1.3 and MB1.6 Route Plans and Train Service Specification
(TSS) 30
Figure 3.10 Option MB1.0b Outline Timetable 31
Figure 3.11 Option MB1.4.1 Outline Timetable 32
Figure 4.1 Methodology for Developing Capital Cost Estimates 36
Figure 4.2 Benchmark Infrastructure Costs 40
Figure 5.1 Modelling Suite 50
Figure 5.2 Source of London - Birmingham Demand 55
Figure 5.3 Source of London - Manchester Demand 55
Figure 5.4 Manchester Catchments 57
Figure 5.5 Source of London - Edinburgh Demand 60
Figure 5.6 Network RUS Economic Scenarios 70
Figure 5.7 Comparison of the Central Case Demand Forecast and the Network RUS
Scenario Demand Forecasts 71
Figure 6.1 Stage 1 Option Assessment: London to Manchester and Birmingham 77 Figure 6.2 Stage 2 Option Assessment: Strategic Business Case Options 78 Figure 6.3 Estimated NPV versus Expected Capital Cost of Scheme 87 Figure 7.1 Option MB1.5a Route Plan and Train Service Specification (TSS) 94 Figure 7.2 Option MB1.5b Route Plan and Train Service Specification (TSS) 95
Figure 7.3 Option MB1.7.1 Route Plan and TSS 96
Figure 7.4 Option MB3.4.1 Route Plan and Train Service Specification (TSS) 97 Figure 7.5 Assumed Heathrow Station Layout and Alternative Option 98
Figure 7.6 Heathrow Options Considered 99
Figure 7.7 2007 Domestic Demand at Heathrow 101
Tables
Table 3.1 Assumed Route 1 Distance Between New Line Station Pairs 19 Table 3.2 Impact of Alternative Line Speeds on Option MB1.0a 20 Table 3.3 Speed of Operation and BCR of Option MB1.0a 21 Table 3.4 Impact on Route Distance (to Manchester) of London Approach Corridor 23 Table 3.5 Comparison of Routes 1 and 2 Journey Times and Cost Drivers 26
Table 4.1 New Lines Options – Bills of Quantity 38
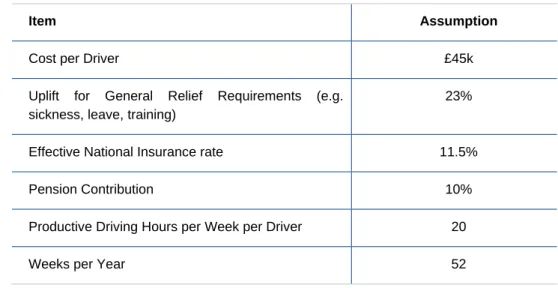
Table 4.3 Asset Life Estimates 41 Table 4.4 Calculation of Driver Cost Per Train Hour – Input Data 43
Table 4.5 Key Operating Cost Assumptions 44
Table 4.6 Train Service Assumptions 45
Table 4.7 Classic Line Service Changes that Impact Upon Operating Costs 46
Table 4.8 Operating Cost Estimates by Option 47
Table 5.1 2007 Rail Demand by Key Market To London 51 Table 5.2 Stage 1 New Line Demand (million journeys p.a. in 2030) 54 Table 5.3 2030 New Line Demand for Stage 2 Tests (million journeys p.a.) 58 Table 5.4 Impact of New Lines on (In-Scope) Air Demand (2030 million trips) 60
Table 5.5 Intercity Model vs PDFH Growth Factors 62
Table 5.6 Relative market size for the North West and Scotland in 2030 64 Table 5.7 Classic Line Model Results For Option MB1.0A-MB2.0C (millions 2030) 65 Table 5.8 Classic Line Model Results For Option MB1.1 (millions 2030) 66 Table 5.9 Classic Line Model Results For Option MB1.2.1 (millions 2030) 67 Table 5.10 Classic Line Model Results For Option MB1.3 (millions 2030) 67 Table 5.11 Classic Line Model Results For Option MB1.4.1 (millions 2030) 68 Table 5.12 Classic Line Model Results For Option MB1.6 (millions 2030) 68 Table 5.13 Summary of Classic Line Impacts (millions 2030) 69 Table 5.14 2030 New Line Demand Sensitivity Analysis (million journeys p.a.) 73
Table 6.1 Stage 1 Summary of Benefits 81
Table 6.2 Stage 1 Summary of Financial Impacts 82
Table 6.3 Stage 1 Summary of Economic results 83
Table 6.4 Stage 2 Summary of Benefits 84
Table 6.5 Stage 2 Summary of Financial Impacts 85
Table 6.6 Stage 2 Economic results summary 85
Table 6.7 Illustration of impact of WEBs on Economic Results FOR MB1.4.1 88 Table 6.8 BCR and NPV of Variant 1.4.1 Under the Network RUS Scenarios 89 Table 6.9 % Change in Business Case Components Required to Break the Case
for Option MB1.4.1 89
Table 6.10 Impact of Specific Risk Sensitivity Tests 90
Table 7.1 Heathrow Demand Summary (000’s) 102
Table 7.2 2030 Heathrow Access Demand Assuming Current Access Modes (000s) 102 Table 7.3 2030 Heathrow Access Demand with Forecast Mode Shares (000s) 103 Table 7.4 2030 Heathrow Access with Option MB1.4.1 (000s) 103
Table 7.5 2030 Heathrow Access with Option MB1.7.1 (000s) 104 Table 7.6 2030 Heathrow Access with Option MB3.4.1 (000s) 104 Table 7.7 Summary of New Lines Impact on Access to Heathrow (000s) 105
Table 7.8 Heathrow Options Summary of Benefits 106
Table 7.9 Heathrow Options Summary of Financial Impacts 107 Table 7.10 Heathrow Options Economic results summary 107 Table 8.1 Annual Air Demand (000s) to Paris and Brussels 110 Table 8.2 Forecast impact of New Lines on Paris / Brussels Demand (000s) –
Scenario 1 111
Table 8.3 Forecast Impact of New Lines on Paris Demand (000s) – Scenario 2 112 Table 9.1 2030 Reduction in Vehicle km (millions) by Road Type 115
Table 9.2 Summary of Statement of Outputs 117
Table 10.1 Summary Conclusions of Environmental Appraisal 120 Table 11.1 Capital Cost Estimate - Tunnel and Station Cost Increase Test 124
Executive Summary
1. Network Rail has commissioned the New Lines Programme and appointed Steer Davies Gleave as Programme Management Consultants. The aim of the programme is to investigate whether there is a Strategic Business Case for continuing to develop the concept of building one or more new line(s) as additions to the national rail network.
2. The key aim of the New Lines Programme is to meet future needs for additional rail capacity. A new line will provide additional capacity in two ways:
I Through the provision of capacity on the New Line itself; and
I Through the associated release of capacity on the classic rail network.
3. A complete Programme of work has been undertaken to support the development of the Strategic Business Case, including creation of bespoke decision support models. The suite of documents supporting the business case is available on Network Rail’s website.
4. Through an examination of capacity constraints on the current rail network, and an analysis of markets, it has been established that the key targets to be served by a New Line are London, Birmingham and Manchester.
5. Option assessment was undertaken to determine the core route for the New Line. This tested the following options:
I MB1.0a: Main line to Manchester with a diverging main line to Birmingham and services from London to Birmingham and from London to Manchester;
I MB1.0b: Main line to Manchester with a diverging main line to Birmingham and services from London to Birmingham and from London to Manchester plus services between Manchester and Birmingham;
I MB2.0a: Main line to Birmingham that then continues on to Manchester with services from London to Birmingham and from London to Manchester;
I MB2.0b: Main line to Birmingham that then continues on to Manchester with services from London to Birmingham and from London to Manchester plus services between Manchester and Birmingham; and
I MB2.0c: Main line to Birmingham that then continues on to Manchester with services from London to Birmingham that then continue on to Manchester. 6. This identified the best performing core route option as MB1.0b: a main line between
London and Manchester with a diverging main line to Birmingham with services between all three cities. Even though the option links the top target markets, the economic analysis shows that the case for a route and service between London, Manchester and Birmingham alone appears marginal. However, this option has not been optimised as a stand-alone scheme. It includes infrastructure costs that a railway requiring just the capacity for eight trains per hour in each direction would not need.
7. The results of the options are shown below:
FIGURE 0.1 CORE NEW LINE SERVICE OPTIONS - HIGH LEVEL RESULTS
NPV (£ bn) -0.6 -0.5 -3.8 -2.9 -1.8
BCR 0.9:1 0.9:1 0.6:1 0.7:1 0.8:1
8. The best performing core route option (MB1.0b) has been developed further by the addition of other target market destinations. This process has focused on markets within reasonable geographic reach of a New Line serving Birmingham and Manchester. This leads to a cohesive New Line proposition, and maximises the potential for utilisation of the classic network (by freeing up considerable capacity on the West Coast Main Line). The variants considered are:
I MB1.1: Self contained New Lines to London, Manchester and Birmingham plus Warrington and Liverpool;
I MB1.2.1: Self contained New Lines to London, Manchester and Birmingham plus Preston and Scotland;
I MB1.3: New Lines to London, Manchester and Birmingham plus Preston with trains running through to and from the classic line to Scotland;
I MB1.4.1: Self contained New Lines to London, Manchester and Birmingham plus Liverpool, Warrington and Scotland; and
I MB1.6: New Lines to London, Manchester and Birmingham plus Preston, with trains running through to and from the classic lines to Warrington, Liverpool and Scotland.
9. These are shown diagrammatically below. The dotted line indicates where New Line services would run over existing infrastructure.
FIGURE 0.2 FURTHER DEVELOPED NEW LINE SERVICE OPTIONS – HIGH LEVEL RESULTS
NPV (£ bn) 4.9 8.8 3.5 13.5 8.7
BCR 1.4:1 1.5:1 1.3:1 1.8:1 1.9:1
10. When additional target markets are added to the core route, the incremental value means that the options perform better, all achieving Benefit:Cost Ratios (BCRs) above 1:1. The fundamental reason for this is that the majority of the core infrastructure costs can be offset against the increased overall revenue and benefits – making the incremental economic case very attractive (affordability being a separate matter to consider). The best performing options in economic terms are the full options (MB1.4.1 and MB1.6) which serve all the target markets including Scotland and increase the use of the potential line capacity. These options achieve comparable BCRs of 1.8:1 and 1.9:1 respectively.
11. Adding additional targets to the New Line also gives the opportunity to address demand capability gaps on the West Coast Main Line. This is especially true of MB1.4.1 as a self-contained option with no classic line running, as it would relieve capacity at the current significant pinch points across the WCML. MB1.6 would introduce operational challenges on the classic lines, particularly when considering the pathing of services to Warrington and Liverpool via a classic line route.
12. The New Line achieves modal shift from road with all options. The options that run to Scotland also achieve modal shift from air, particularly the all New Line options, thereby providing support to the government’s climate change objectives.
13. From the two full options, MB1.4.1 has the highest Net Present Value (NPV). However, although offering excellent revenue and benefits, as well as addressing the broad objectives of this study, MB1.4.1 also raises considerable affordability issues. MB1.6 delivers a similar BCR, but with a lower NPV and lower capital costs.
14. Options that serve Heathrow have also been considered. Firstly, by routeing the services in Option MB1.4.1 via Heathrow (Option MB3.4.1) or by providing a diverging main line to Heathrow (Option MB1.7.1) and extending two existing services to and from Heathrow. Both these options led to an increased transfer of air and car trips to rail. The diverging high speed line connection to Heathrow has a better case than routeing the line through Heathrow, although it had a marginal detrimental effect upon the BCR. This is due to the proportional increase in costs being greater than the increase in benefits and revenue.
15. Options for through train operation to and from High Speed 1 have also been considered. If the New Line London terminal was in close proximity to London St Pancras, passengers could easily transfer between the New Line and high speed services to Europe even in the absence of a through link. This itself can lead to up to half a million additional trips shifting from air to rail.
16. It was concluded that available capacity on the New Line would be best used for services to and from London Central.
17. The recommendation of this report is that there is a case to take the London to North West and Scotland corridor forward for further investigation.
18. We believe that any New Line would form the first stage of a network of high speed lines.
1
Introduction
Context1.1 The demand for rail transport has grown by more than 40% for passenger traffic and more than 60% for freight traffic in the last ten years. The long term forecast is that demand for rail travel will continue to grow. This is based on the assumption that the drivers for rail demand, such as, economic growth and environmental concerns, will in the long term, continue to be favourable to rail.
1.2 There is a need to look ahead to identify the challenges that will face the railways in the future and to examine the options available to meet these challenges through value for money and affordable interventions.
1.3 There is an opportunity for Network Rail to contribute to this strategic long term planning in the rail context.
1.4 Network Rail has commissioned the New Lines Programme and appointed Steer Davies Gleave as Programme Management Consultants. The aim of the programme is to investigate whether there is a Strategic Business Case for continuing to develop the concept of building one or more new line(s) as additions to the national rail network.
1.5 Over the course of this study, the need for an intervention to provide further capacity to meet expected demand was established and a potential New Line identified. The purpose of this report is to set out, at a strategic level, the Strategic Business Case for the new line and make a recommendation as to whether the concept should be taken forward for further consideration.
New Lines Programme
1.6 The primary objectives for the programme are to relieve the capacity issues on the existing (classic) network and provide additional passenger capacity through the development of a new line (or a network of new lines). To deliver this, any new line(s) would need to be consistent with the government’s long term policies for transport. Therefore, the following broad objectives have been identified as providing a consistent basis against which the options can be assessed. The objectives are to:
I Provide the necessary future additional passenger capacity on the national rail network through the development of a value for money new line intervention; I Relieve future passenger and freight capacity constraints and improve connectivity
on the classic rail network;
I Support national economic competitiveness and growth by improving connectivity between key economic markets;
I Support the government’s targets for reducing transport emissions of carbon dioxide and other greenhouse gases, by encouraging modal shift from air and road to rail; and
I Promote greater equality of opportunity by improving accessibility to key markets through the significant reduction of journey times between them.
1.7 The preferred scheme identified within this report is considered to be the line that is assessed as being the most suitable that best meets the objectives described above.
Developing the Strategic Business Case
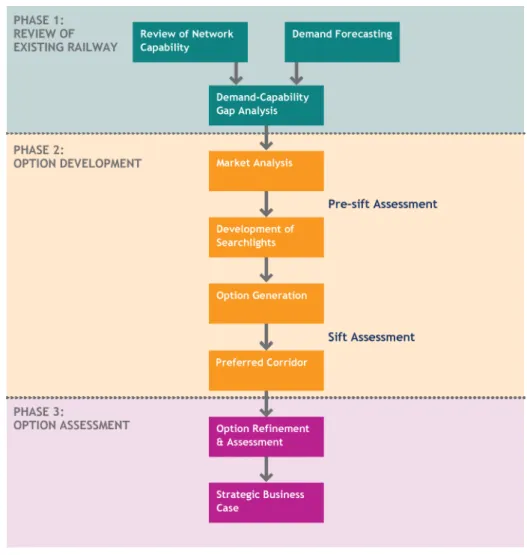
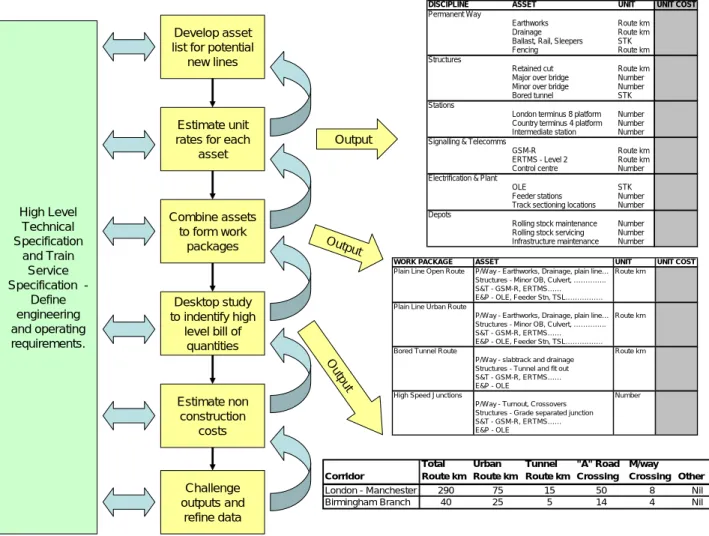
1.8 This Strategic Business Case report is the culmination of sixteen workstreams. The workstreams include identifying a need for additional capacity on the classic railway, consideration of the most appropriate intervention and the generation and assessment of a range of options. The outcome is a recommendation as to whether a potential new line scheme should be taken forward for further consideration. This process is shown in Figure 1.1.
FIGURE 1.1 DEVELOPING THE STRATEGIC BUSINESS CASE
1.9 The programme has been undertaken in three phases and a brief overview of each phase and the key findings are outlined below.
Phase 1: Review of Existing Railway
1.10 As the study hypothesis only considers lines from London to the north and west, the study geography is bound by five ‘classic line’ route corridors. These are the Great Western Main Line (GWML), Chiltern (Marylebone to Birmingham via High Wycombe),
West Coast Main Line (WCML), Midland Main Line (MML) and East Coast Main Line (ECML).
1.11 The first phase reviewed the five in-scope lines and developed forecasts for a future planning year of 2020. A baseline route and passenger carrying capability of the railway system in the future was established from existing published data, including Route Utilisation Strategies and the Strategic Business Plan from Network Rail, HLOS from the Department for Transport and as agreed in a series of capacity baselining workshops with Network Rail route planners. The baseline not only included currently committed schemes, but also those considered likely to be delivered before 2020 and capacity enhancing schemes that could be undertaken such as train lengthening and the introduction of new rolling stock. The WCML, MML, ECML, GWML and Chiltern Main Line were all found to be forecast to be running at near line capacity.
1.12 Using this baseline, a demand-capability gap analysis was undertaken that considered the capability of the in-scope rail lines to satisfy passenger and freight demand both today and in 2020. It assessed whether further intervention was necessary, such as the construction of a new line.
1.13 From this work it was concluded that consideration of an intervention should primarily focus on relieving the demand-capability gap on the WCML, followed by the MML and ECML. An intervention on the GWML was seen as a lower priority and there was no requirement for an intervention on the Chiltern Main Line.
Phase 2: Option Development
1.14 Once the (supply side) need for an intervention had been identified, a range of options were developed and assessed in order to select a preferred corridor. A multi-criteria approach to assessment was developed based on the broad objectives and the principles of feasibility, suitability and acceptability. It set out the criteria used to identify key markets and market potential and was used to make an initial high level sift of the wide range of (generated) options to select the preferred corridor.
1.15 The gap analysis from the previous work was used as a starting point, but most importantly, a market analysis exercise was also undertaken. Any new line will need to both address supply side constraints (capacity) and provide opportunities to make a ‘step change’ in access for, and attractiveness of, rail travel (both through modal shift and trip generation) in order to underpin sustainable economic growth and wider policy objectives. The work identified the top target markets that a new line could serve (based on existing and future potential demand, revenue and benefits). These top targets were then grouped geographically to form ranging ‘searchlights’ which gave the basis for the generating plausible options, taking into account the realities of practical railway operations. The searchlights covered three geographical corridors:
I London – West;
I London – North West and Scotland; and
I London – North East.
1.16 A range of options were built up from the searchlights taking the highest priority target first and then adding on other targets until line capacity was exhausted. The options were then assessed incrementally to ensure the value of each market was captured. Finally, the sift criteria was applied to each option to identify the most suitable corridor. The best performing corridor was the London to North West corridor, with a core route
of London to Manchester and Birmingham. The other markets within this corridor (in order of rail market size) are Liverpool, Edinburgh, Preston and Glasgow.
Phase 3: Option Assessment – Strategic Business Case
1.17 The preferred corridor and core route identified through the sift assessment were then taken forward for further consideration. Although no alignments have been designed during this Strategic Business Case assessment, high level analysis was undertaken to determine whether the best route would serve Manchester via Birmingham or via a direct line to Manchester and a diverging main line to Birmingham. The options considered are outlined in Figure 1.2. The relevant service patterns for each option are described in Section 2.
1.18 Demand and revenue and capital and operating costs were forecast for each option and run through the business case model to determine the best performing option in terms of relative economic value (Net Present Value {NPV}). Option MB1.0b was selected and this formed the basis of the next stage of option refinement.
FIGURE 1.2 STAGE 1 OPTION ASSESSMENT: LONDON TO MANCHESTER AND BIRMINGHAM
1.19 The options shown above have the following assumed service pattern:
I MB1.0a: Main line to Manchester with a diverging main line to Birmingham and services from London to Birmingham and from London to Manchester;
I MB1.0b: Main line to Manchester with a diverging main line to Birmingham and services from London to Birmingham and from London to Manchester plus services between Manchester and Birmingham;
I MB2.0a: Main line to Birmingham that then continues on to Manchester with services from London to Birmingham and from London to Manchester;
I MB2.0b: Main line to Birmingham that then continues on to Manchester with services from London to Birmingham and from London to Manchester plus services between Manchester and Birmingham; and
I MB2.0c: Main line to Birmingham that then continues on to Manchester with services from London to Birmingham that then continue on to Manchester.
1.20 Once the core route option was selected, additional markets were added incrementally to test the incremental value of these markets on the Strategic Business Case. The options are a mix of new line only and new line/classic line running.
1.21 The options taken forward for detailed assessment are shown in Figure 1.3. These are
I MB1.1: Self contained New Lines to London, Manchester and Birmingham plus Warrington and Liverpool;
I MB1.2.1: Self contained New Lines to London, Manchester and Birmingham plus Preston and Scotland;
I MB1.3: New Lines to London, Manchester and Birmingham plus Preston with trains running through to and from the classic line to Scotland;
I MB1.4.1: Self contained New Lines to London, Manchester and Birmingham plus Liverpool, Warrington and Scotland; and
I MB1.6: New Lines to London, Manchester and Birmingham plus Preston, with trains running through to and from the classic lines to Warrington, Liverpool and Scotland.
FIGURE 1.3 STAGE 2 OPTION ASSESSMENT: STRATEGIC BUSINESS CASE
1.22 The final stage of work developed options that considered connectivity to Heathrow and included an assessment of the impact of connecting to High Speed 1 and Europe. These options are described in greater detail later in the document.
1.23 All of the options have been assessed in accordance with DfT guidance and are presented within this Strategic Business Case.
1.24 The Business Case is the culmination of a programme of works undertaken in three phases. The supporting documents prepared in the course of this exercise are placed on Network Rail’s website. These documents are:
I High speed rail investment; an overview of the literature: Literature review by Prof. Chris Nash on the motivation of other countries that have invested in high speed rail and the lessons learnt
I Capacity analysis: Document testing the hypothesis that in future there will be a gap between railway demand and capacity to meet the demand.
I Option development: Explanation of the assessment criteria and the approach taken for option development
I Demand forecasting technical note: Technical note describing the approach taken for demand and revenue forecasting
I Stated preference survey report: Description of the stated preference survey conducted for New Lines
I Comparing environmental impact of conventional and high speed rail: A
comparison between conventional rail and high speed rail with respect to energy and environmental effects
Business Case Report
1.25 The remainder of this report is structured as follows:
I Section 2 – Approach
I Section 3 - Scheme Description
I Section 4 – Cost Modelling
I Section 5 – Demand, Revenue and Benefit Forecasting
I Section 6 – Economic Assessment
I Section 7 – Heathrow Options
I Section 8 – HS1 Options
I Section 9 – Statement of Outputs
I Section 10 – Environmental Impact Assessment
I Section 11 – Risks and Opportunities
2 Approach
Strategic Business Case
2.1 This Strategic Business Case is undertaken within the framework set out by the Network Rail Guide to Railway Investment Projects (GRIP) and is, technically, a pre-stage 1 GRIP study. The GRIP process sets out Network Rail’s approach to managing and controlling projects that enhance or renew the national rail network and is divided into specific stages that cover the project lifecycle.
2.2 The Pre-GRIP stage is undertaken before a complex project is initiated and is defined by Network Rail thus:
Pre-GRIP involves the Pre entry criteria that are to be met by the Client and Sponsor prior to project initiation in GRIP 1. Key planning activities and products such as Business planning, Planning the Work bank, the Business Case and Business Plan Entries should happen before entering project time.
2.3 The purpose of the Pre-GRIP stage is to validate the concept being considered as a project and allow it to be taken forward and developed through the GRIP process. At such an early stage in the development of a potential scheme, the analysis is of a strategic nature, establishing the expected value of the concept before large investments in further development are made.
2.4 Therefore, this Strategic Business Case provides a platform to set out that value and to inform the decision to take the concept forward (or not) for further consideration and develop it as a Network Rail project.
Strategic Assessment of Option
2.5 Essential to this Strategic Business Case is the requirement to ensure consistency within and between the options and to produce the required inputs for their assessment. In order to achieve this, a set of decision support tools have been developed. These tools produce the associated forecast costs and benefits for each option.
2.6 It is important that these tools are fit for purpose and provide the right balance between detail and strategy, namely proportionality. As the study is at Pre-GRIP, no infrastructure plans or timetables have been developed. The proposed New Line and alterations to the classic line have been specified at a high level, based on a series of assumptions. Therefore, all the benefit forecasting and costing has been undertaken at a level commensurate with the specification available.
2.7 Therefore the Train Service Specifications that have been developed are not operational timetables. The specifications have only been developed to a level appropriate to this analysis in order to enable a comparative assessment between options and to provide inputs to the decision support tools. Timetables would need to be developed in later stages of the project lifecycle when further design and analysis has taken place.
2.8 Similarly, infrastructure plans have not been developed for this work and would be required in the future as part of the development of a potential scheme. The cost inputs that have been developed are based on a series of assumptions as described in detail within Section 4 of this report and also in the High Level Technical Specification.
2.9 Consistent with this approach all the benefit forecasting and costing for the Strategic Business Case has been undertaken at a level commensurate with the specification available and appropriate at this stage of the project lifecycle.
2.10 A more detailed explanation of the decision making tools and their underlying assumptions can be found in the relevant sections of this report.
Risk
2.11 The high level nature of the assessment means that there is considerable uncertainty over the forecasts and costs. The considered risks have been outlined in detail in the Risks and Opportunities section (Section 11), however there is still inherent risk in any assessment and it is important to consider these risks in order to manage the uncertainty.
2.12 In order to allow decision makers to take decisions with confidence, they need to understand whether within a margin of uncertainty, one option performs better than another, namely whether there is ‘clear water’ between them, e.g. even if it can’t be established that the answer is 16, it can be established that “14-20” is greater than “5-9”.
2.13 Figure 2.1 illustrates the concept of uncertainty around a forecast result and hence informs the level of confidence with which a decision could be taken.
2.14 In order to address uncertainties around key parameters (e.g. GDP growth, X and Y) the sensitivity of key performance indicators (e.g. BCR, NPV) to plausible variations is tested. The results provide an indication of the robustness of the case for an intervention.
Benchmarking
2.15 The benchmarking of inputs and assumptions employed in the assessment of a potential scheme against empirical data enables greater confidence in them to be gained, and hence in the assessment of likely outcomes. Throughout this study an ongoing process of benchmarking has been conducted.
2.16 Unit rates for each asset and apportionment of non construction costs were developed in conjunction with the estimating team from the Infrastructure Investment department of Network Rail. The calculated average cost per kilometre has been benchmarked against international high speed schemes, including High Speed 1. The resultant forecast cost per kilometre is comparable with other schemes and provides comfort that the quantities and rates are within a reasonable range.
2.17 A review has been undertaken of the available literature on international experience of the introduction of high speed rail. This indicates that the introduction of high speed rail can lead to significant increases in rail demand. For example when air passengers transferring to other flights are excluded Eurostar services are estimated to carry 80% of the London to Paris market. Other information such as the journey elasticities implied by observed changes in behaviour have also been utilised to ensure that the input parameters to the New Line forecasts are robust.
3 Scheme
Description
Overview of New Line Option Development
3.1 For each option there are two elements required to support development of the Strategic Business Case:
I A full description of the New Line inputs; and
I A full description of the Classic Lines changes assumed.
3.2 Whilst this is a Strategic Business Case it is necessary to make detailed assumptions in a number of key areas in order to populate the various models used to assess the performance of each option. Whilst many of these are straightforward, others have required a management judgement made by the project team.
3.3 At this stage of programme development it is not appropriate or desirable to consider New Line alignments, however it is necessary to calculate realistic distances between station stops and intermediate junctions in order to populate the infrastructure and operating cost models and as a basis for establishing journey times to input to both the Operating Cost Model and the Demand and Revenue Modelling Suite.
3.4 Similarly it has also been necessary to create notional timetables to test and develop the operational planning assumptions made and to support the modelling through an iterative process. This is particularly important in options where the capacity on the New Line is more intensively used and where it is necessary to demonstrate that:
I Rolling stock balances are feasible and realistic;
I New Line paths can be achieved within reasonable ‘Rules of the Route’ for a New Line; and
I Platform working is deliverable with the assumed platform quantum at termini and intermediate stations.
3.5 This section of the report describes the technical and operating assumptions made and the New Line conceptual route strategy.
Technical Assumptions
Route Configuration
3.6 The New Line is assumed to be twin track with bi-directional capability throughout. It will have full engineering and emergency access with single line working capability, at line speed, on the adjacent line. It should be noted that no benefits of this have been quantified at this stage of project development. The New Line is assumed to comply with the various national and international standards. It is also assumed that track spacing shall be 6m centre line to centre line. It shall therefore be possible to maintain one line under possession without closing the adjacent line.
Signalling and Control
3.7 The signalling system is assumed to be ERTMS/ETCS level 2 and the assumed ‘blocks’ are 1 km long. The New Line network is assumed to have one separate control centre for real time management of all route sections.
Maximum Gradient
3.8 The maximum gradient is assumed to be 1 in 55 on the 200mph route sections. This represents the maximum gradient that a train with AGV performance and traction characteristics can negotiate without compromising this speed of operation, and therefore, point to point journey times. This has been established through a RailSys simulation.
Grade Separation
3.9 All junctions with diverging main lines are assumed to be fully grade separated. The diverging route has a reduced maximum speed of 125mph across the junction with line speed maintained for trains on the non-diverging main route. No grade separation has been assumed on the approaches to either London or other city terminal stations, as it is considered unnecessary with the maximum quantum of trains it is planned to operate at these locations.
Stations
3.10 In line with European interoperability regulations, all station platforms on the New Line are assumed to accommodate 400m length trains. In most options the maximum train length is assumed to be 260m although in one, Option 2.0c, the maximum train length is assumed to be 390m in order to provide sufficient capacity to meet the demand on the New Line route section between London and Birmingham.
3.11 At intermediate stations, where non-stop trains are assumed to pass, the platforms are situated on separate platform loops. Where it is not planned for trains to pass each other in the same direction, and where planned headways between trains is at least 10 minutes, the platforms faces are assumed to be adjacent to the main running line. 3.12 These two alternative configurations are shown in Figure 3.1.
FIGURE 3.1 PLATFORM AND TRACK LAYOUT AT INTERMEDIATE STATIONS
Network Connections
3.13 Where train services are self contained to the New Line, connections to the classic network are assumed to be provided for engineering access only.
3.14 Where through services are planned to operate between the New Line and the classic network, the junctions between the two routes are assumed to be grade separated. Traction Power and Rolling Stock
3.15 The route is assumed to be electrified at 25kv ac throughout.
Station layout where non stop trains pass e.g. Preston
Diverging routes on turnouts will have
circa a maximum speed of 125mph 200kph) Distance from turnout to platform end is optimised for train braking characteristics
Station layout where all trains stop e.g. Warrington
Line speed is reduced to 100mph through the station platforms
Station layout where all trains stop e.g. Warrington
Line speed is reduced to 100mph through the station platforms
3.16 The Rolling Stock type is unspecified but it is assumed to have AGV traction and performance characteristics. Power consumption is based on an analysis of traction energy consumption on HS1 provided by Network Rail and assumes some reduction on that achieved currently with Class 373 Eurostar units. The same rolling stock type has been assumed in all options irrespective of whether the services operate wholly on the New Line or run through to the classic line(s). Options that are self contained to the New Line may give an opportunity of utilising standard rolling stock deployed on other European networks and this may give cost benefits that have not been considered in the Strategic Business Case.
3.17 Trains are assumed to be formed of 5-car (130m), 10-car (260m) or 15-car (390m) sets. These trains are assumed to carry 325 seated passengers in a 5-car set, 650 seated passengers in a 10-car set and 975 seated passengers in a 15-car set.
Operating and Operation Planning Assumptions
Planning Headway and Planning Capacity
3.18 A planning headway of three minutes has been assumed on all sections of the New Line. The technical headway, the minimum separation between trains with a safety margin, has been calculated as 79 seconds with a 350m train travelling at the maximum line speed of 200mph. It is assumed for planning purposes that all trains have identical performance characteristics when deployed on the New Line. This ensures that the New Line is utilised most efficiently up to realistic maximum quantum of trains per hour (tph) in each direction.
3.19 For self contained options that have no through services to the classic network, and that also have a simple repeating even interval service pattern, a maximum route planning capacity of 16tph in each direction has been assumed. This provides a margin, equivalent to 4tph in each direction, as white space on the route for performance and for planning flexibility at the approaches to terminal stations.
3.20 In options that have through running to the classic line network a maximum capability of 14tph in each direction is assumed. This reduced capability is to reflect the significant additional performance risk and the difficulty of integrating the respective route timetables.
3.21 Whilst it has not been necessary to develop options that have more complex service or intermediate station calling patterns there would be a further reduction in route capacity were any to be seriously considered. It has been calculated that at least two paths per hour in each direction would be lost if an intermediate station on the core route section, between London and the diverging junction for Birmingham, were to be served by some trains only. If all trains stop at the intermediate station then there is no further loss in route capacity provided that the platforms and signalling are designed for this functionality.
Station Dwell
3.22 At regional intermediate stations it is assumed that each station stop will add a maximum of six minutes to the overall journey time including a station dwell time of two minutes. In options where trains reverse at an intermediate station, an extended dwell time of five minutes has been used for trains formed of 5 cars.
Service Balances and Turnround Allowances
3.23 In each of the options described in this section the notional rolling stock diagrams are self contained within a service group. It might be possible to further optimise the rolling
stock fleet and reduce the overall terminal platform requirements by interworking sets between service groups. However, this is likely to import significant performance risk and would almost certainly require a reduction in the route planning capacity assumptions described above.
3.24 A minimum turnround time of 20 minutes is included in all notional rolling stock diagrams. However, the combination of journey time between end to end station pairs, when coupled with service frequency, ensures that most turnrounds are longer. Where some flexibility is inherent in the train set diagrams, and without prejudicing route capacity, turnround times at the London end are reduced to minimise the cost of platform provision here. This is balanced with a longer turnround at the outer end provided this itself does not add to the total platform requirement.
3.25 Actual turnround time will be a function of the station layout, the rolling stock design, train servicing arrangements and the passenger information systems. Shorter turnround times may be possible if the combination of these is optimised, although these are unlikely to fall below 15 minutes, particularly for the longer distances services with journey times in excess of 2 hours.
Route Distance
3.26 The point to point distance between any two stations pairs is based on the straight line distance +10%. In some cases up to +15% has been added to the straight line distance where obvious route geography features that the New Line must cross or circumnavigate could constrain route choice. An example of this might be a major river estuary such as the Mersey. Similarly, where the destination is served as a diverging main line, a judgement has been made on what impact this will have. Most assumed point to point distances are similar to the classic line route distance between the same two station pairs. This is illustrated in Table 3.1 using the Route 1 Option described later in this section.
TABLE 3.1 ASSUMED ROUTE 1 DISTANCE BETWEEN NEW LINE STATION PAIRS
Between Straight line +10% +15% Classic line Assumption
London and Manchester 161 177 185 184 180
London and Birmingham 100 110 115 113 115
London and Edinburgh 331 364 380 393 375
London and Glasgow 344 378 395 401 380
London and Liverpool 177 195 204 193 200
London and Preston 188 207 217 209 205
Birmingham and Manchester 71 78 81 82 85
Birmingham and Edinburgh 246 270 283 295 280
Birmingham and Glasgow 253 278 291 296 285
Birmingham and Preston 95 104 109 104 110
Manchester and Preston 28 30 32 31 30
Preston and Edinburgh 153 168 176 191 170
Preston and Glasgow 158 174 182 192 175
Line Speed
3.27 A maximum line speed of 200mph (320kph) has been assumed in this Strategic Business Case. This was agreed as it represents the current maximum for high speed lines in Europe and that which can be achieved by trains currently available on the market.
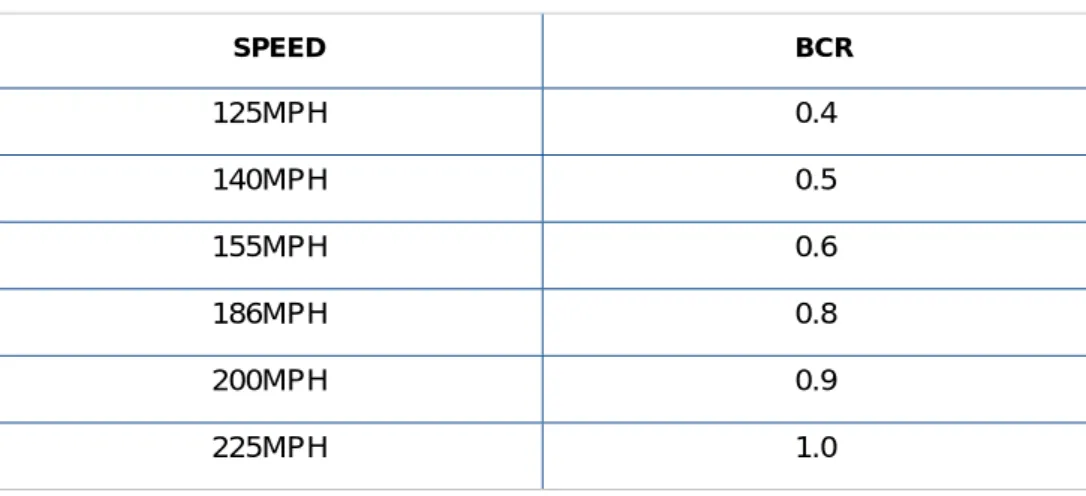
3.28 The impact of alternative maximum line speeds has been assessed to show the change to journey times, train hours and rolling stock fleet requirements. A standalone analysis has also been undertaken examining the impact of different speed assumptions. This analysis demonstrated that the performance of the scheme, in terms of the BCR, improves as speed increases. This will be a consideration if any existing (Class 373, 390, 395 or IEP) trains were to be redeployed on the New Line or if faster line speeds were a serious option at the time of project delivery. This is illustrated in Option MB1.0A, described later in this section, in Table 3.2 below.
TABLE 3.2 IMPACT OF ALTERNATIVE LINE SPEEDS ON OPTION MB1.0A
Between 125mph 140mph 155mph 186mph 200mph 225mph
London Manchester 92mins 85mins 79mins 69mins 66mins 61mins
London Birmingham 60mins 56mins 53mins 47mins 46mins 44mins
Total Fleet requirement
32 sets 30 sets 29 sets 26 sets 24 sets 22 sets
Annual train hours 138,446 128,583 122,738 113,425 103,562 98,935
3.29 These assumptions have been run through the New Lines modelling suite to estimate the impact on the value of the scheme under differing speeds of operation. Figure 3.2 below shows the relationship between speed and the NPV of the key components of the appraisal of the scheme. As speed increases operating cost increases, due to the cost of increased energy consumption outweighing service efficiencies. However revenue rises at an even faster rate than costs.
FIGURE 3.2 NET PRESENT VALUE OF COMPONENTS ASSUMING DIFFERENT SPEEDS OF OPERATION
3.30 Table 3.3 below shows the BCRs estimated for Option MB1.0a at different speeds of operation. This analysis indicates that the faster the service, the better the case for a New Line. However, 200mph operation has been assumed for the New Line services. This is the speed of the fastest rail passenger services currently in operation.
12 13 14 15 16 17 18 19 20 100 125 150 175 200 225 250 Line speed (mph) £bn, N P V, 2002 pr ices
TABLE 3.3 SPEED OF OPERATION AND BCR OF OPTION MB1.0A SPEED BCR 125MPH 0.4 140MPH 0.5 155MPH 0.6 186MPH 0.8 200MPH 0.9 225MPH 1.0
3.31 As part of this project AEA Technology was commissioned by the New Lines Programme to fully consider the environmental impact of a new line. As part of this piece of work AEA considered the energy consumption of different rolling stock, and different speeds of operation. The work demonstrated a significant net benefit of high-speed rail services over equivalent conventional services in terms of energy
consumption and emissions per passenger-km. This is more fully documented in the paper “Comparing the Environmental Impact of Conventional and High Speed Rail” which is available on the Network Rail website. It should be noted that due to the timescales in which the Strategic Business Case was required it was not possible for the full findings of the AEA work to be taken into account in the appraisal presented in this document.
3.32 Figure 3.3 shows the New Line speed profile used to calculate journey times between any two stations pairs. Using this profile journey times between all the station pairs has been calculated using RailSys. A notional 2.5% performance allowance has been added to all calculated times.
FIGURE 3.3 ASSUMED NEW LINE SPEED PROFILE
Route Planning Assumptions
London Terminus
3.33 Throughout this Strategic Business Case the London terminus is referred to as London Central. An assumption was developed that for the purpose of this Strategic Business Case, the New Line London terminus would be assumed to be located somewhere on the Circle Line.
90mph 125mph 125mph 90mph
0-5 miles 5-20 miles
200mph
15-5miles 5-0miles
London Central New Line Major City station or terminus
Assumed New Line maximum speeds
125 mph
200mph
Line speed reduction for diverging route (only) at Junctions
90mph 125mph 125mph 90mph
0-5 miles 5-20 miles
200mph
15-5miles 5-0miles
London Central New Line Major City station or terminus
Assumed New Line maximum speeds
125 mph
200mph
3.34 In preliminary analysis, a multi-criteria assessment was undertaken to narrow down location choice for planning purposes and to consider the relative impact that location would have in terms of construction (cost, feasibility) and accessibility and connectivity.
3.35 This assessment considered the ease of access to markets, destinations, development areas and transport links. The construction feasibility and cost impacts for the possible station location choices were also considered, together with the impact on existing services that might be displaced. The output from this work has formed a key input to the infrastructure cost model.
Major City Termini
3.36 At each of the major city destinations it was assumed that the New Line terminus would be located at, or within walking distance, of one or more of the classic line principal stations. For example in Manchester the terminus was assumed to be at, or near, Piccadilly, Oxford Road or Victoria. In Birmingham the terminus was assumed to be at, or near, New Street, Snow Hill or Moor Street.
Regional Station location
3.37 For regional stations, the assumed station location was less precise, reflecting the uncertainty of route alignment, but each was assumed to have connections to an existing classic line and have good accessibility.
Route approach to London
3.38 A major cost driver in the Strategic Business Case is the cost of penetrating central London at least as far as the Circle Line. Without extensive tunnelling from the London boundary there are relatively few obvious approach routes into London. Those that do exist would all use existing rail corridors in some way, and with varying impacts on existing services during and post construction. A number of route choices have been considered at a high level and these are briefly described below.
Great Western and Great Central Joint (GW&GC Joint)
3.39 This approach reaches the London boundary via the existing Chiltern Main Line from High Wycombe to Northolt Junction. For most London terminus options the route would then use the very lightly used corridor from Northolt Junction towards North Acton and Old Oak Common where it joins the Great Western Main Line (GWML). The corridor is shared with LUL’s Central Line. South of Northolt Junction a double track route would reach the North Acton area where the forward approach to Central London would vary by choice of London terminus. This approach provides potential access to HS1 and Heathrow can be reached from the GW & GC Joint route via the Greenford branch and the GWML.
West Coast Main Line (WCML)
3.40 This approach uses the WCML route corridor and could be achieved by displacement of existing services to enable the creation of two tracks suitable for a New Line. This might be achieved through displacing the London Overground DC and Bakerloo line services and much of the DC lines route between Euston to Watford Junction but it would also require significant change to other lines and services. This would be highly disruptive during construction and almost certainly require closure of most, if not all, existing DC line stations in London and Hertfordshire. This approach provides potential access to HS1. Access to Heathrow could be achieved via the West London Line, Windsor Lines and Airtrack or a new route connection.
Midland Main Line (MML)
3.41 This approach uses the existing MML corridor from the Greater London boundary near Elstree tunnel. From Elstree tunnel the New Line route shares the corridor with the M1 motorway. At Silkstream Junction the existing route becomes a six track corridor to West Hampstead junction. South of West Hampstead a new tunnel would take the line to a new terminus. This approach provides potential access to HS1 with a new link to HS1 or via reversal at St Pancras. Access to Heathrow could be achieved via an upgraded Dudding Hill line and the GWML from Acton.
Lea Valley (West Anglia Main Line)
3.42 This approach arrives at the London boundary via the existing West Anglia Main Line. From Cheshunt to Tottenham Hale it follows the Lea Valley corridor and then to Stratford and via the HS1 corridor to London Central. Heathrow could be accessed via St Pancras and the MML to West Hampstead and then via the Dudding Hill line and GWML from Acton.
Impact of Route Choice
3.43 Table 3.4 shows the impact on route distance to Manchester of the four approach corridors.
TABLE 3.4 IMPACT ON ROUTE DISTANCE (TO MANCHESTER) OF LONDON
APPROACH CORRIDOR Corridor and first
station beyond GLA boundary
Rail distance from London Central (St Pancras/King's Cross) to GLA boundary stn
Straight line distance GLA boundary station to Manchester Total distance GW and GC Joint Denham (Bucks)
20 miles (estimated) 150 miles 170 miles
WCML
Carpenders Park
(Herts) 15 miles (estimated) 150 miles 165 miles
MML Elstree & Borehamwood
(Herts) 12 miles (estimated) 150 miles 162 miles
Lea Valley Waltham Cross
(Herts) 22 miles (estimated) 155 miles 177 miles
3.44 In assessing the four route approaches it is clear that the relatively small difference in distance between London Central and Manchester is unlikely to have a significant impact on overall journey times.
3.45 In conclusion it is clear that the final route approach choice into London could have a significant infrastructure and disruption cost impact on the Strategic Business Case but that it has relatively little impact on revenue or operating costs of the New Line services. It is also clear that the route approach choice has to be considered carefully with the London terminus choice.
Stage 1: Conceptual Route Strategy
3.46 The initial option development identified the core route of London to Manchester and Birmingham as the key building blocks on top of which other services and calling patterns are tested.
3.47 Before developing the Train Service Specification further it was necessary to understand the difference in cost and benefits of the strategic route choice for the core option. The two basic choices for the core route are:
I Route 1 - London and Manchester with a diverging main line to Birmingham; or
I Route 2 - London and Manchester via Birmingham.
3.48 A secondary consideration in making the strategic route choice is the impact on regional services between Birmingham and Manchester to establish if these enhance the overall case once the additional costs and benefits were added. This has been considered for each route together with a hybrid option (MB2.0c) that combines links between all three station pairs in one service.
3.49 A further New Line option is a route that serves Heathrow as an intermediate station stop and this, Route 3, is considered in section 7 together with other Heathrow options.
3.50 For each core route choice the following services has been compared:
I London and Manchester 4tph + London and Birmingham 4tph; and
I London and Manchester 4tph + London and Birmingham 4tph + Birmingham and Manchester 2tph.
3.51 In addition a London and Manchester service with an intermediate station stop in Birmingham has also been tested. In order to provide a direct comparison between this option and Options MB1.0b and MB2.0b, the same capacity has been provided for the combined Manchester and Birmingham markets. This has been achieved by forming trains with 15-car sets and increasing the frequency to 6tph
3.52 Figures 3.4 and 3.5 show the route plan and Train Service Specification (TSS) for the route options and the core service variants for each. In these two routes choices, and for all subsequent New Line route extensions associated with other service options, the junctions have been named as shown in route plans. This is to assist their identification and ease inputs to the Infrastructure Cost Model. These names have no other meaning.
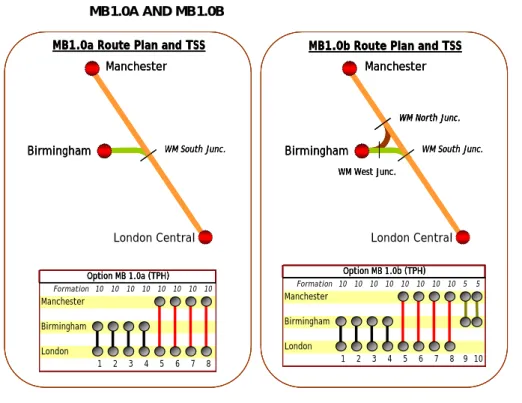
FIGURE 3.4 ROUTE 1 PLAN AND TRAIN SERVICE SPECIFICATION FOR OPTIONS MB1.0A AND MB1.0B
FIGURE 3.5 ROUTE 2 PLAN AND TRAIN SERVICE SPECIFICATION FOR OPTIONS MB2.0A, MB2.0B AND MB2.0C
Route Plan and TSS for all
Route 2 service options Formation 10 10 10 10 10 10 10 10 Manchester Birmingham London 1 2 3 4 5 6 7 8 Option MB 2.0a (TPH) Birmingham Manchester
London Central ManchesterFormation 15 15 15 15 15 15 Birmingham London 1 2 3 4 5 6 Option MB 2.0c (TPH) Formation 10 10 10 10 10 10 10 10 5 5 Manchester Birmingham London 1 2 3 4 5 6 7 8 9 10 Option MB 2.0b (TPH)
Route Plan and TSS for all
Route 2 service options Formation 10 10 10 10 10 10 10 10 Manchester Birmingham London 1 2 3 4 5 6 7 8 Option MB 2.0a (TPH) Birmingham Manchester London Central Birmingham Manchester
London Central ManchesterFormation 15 15 15 15 15 15 Birmingham London 1 2 3 4 5 6 Option MB 2.0c (TPH) Formation 10 10 10 10 10 10 10 10 5 5 Manchester Birmingham London 1 2 3 4 5 6 7 8 9 10 Option MB 2.0b (TPH)
3.53 A summary of the inputs made to the Infrastructure Cost Model, the Operating Cost Model and the Demand and Revenue modelling suite for these and subsequently described options are shown separately.
3.54 Table 3.5 below compares the same service operated on the two routes (Options MB1.0b and MB2.0b). This confirms that whilst Route 2 offers slightly faster journey times between both London and Birmingham and Birmingham and Manchester, the journey time increase to Manchester is 11 minutes for a non stop train. Annual train hours are also significantly higher in the Route 2 option, although the annual vehicle miles are the same for both route options.
TABLE 3.5 COMPARISON OF ROUTES 1 AND 2 JOURNEY TIMES AND COST DRIVERS
Birmingham Manchester London Central WM South Junc. WM West Junc. WM North Junc. MB1.0b Route Plan and TSS
Formation 10 10 10 10 10 10 10 10 5 5 Manchester Birmingham London 1 2 3 4 5 6 7 8 9 10 Option MB 1.0b (TPH) Birmingham Manchester London Central WM South Junc. MB1.0a Route Plan and TSS
Formation 10 10 10 10 10 10 10 10 Manchester Birmingham London 1 2 3 4 5 6 7 8 Option MB 1.0a (TPH) Birmingham Manchester London Central WM South Junc. WM West Junc. WM North Junc. MB1.0b Route Plan and TSS
Formation 10 10 10 10 10 10 10 10 5 5 Manchester Birmingham London 1 2 3 4 5 6 7 8 9 10 Option MB 1.0b (TPH) Birmingham Manchester London Central WM South Junc. WM West Junc. WM North Junc. WM North Junc. MB1.0b Route Plan and TSS
Formation 10 10 10 10 10 10 10 10 5 5 Manchester Birmingham London 1 2 3 4 5 6 7 8 9 10 Option MB 1.0b (TPH) Birmingham Manchester London Central WM South Junc. MB1.0a Route Plan and TSS
Formation 10 10 10 10 10 10 10 10 Manchester Birmingham London 1 2 3 4 5 6 7 8 Option MB 1.0a (TPH) Birmingham Manchester London Central WM South Junc. MB1.0a Route Plan and TSS
Formation 10 10 10 10 10 10 10 10 Manchester Birmingham London 1 2 3 4 5 6 7 8 Option MB 1.0a (TPH)
Between Route Journey time Fleet (sets) Train hours Vehicle miles 1 66 minutes 14 59,178 66m London and Manchester 2 77 minutes 16 69,041 69m 1 46 minutes 10 44,384 42m London and Birmingham 2 44 minutes 10 44,384 40m 1 38 minutes 5 22,534 9m Birmingham and Manchester 2 34 minutes 5 22,534 8m
Confirming Route Choice and Base Train Service
3.55 The economic appraisal, shown in Section 6, confirms that the Route 1 options perform better than the Route 2 options and that Option MB1.0b, which includes the service between Birmingham and Manchester, is best overall. This has therefore formed the start point for developing other options that explore the cost and benefits of serving additional destinations and the impact on the Strategic Business Case.
3.56 Route distance and journey time to all target destinations north of Birmingham are determined to be shorter via Route 1 and therefore this route choice will optimise the cost benefit of adding further destination to the chosen core route choice.
Stage 2: Developing the best performing Route Option
3.57 Once the core route had been selected, further options were developed by adding additional targets to the line. They were built up incrementally to assess the value of each market.
Widening target destinations to the East Midlands and Yorkshire
3.58 At this development stage consideration was given to looking at options with a diverging route to the East Midlands and forward to Sheffield and Leeds. As a core objective of the study was to release capacity on the West Coast Main Line (WCML), this was parked pending the results from Options MB1.1 onwards and also to establish the results from serving Heathrow. As these options added further trains to the New Line and transferred passengers to its services from the existing WCML classic line it gave potentially a better opportunity to develop a more substantial recast of the WCML with enhanced revenue and cost benefits.
3.59 As the results from each subsequent option that added additional services, also improved overall business case performance, it was unnecessary to look to the East Midlands and Yorkshire catchments for more benefits to support the case for a New Line.
3.60 Furthermore, until a route alignment is chosen, it is difficult to calculate accurate journey times and costs to relatively short distance secondary destinations off the core route like the East Midlands. A diverging main line to Yorkshire would also require significant additional New Line mileage for the route north of the East Midlands. The business case for this, even at four trains an hour between London and Leeds, is
unlikely to as strong as that achieved by serving destinations on the West Coast Main line.
3.61 Section 11 paragraph 11.34 considers the opportunity of adding additional routes to create a New Line network that would consider the East Midlands and West Yorkshire as potential target destinations.
Further Option Development
3.62 The following options have been developed to test the impact of adding further destinations to the chosen core route and train service specification. The New Line options are divided into those assumed to be self contained and serve all destinations directly and those that run on to the classic network.
I Self-contained options:
I Warrington and Liverpool – Option MB1.1;
I Preston, Edinburgh and Glasgow – Option MB1.2; and
I Warrington, Liverpool, Preston, Edinburgh and Glasgow – Option MB1.4.
I New Line with classic line running options:
I Options MB1.3: New Line to Preston with through services to and from stations between Preston and Edinburgh Waverley/ Glasgow Central; and
I Option MB1.6: New Line to Preston and with through New Line services to and from stations between Preston and Edinburgh/ Glasgow and with a further Classic Line connection to Warrington and Liverpool Lime Street.
3.63 These options are described below and a summary of the inputs made to the Infrastructure Cost Model, the Operating Cost Model and the Demand and Revenue modelling suite for each of these options are shown separately.
Option MB1.1: Route 1 London to Manchester, Birmingham and Liverpool
3.64 Option MB1.1 as shown in Figure 3.6 below adds a diverging main line to Liverpool with a new intermediate station at Warrington to the chosen core Option MB1.0b.
FIGURE 3.6 OPTION MB1.1 ROUTE PLAN AND TRAIN SERVICE SPECIFICATION (TSS)
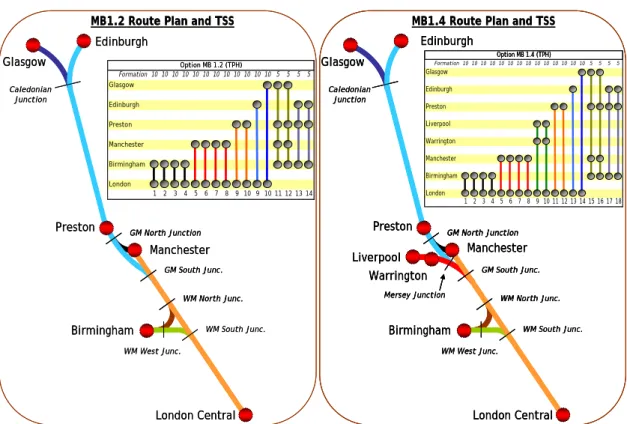
Option MB1.2: Route 1 London to Manchester, Birmingham and Scotland
3.65 In Option MB1.2 the New Line is extended to serve both Edinburgh and Glasgow with an intermediate station at Preston. On the core route section between London and WM South Junction a total of 10tph are proposed to be operated in each direction. In addition a connection is made from the New Line terminus at Manchester to join the
MB1.1 Route Plan and TSS
Liverpool Birmingham Manchester London Central WM South Junc. WM West Junc. GM South Junc. WM North Junc. Warrington Formation 10 10 10 10 10 10 10 10 10 10 5 5 Liverpool Warrington Manchester Birmingham London 1 2 3 4 5 6 7 8 9 10 11 12 Option MB 1.1 (TPH)
MB1.1 Route Plan and TSS
Liverpool Birmingham Manchester London Central WM South Junc. WM West Junc. GM South Junc. WM North Junc. Warrington Liverpool Birmingham Manchester London Central WM South Junc. WM West Junc. GM South Junc. GM South Junc. WM North Junc. WM North Junc. Warrington Formation 10 10 10 10 10 10 10 10 10 10 5 5 Liverpool Warrington Manchester Birmingham London 1 2 3 4 5 6 7 8 9 10 11 12 Option MB 1.1 (TPH)