NJCAT TECHNOLOGY VERIFICATION
EcoPure BioFilter
TM
Advanced Drainage Systems, Inc.
i Table of Contents
Table of Contents………. i
List of Figures………. ii
List of Tables………. iii
1. Description of Technology……….….1
2. Laboratory Testing………. 3
2.1 Test Setup………. 3
2.2 Test Sediment………... 7
2.3 Sediment Removal Efficiency Testing………. 9
2.4 Sediment Mass Loading Capacity……… 9
2.5 Scour Testing………..… 10 3. Performance Claims……….. 10 4. Supporting Documentation………... 11 5. Testing Results………. 11 5.1 Flow Rate……… 11 5.2 Water Temperature………. 12 5.3 Head……… 13
5.4 Sediment Concentration and Removal Efficiency………. 13
5.5 Sediment Mass Loading Testing……… 21
5.6 Scour………... 23
6. Design Limitations……….... 24
7. Maintenance Plan………... 25
8. Statements………. 27
ii List of Figures
Figure 1 The EcoPure BioFilter™ ……….... 1
Figure 2a Flow Path of the EcoPure BioFilter™ ……….…... 2
Figure 2b Key Dimensions of the EcoPure BioFilter™……….…...….3
Figure 3 Schematic of the EcoPure BioFilterTM Test Configuration……….………… 4
Figure 4 Photograph of Flow Meter………...5
Figure 5 Photograph of Sediment Delivery Port………5
Figure 6 Photograph of Background Sampling Port……….…. 6
Figure 7 Average Particle Size Distribution of Test Sediment Analyzed by ECS….... 8
Figure 8 Removal Efficiency vs. Sediment Mass Loading……….…. 22
iii List of Tables
Table 1 Sampling Schedule for the EcoPure BioFilterTM Tests………...…7
Table 2 Particle Size Distribution of Test Sediment as Analyzed by ECS……….. 8
Table 3 Flow Rate and Temperature Summary for All Runs……….... 12
Table 4 Maximum Head (inches) for All Runs………...…...13
Table 5 Background TSS Concentrations………... 14
Table 6 Sediment Rate Measurements for Runs 1-10……….………...…15
Table 7 Sediment Rate Measurements for Runs 11-20……….….16
Table 8 Sediment Rate Measurements for Runs 21-26………. 17
Table 9 Removal Efficiency Drawdown Losses……….... 18
Table 10 Removal Efficiency Results……… 20
Table 11 Sediment Mass Loading Summary……….…… 21
Table 12 Scour Run Sampling Schedule……….………...23
Table 13 Scour Run TSS Results………..…. 23
1 1. Description of Technology
The EcoPure BioFilterTM Filtration System (EcoPure BioFilter™), shown in Figure 1, is a stormwater quality manufactured treatment device (MTD) with engineered biofiltration media designed for removing traditional stormwater pollutants of concern. The EcoPure BioFilter™ unit allows for a high treatment flowrate with a smaller footprint than conventional bioretention and filtration (e.g., sand filter) systems.
For this testing, the EcoPure BioFilterTM removes solid “sediment” pollutants from water by three mechanisms: 1) screening, 2) gravitational settling and 3) filtration. The first cell of the EcoPure BioFilterTM allows for gravity-driven settling of coarse particles of sediment, prior to introduction of water to the second cell, which removes sediment and particulate bound pollutants through filtration. For this testing, the filtration occurs when particulates become trapped within the EcoPure BioFilterTM bioretention filter media.
Figure 1 The EcoPure BioFilter™
1
Pretreatment
Gravitational and Trash-removal Cell
2 Biofiltration Cell
3 Pipe or Surface Influent
4 Effluent Pipe
5 High-flow Bypass
6
Internal Manifold and Bioretention Planting Media Layer
7 Trash Screen
8
Riser Pipes (two symmetrical pipes; one visible here)
9 Infiltrator® Chambers 10 Gravel Layer
11
Standpipe for Measuring Hydrostatic Head
2
The EcoPure BioFilterTM, shown in three dimensions in Figure 1, is assembled inside a 4’ x 8’ concrete vault and consists of a pretreatment gravitational settling (Item 1), and a biofiltration cell (Item 2). The structure contains the influent pipe (Item 3) (which could be a curb, gutter, grated inlet, or straight-in pipe), an effluent pipe (Item 4), a high-flow bypass pipe (Item 5), and an internal manifold and bioretention media layer (Item 6) that delivers treated water to the outlet of the EcoPure BioFilterTM. For this testing, the upper bioretention media layer did not include plants.
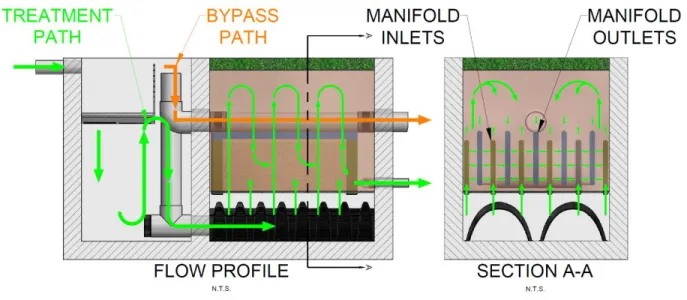
The flow path for the EcoPure BioFilterTM is shown in Figure 2a. Stormwater runoff enters the concrete structure via an influent pipe or surface inlet (Item 3) and begins to fill the first cell of the structure (Item 1), which is 3’ x 4’ and contains a trash/debris screen (Item 7) for removal of large solid materials and disbursement of the influent water such that influent turbulence is reduced. Larger sediment debris is collected, and the coarse sediment particles in the influent settle out in this first cell. When the water surface elevation in the pretreatment cell reaches the level of the top of the “riser” pipes, the water exits via two 6”-diameter riser pipes (Item 8; two symmetrical pipes; one visible in Figure 1) and flows into the bottom of the second cell. (The first cell also includes a third riser pipe at a higher elevation, which serves as the inlet to the internal high-flow bypass (Item 5), which is constructed of a solid-wall pipe.). Water then flows to the second cell (Item 2) and through the filtration bioretention media, driven by hydrostatic head. In the second cell, the water fills from the bottom through Infiltrator® chambers (Item 9) and a gravel layer (Item 10), is distributed through multiple manifold inlets, then flows horizontally and vertically through the bioretention media bed, where pollutants are removed, and then flows downward through multiple manifold outlets, and out through the effluent pipe (Item 4). The standpipe (Item 12), used to measure hydrostatic head during testing, is part of the tested unit only.
Figure 2a Flow Path of the EcoPure BioFilter™
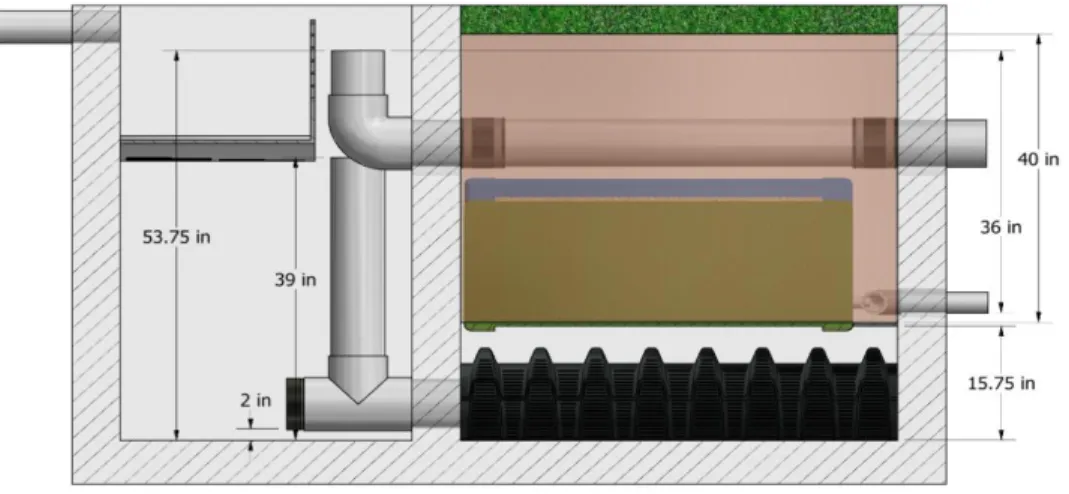
Figure 2b provides section dimensions for the NJCAT “tested” EcoPure BioFilter™ Unit. The 4’ x 8’ EcoPure BioFilterTM has 60 square feet of effective filtration treatment area (See page 24 for calculation details.). This is calculated from the surface area of the manifold outlet piping installed
3
in the filter bed through which the effluent filtered water flows. The maximum treatment flow rate (MTFR) is 60 gpm for this tested unit. The effective filtration area is based on the square footage of the exiting manifold. Separation between inlet and outlet manifolds is approximately 3”. Complete details of the design, operation, and maintenance of the EcoPure BioFilterTM are available in the EcoPure BioFilterTM Technical and Design Manual, available electronically at https://baysaver.com/resources/.
Figure 2b Key Dimensions of the EcoPure BioFilter™
2. Laboratory Testing
Beginning in December 2019, one EcoPure BioFilterTM 4’ x 8’ commercial size unit was installed at the BaySaver Laboratory in Mount Airy, Maryland, to evaluate the performance of the EcoPure BioFilterTM on Total Suspended Solids (TSS) removal. Boggs Environmental Consultants (BEC) provided third-party review and oversight of all testing and data collection in accordance with the
New Jersey Department of Environmental Protection Laboratory Protocol to Assess Total
Suspended Solids Removal by a Filtration Manufactured Treatment Device (January 2013). All
sediment concentration samples were analyzed by Fredericktowne Labs (FTL) using ASTM D3977-97 (re-approval 2007). All sediment particle size distribution (PSD) analysis was performed by Environmental Consulting Services (ECS), using the methodology of ASTM D422-63. Prior to the start of testing, a Quality Assurance Project Plan (QAPP), revision dated December 3, 2019, was submitted and approved by the New Jersey Corporation for Advanced Technology (NJCAT).
2.1 Test Setup
The testing system, shown in Figure 3, consisted of source tanks, feed pump, flow control valve, flow meter in a vertical up-flow configuration, background sample port, screw-auger sediment doser, and an EcoPure BioFilterTM.
4 Figure 3 Schematic of the EcoPure BioFilterTM Test Configuration
Testing Procedure
The water source was potable water from the Town of Mount Airy, MD, Water and Sewer Department, obtained from an onsite tap. Municipal tap water was used to fill the source tanks, and then pumped to the system. Flow rate was controlled to the target of 60 gpm by a flow control valve. A calibrated inline flow meter (Seametrics IMAG4700P) measured and recorded the flow rate at one-minute intervals (pictured in Figure 4). Approximately four feet upstream of the system inlet, sediment was introduced to the feed stream via a dosing port (pictured in Figure 5); dosing rate was controlled by a screw-auger Velodyne Barracuda 500A volumetric feeder with a ½ HP variable speed motor. The dosing rate was set to deliver an amount of sediment that, when mixed with the water from the source tank, would produce influent water with a target test sediment concentration of 200 mg/L.
5 Figures 4 and 5 Photographs of Flow Meter and Sediment Delivery Port
Flow entered the concrete structure via the influent pipe and began to fill the first cell. Once the water level reached the top of the riser pipes (Item 8; two symmetrical pipes; only one is visible in Figure 1) in the first cell, water began to flow to the second cell and flowed through the filtration bio-media, driven by hydrostatic head. A standpipe (Item 11) indicated the water head level. The treated water exited via a pipe near the bottom of the EcoPure BioFilterTM bioretention media bed.
Test Unit and Scaling Explanation
The EcoPure BioFilterTM model tested contains the same depth of media, composition of media, and gradation of media as all commercial models. The only major difference in the EcoPure BioFilter™ model tested is that no established plant life was included on top of the biofiltration cell. The effective filtration treatment area loading rate is 1.0 gpm/ft2, and the ratio of effective sedimentation treatment area to effective filtration treatment area is 0.5. The ratio of wet volume to effective filtration treatment area is 0.94 ft. Given these data, we can effectively scale the test results for all commercial systems.
Sample Collection
The grab sampling method was used for all sample collection by sweeping a wide-mouth 1-L plastic bottle through an open flowing stream, to ensure the full cross section of the flow was sampled. The start time for each run was recorded.
The sampling schedule is provided in Table 1. The detention time for the EcoPure BioFilterTM is 7 minutes. To comply with the NJDEP Filter Protocol, after initiating and stabilizing the MTFR flow rate and beginning sediment feed, effluent sampling did not begin until the filtration MTD had been in operation for a minimum of three detention times.
6
Background water samples were collected upstream of the doser (Figures 3 and 6) in correspondence with the odd-numbered effluent samples (i.e., Samples E1, E3, E5 at t = 27, 57, 87 minutes).
Figure 6 Photograph of Background Sampling Port
Two evenly-volume-spaced drawdown samples, DDA and DDB, were taken after the flow and sediment feed to the unit had been stopped.
Sediment sample rates were measured using a stopwatch, once at the very beginning of the run and twice more during the run. The duration of each run was 89 minutes.
7 Table 1 Sampling Schedule for the EcoPure BioFilterTM Tests
Time (min) Sample(s) Time (min) Sample(s)
0 S1 59 S3
27 E1, BG1 87 E5, BG5
28 E2 88 E6
29 S2 89 Stop Flow
57 E3, BG3 N/A DDA
58 E4 N/A DDB
NOTE: S = sediment rate; E = effluent; BG = background; DD = drawdown
A Chain of Custody (COC) form was used for each test run to record sampling date and time for externally analyzed samples. Copies of these forms were maintained by the BaySaver Laboratory and FTL. Sample bottles were labeled to identify the test run number and sample type (e.g., background, effluent), corresponding to the sample identification on the COC form. BEC was present and witnessed labeling, completion of COC forms, and packaging of samples for delivery to the external laboratory (FTL). Each person taking or relinquishing possession of the samples was required to sign a COC form before samples changed hands.
Other Instrumentation and Measurement
Water temperature was recorded every minute by a HOBO data logger placed in the first cell of the EcoPure BioFilterTM. The water level in the second cell of the EcoPure BioFilterTM was recorded every 5 minutes by visual observation of an externally-mounted manometer (standpipe); readings were performed by BEC personnel. Run times and sampling times were measured using a digital timer and a stopwatch, respectively.
2.2 Test Sediment
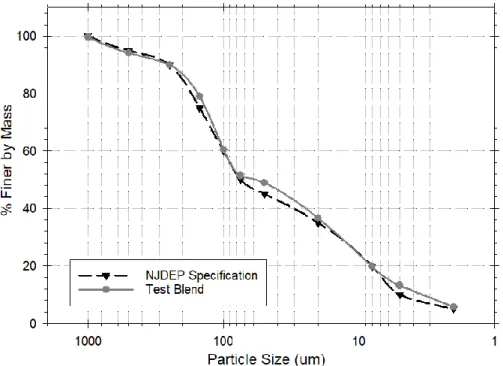
The test sediment had the particle size distribution (PSD) presented in Figure 7. The test sediment blend was custom-blended using various commercially available silica sands, the blend ratio of which was determined such that the size distribution of the resulting blended sediment would meet the specification for the NJDEP Filter Protocol. The test sediment was batched, labeled, and stored in covered bins for the duration of this project. Under the supervision of BEC, twenty-four subsamples, taken from various locations within the test sediment containers, were composited. From the composite, three random samples were taken for analysis, which was performed by ECS, using the methodology of ASTM method D422-63.
The PSD test results are also summarized in Table 2. ECS results showed that 19-20% of the test sediments were less than 8 microns (µm) and 89-90% of the test sediments were less than 250 µm. The median size particles d50 values (approximately 61 µm) also indicated that there was no significant difference between the NJDEP target gradation and the ECS-analyzed gradation of the test sediment. Thus, the blended test sediment was found to meet the NJDEP particle size
8
specification and was acceptable for use. ECS also analyzed the sediment samples for moisture. The average moisture content was less than 0.1%.
Figure 7 Average Particle Size Distribution of Test Sediment Analyzed by ECS Table 2 Particle Size Distribution of Test Sediment as Analyzed by ECS
Particle Size (µm)
Test Blend % Finer by Mass Analyzed by ECS
NJ Blend A NJ Blend B NJ Blend C Average NJDEP Specification (minimum % passing) 1000 99.6 99.6 99.5 99.6 98 500 94.3 94.2 93.9 94.1 93 250 90.2 90.1 89.6 90.0 88 150 79.3 79.2 78.5 79.0 73 100 59.9 61.1 60.6 60.5 58 75 50.7 52.4 51.0 51.4 50 50 48.2 50.3 48.3 48.9 43 20 36.4 36.6 36.6 36.6 33 8 19.6 20.0 19.7 19.8 18 5 13.2 13.3 13.2 13.2 8 2 5.8 5.5 5.8 5.7 3
9 2.3 Sediment Removal Efficiency Testing
Sediment removal efficiency testing adhered to the guidelines set forth in Section 5 of the NJDEP Laboratory Protocol for Filtration MTDs. The target flow rate through the system was 60 gpm, with a target sediment concentration of 200 mg/L. All samples were collected in clean, 1-L wide-mouth bottles. Three background samples were taken at 27, 57 and 87 minutes after the test began to ensure the tap water source met the sediment concentration requirement. According to the NJDEP Filter Protocol, these background concentrations cannot exceed a TSS of 20 mg/L.
The test sediment screw-auger feeder (doser) introduced the test sediment into the feed water stream to achieve the target influent TSS concentration of 200 mg/L. According to the NJDEP Filter Protocol, this influent concentration must stay within 10% of target, allowing for a 180 mg/L to 220 mg/L influent concentration. The feeder was calibrated prior to each run. In order to confirm sediment feed rates during the test, in accordance with the NJDEP Filter Protocol, three samples of the test sediment were collected from the injection point (Figure 3, “Doser”) into a clean one-liter container for verification of sediment feed rate, over an interval timed to the nearest second, with a minimum volume of 0.1 liter or a collection interval not exceeding one minute (whichever came first). The time was kept with a stopwatch. The samples were weighed to the nearest milligram in the BaySaver Laboratory under the observation of BEC. The sediment feed rate coefficient of variance (COV) for the test sediment samples did not exceed 0.10. The mass from the sediment feed rate measurement samples was subtracted from the total mass introduced to the system when removal efficiency was calculated.
Effluent sampling was performed by the grab sampling method during each run, according to the schedule in Table 1. When the test sediment feed was interrupted for test sediment measurements, the next effluent samples were collected after at least three detention times had elapsed. During the drawdown period, two evenly-volume-spaced effluent samples were collected after flow and sediment feed had stopped. All sediment concentration samples were analyzed by Fredericktowne Labs (FTL) using the ASTM D3977-97 (re-approval 2007) “Standard Test Methods for Determining Sediment Concentrations in Water Samples.”
2.4 Sediment Mass Loading Capacity Testing
The sediment mass loading capacity testing occurred as a continuation of the removal efficiency testing, with the target for influent concentration remaining at 200 mg/L, and all aspects of testing procedures kept the same to ensure consistency throughout. The sediment mass loading capacity of the EcoPure BioFilterTM was defined as the cumulative mass loading of the unit at the end of the test run during which the maximum driving head was reached while operating at 54 gpm (90% of MTFR). In this testing program, the EcoPure BioFilterTM reached maximum driving head (36 inches) at 60 gpm (100% of MTFR) during Run 21. The feed flow rate was then reduced to 54 gpm (90% of MTFR), and testing continued until the maximum driving head was reached once again (Run 26).
10 2.5 Scour Testing
Scour testing was performed to demonstrate that the EcoPure BioFilterTM can be located on-line. The test was performed at an average feed flow rate of 111.2 gpm (185% of the MTFR), the maximum flow rate that could be delivered by the test setup. In accordance with the NJDEP Filter Protocol, the average effluent concentration during the scour run must be less than 20 mg/L above the background concentration.
Scour testing was performed on the same EcoPure BioFilterTM used for removal efficiency and mass loading capacity testing, after all that testing was complete. Thus, the scour test took place on a unit that had already been pre-loaded with 100% of the manufacturer’s recommended maximum sediment storage volume (determined by mass loading capacity testing, Sections 2.4 and 5.5).
The scour testing commenced by gradually introducing and increasing clear water into the test unit until the flow rate stabilized at 111 gpm (five minutes). Effluent samples were collected utilizing the Effluent Grab Sampling Method every two minutes afterward. Fifteen effluent samples were collected in clean, 1-L bottles. Flow rate was recorded every minute.
Eight background samples were collected at the same time as the odd-numbered effluent samples (first, third, fifth, etc.). All samples collected (background and effluent) were analyzed by FTL for TSS according to ASTM D3977-97 (re-approval 2007) “Standard Test Methods for Determining Sediment Concentrations in Water Samples.” In accordance with the NJDEP Filter Protocol, all background concentrations must be less than 20 mg/L.
All effluent sample results from the scour test run were adjusted by subtracting the background concentration from the recorded effluent sample concentration.
3. Performance Claims
Per the NJDEP verification procedure and based on the laboratory testing conducted for the EcoPure BioFilterTM model tested (4’ x 8’), the following are the performance claims made by Advanced Drainage Systems, Inc.
Total Suspended Solids (TSS) Removal Efficiency
Based on the laboratory testing conducted, the EcoPure BioFilterTM achieved 88.0% cumulative TSS removal efficiency.
Maximum Treatment Flow Rate (MTFR)
The EcoPure BioFilterTM model tested (4’ x 8’) has an MTFR of 0.13 cfs (60 gpm) and an effective filtration treatment area (EFTA) of 60 ft2 (loading rate = 1.0 gpm/ft2).
11 Detention Time and Volume
The EcoPure BioFilterTM model tested (4’ x 8’) wet volume is 56 ft3, and the detention time is about 7 minutes at the test flow rate of 60 gpm.
Effective Sedimentation Treatment Area
The Effective Sedimentation Treatment Area (ESTA) increases as the size of the EcoPure BioFilterTM increases, with a larger system having a higher ESTA. Under test conditions with a single 4’ x 8’ unit, the ESTA is 30 ft2 and the ratio ESTA/EFTA is 0.5.
Sediment Load Capacity/Mass Load Capture Capacity
Based on laboratory testing results, the EcoPure BioFilterTM model tested (4’ x 8’) has a mass loading capacity of 221lbs and a mass loading capture capacity of 194.5 lbs.
Maximum Allowable Inflow Drainage Are
Laboratory testing results show that 221lbs of sediment can be loaded into a 4ft x 8ft EcoPure BioFilterTM with internal bypass, while achieving a cumulative sediment mass removal efficiency of 88.0% (mass loading capture capacity = 194.5 lbs). Per the NJDEP Filter Protocol, to calculate the maximum inflow drainage area, the total sediment load captured mass observed during the test (194.5 lbs) is divided by 600 lb./acre. Thus, the maximum inflow drainage area is 0.324 acres.
4. Supporting Documentation
The Procedure for Obtaining Verification of a Stormwater Manufactured Treatment Device from NJCAT states that copies of the laboratory test reports, all data from performance evaluation test runs, original data, pertinent calculations, and documentation of any maintenance activities that occur during the testing process are to be included in this section. This information has been made available to NJCAT and is available upon request.
5. Testing Results
A total of 26 removal efficiency test runs were completed in accordance with the NJDEP filter protocol. The target flow rate and influent sediment concentration were 60 gpm and 200 mg/L, respectively. The results from all 26 runs were used to calculate the overall cumulative removal efficiency of the EcoPure BioFilterTM.
5.1 Flow Rate
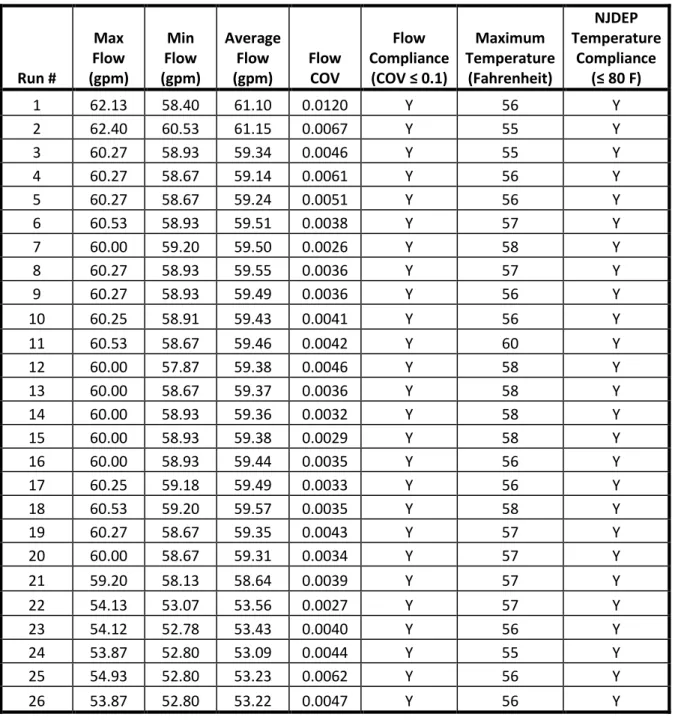
Flow rate was recorded by a Seametrics IMAG4700P Flow Meter every minute during each run. For each run, the flow rate was maintained within 10% of the target flow rate (54 - 66 gpm at 100% MTFR, and 48.6 – 59.4 gpm at 90% MTFR). The average flow rate for the first 21 runs (100% MTFR) was 59.5 gpm. The average flow rate for Runs 22 through 26 (90% of MTFR) was 53.3 gpm. The flow data with coefficient of variation (COV) values for all 26 runs are summarized in Table 3.
12 5.2 Water Temperature
Temperatures were recorded every minute by a HOBO water level logger (U20L-04). On average for all 26 runs, the water temperature during testing was 55.5 degrees Fahrenheit, with a maximum of 59.5 degrees Fahrenheit, meeting the NJDEP Filter Protocol requirement to be no greater than 80 degrees Fahrenheit. Data are summarized in Table 3.
Table 3 Flow Rate and Temperature Summary for All Runs
Run # Max Flow (gpm) Min Flow (gpm) Average Flow (gpm) Flow COV Flow Compliance (COV ≤ 0.1) Maximum Temperature (Fahrenheit) NJDEP Temperature Compliance (≤ 80 F) 1 62.13 58.40 61.10 0.0120 Y 56 Y 2 62.40 60.53 61.15 0.0067 Y 55 Y 3 60.27 58.93 59.34 0.0046 Y 55 Y 4 60.27 58.67 59.14 0.0061 Y 56 Y 5 60.27 58.67 59.24 0.0051 Y 56 Y 6 60.53 58.93 59.51 0.0038 Y 57 Y 7 60.00 59.20 59.50 0.0026 Y 58 Y 8 60.27 58.93 59.55 0.0036 Y 57 Y 9 60.27 58.93 59.49 0.0036 Y 56 Y 10 60.25 58.91 59.43 0.0041 Y 56 Y 11 60.53 58.67 59.46 0.0042 Y 60 Y 12 60.00 57.87 59.38 0.0046 Y 58 Y 13 60.00 58.67 59.37 0.0036 Y 58 Y 14 60.00 58.93 59.36 0.0032 Y 58 Y 15 60.00 58.93 59.38 0.0029 Y 58 Y 16 60.00 58.93 59.44 0.0035 Y 56 Y 17 60.25 59.18 59.49 0.0033 Y 56 Y 18 60.53 59.20 59.57 0.0035 Y 58 Y 19 60.27 58.67 59.35 0.0043 Y 57 Y 20 60.00 58.67 59.31 0.0034 Y 57 Y 21 59.20 58.13 58.64 0.0039 Y 57 Y 22 54.13 53.07 53.56 0.0027 Y 57 Y 23 54.12 52.78 53.43 0.0040 Y 56 Y 24 53.87 52.80 53.09 0.0044 Y 55 Y 25 54.93 52.80 53.23 0.0062 Y 56 Y 26 53.87 52.80 53.22 0.0047 Y 56 Y
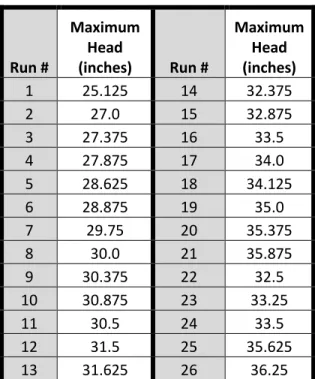
13 5.3 Head
The head level in the second cell bioretention filter media of the EcoPure BioFilterTM was recorded to the nearest 1/8 inch (0.125 in) every five minutes by BEC personnel, through visual observation of an externally-mounted manometer (standpipe). With each run, the head during the run increased slightly over that of the previous run, until reaching the maximum (36 inches) in Run 21. Beginning with Run 22, the flow rate was reduced to 90% MTFR (54 gpm), and the maximum head decreased by about 3 inches from Run 21 to Run 22. The head then progressively increased again with each successive run, until once again reaching the maximum during Run 26. Maximum head for each run is summarized in Table 4.
Table 4 Maximum Head (inches) for All Runs
Run # Maximum Head (inches) Run # Maximum Head (inches) 1 25.125 14 32.375 2 27.0 15 32.875 3 27.375 16 33.5 4 27.875 17 34.0 5 28.625 18 34.125 6 28.875 19 35.0 7 29.75 20 35.375 8 30.0 21 35.875 9 30.375 22 32.5 10 30.875 23 33.25 11 30.5 24 33.5 12 31.5 25 35.625 13 31.625 26 36.25
Note: Per the requirements of the NJ Filter Protocol, the head measurements for this testing were made using a yard stick, read to the nearest 1/8 inch (0.125 in).
5.4 Sediment Concentration and Removal Efficiency Background TSS
Municipal tap water was used as the water source during testing. Overall, the average background TSS concentration was 0.9 mg/L, which is far below the 20 mg/L NJDEP Protocol limit. Background TSS concentrations for each run are provided in Table 5. The average background TSS concentration for each run was subtracted from effluent and drawdown TSS concentrations to provide adjusted figures, per the protocol.
14 Table 5 Background TSS Concentrations
Run # Background TSS (mg/L) NJDEP Background TSS Compliance (≤ 20 mg/L) Run # Background TSS (mg/L) NJDEP Background TSS Compliance (≤ 20 mg/L) 1 0.8 Y 14 0.5 Y 2 0.5 Y 15 0.5 Y 3 0.5 Y 16 0.5 Y 4 0.5 Y 17 0.5 Y 5 0.7 Y 18 0.5 Y 6 0.5 Y 19 0.5 Y 7 0.5 Y 20 0.5 Y 8 0.5 Y 21 0.7 Y 9 0.5 Y 22 0.5 Y 10 0.5 Y 23 0.5 Y 11 0.5 Y 24 0.7 Y 12 0.5 Y 25 1.5 Y 13 0.5 Y 26 8.7 Y MEAN Background TSS (mg/L) 0.9 Y
Sediment Dosing Rate and Influent TSS
Influent TSS concentration was calculated by dividing the total mass of sediment added during a given run by the total volume of water flowing through the MTD during the addition of test sediment during that run. The volume of water flowing through the device during the run was calculated by multiplying the average feed flow rate by the time of sediment addition only. The average influent TSS was 201 mg/L, with individual run averages ranging from 187 to 214 mg/L. All values are within the target range of 200 ± 20 mg/L. Tables 6, 7 and 8 provide the measured sediment feed rates for each run, and the resulting calculated influent TSS concentration. In these tables, NJDEP Protocol compliance is defined as a TSS concentration in the range 180 – 200 mg/L and COV ≤ 0.1.
15 Table 6 Sediment Rate Measurements for Runs 1-10
Run Run Time (min) Sediment Weight (g) Duration (s) Sediment Feed Rate (g/min) Influent Water Flow Rate (gpm) Influent TSS Conc. (mg/L) NJDEP Compliance 1 0 47.602 60 47.6 61.1 199.6 Y 29 44.047 60 44.0 59 46.773 60 46.8 COV 0.0403 2 0 45.301 60 45.3 61.1 193.4 Y 29 42.010 60 42.0 59 46.955 60 47.0 COV 0.0563 3 0 45.051 60 45.1 59.3 200.3 Y 29 42.730 60 42.7 59 47.156 60 47.2 COV 0.0492 4 0 47.747 60 47.7 59.1 207.9 Y 29 44.635 60 44.6 59 47.176 60 47.2 COV 0.0356 5 0 47.658 60 47.7 59.2 213.8 Y 29 47.085 60 47.1 59 49.082 60 49.1 COV 0.0214 6 0 43.009 60 43.0 59.5 202.2 Y 29 47.507 60 47.5 59 46.205 60 46.2 COV 0.0508 7 0 47.386 60 47.4 59.5 211.3 Y 29 48.429 60 48.4 59 46.949 60 46.9 COV 0.0160 8 0 44.529 60 44.5 59.5 195.8 Y 29 43.962 60 44.0 59 43.866 60 43.9 COV 0.0081 9 0 43.898 60 43.9 59.5 203.8 Y 29 45.691 60 45.7 59 48.147 60 48.1 COV 0.0465 10 0 44.429 60 44.4 59.4 200.4 Y 29 45.413 60 45.4 59 45.414 60 45.4 COV 0.0126
16 Table 7 Sediment Rate Measurements for Runs 11-20
Run Run Time (min) Sediment Weight (g) Duration (s) Sediment Feed Rate (g/min) Influent Water Flow Rate (gpm) Influent TSS Conc. (mg/L) NJDEP Compliance 11 0 44.174 60 44.2 59.5 200.2 Y 29 44.676 60 44.7 59 46.345 60 46.3 COV 0.0252 12 0 46.507 60 46.5 59.4 207.7 Y 29 45.916 60 45.9 59 47.662 60 47.7 COV 0.0190 13 0 44.704 60 44.7 59.4 195.2 Y 29 43.830 60 43.8 59 43.038 60 43.0 COV 0.0190 14 0 45.266 60 45.3 59.4 196.8 Y 29 43.566 60 43.6 59 43.776 60 43.8 COV 0.0210 15 0 44.085 60 44.1 59.4 187.5 Y 29 41.147 60 41.1 59 41.128 60 41.1 COV 0.0404 16 0 44.016 60 44.0 59.4 199.8 Y 29 46.156 60 46.2 59 44.698 60 44.7 COV 0.0243 17 0 43.407 60 43.4 59.5 197.1 Y 29 45.096 60 45.1 59 44.707 60 44.7 COV 0.0199 18 0 47.519 60 47.5 59.6 205.8 Y 29 46.684 60 46.7 59 45.000 60 45.0 COV 0.0276 19 0 45.828 60 45.8 59.4 198.9 Y 29 45.245 60 45.2 59 42.913 60 42.9 COV 0.0345 20 0 44.048 60 44.0 59.3 204.4 Y 29 44.748 60 44.7 59 48.952 60 49.0 COV 0.0578
17 Table 8 Sediment Rate Measurements for Runs 21-26
Run Run Time (min) Sediment Weight (g) Duration (s) Sediment Feed Rate (g/min) Influent Water Flow Rate (gpm) Influent TSS Conc. (mg/L) NJDEP Compliance 21 0 42.850 60 42.9 58.6 200.5 Y 29 47.068 60 47.1 59 43.690 60 43.7 COV 0.0501 22 0 41.079 60 41.1 53.6 202.1 Y 29 41.766 60 41.8 59 40.052 60 40.1 COV 0.0211 23 0 38.658 60 38.7 53.4 193.4 Y 29 40.431 60 40.4 59 38.251 60 38.3 COV 0.0296 24 0 40.129 60 40.1 53.1 186.5 Y 29 34.942 60 34.9 59 37.295 60 37.3 COV 0.0693 25 0 42.748 60 42.7 53.2 209.9 Y 29 42.884 60 42.9 59 41.272 60 41.3 COV 0.0211 26 0 40.369 60 40.4 54.0 203.8 Y 29 40.138 60 40.1 59 42.716 60 42.7 COV 0.0347 Effluent TSS
During each run, grab samples were taken of the effluent according to the schedule in Table 1, and all TSS analysis was conducted by Fredericktowne Labs. For each run, the average effluent concentration was adjusted by subtracting the average background TSS concentration. The average adjusted effluent TSS concentration during testing was 24 mg/L, with individual run averages ranging from 21 to 30 mg/L. Adjusted effluent TSS concentrations for each run are given in Table 10.
Drawdown TSS
According to the NJDEP Filter Protocol, the amount of sediment that leaves the filter during the drawdown period must be accounted for and documented. For each run, two evenly-volume- spaced grab samples were taken of the effluent during drawdown, and all TSS analysis was conducted by Fredericktowne Labs. For each run, the average drawdown concentration was adjusted by subtracting the average background TSS concentration. The average adjusted drawdown TSS was 25 mg/L, with individual run averages ranging from 17 to 56 mg/L. In order
18
to estimate the volume of water during drawdown, under observation by BEC, the unit was filled prior to all testing with clean water and the drawdown volume as a function of time was measured using the timed bucket method. Total drawdown volume was estimated at 117.5 gal at an operating head of 24 inches. This volume was used to determine the void fraction of the media bed, which was then used to calculate the drawdown volume for incremental head levels above 24 inches. Adjusted average drawdown TSS concentrations and drawdown losses are given in Table 9.
Table 9 Removal Efficiency Drawdown Losses
Run # Head Level at End of Run (in) Drawdown Volume (gal) Average Adjusted Drawdown TSS Conc. (mg/L) Total Sediment Lost During Drawdown (g) 1 25.125 121.7 38.0 17.5 2 27.0 128.8 41.5 20.2 3 27.25 129.7 38.0 18.7 4 27.875 132.1 56.0 28.0 5 28.625 134.9 32.5 16.6 6 28.75 135.4 28.5 14.6 7 29.75 139.1 24.0 12.6 8 29.875 139.6 19.0 10.0 9 30.375 141.5 22.0 11.8 10 30.75 142.9 21.0 11.4 11 30.5 141.9 19.5 10.5 12 31.5 145.7 19.5 10.8 13 31.5 145.7 17.5 9.7 14 32.25 148.5 20.0 11.2 15 32.875 150.9 19.5 11.1 16 33.375 152.8 24.5 14.2 17 33.875 154.6 22.5 13.2 18 34.125 155.6 22.5 13.3 19 35.0 158.9 22.5 13.5 20 35.25 159.8 24.0 14.5 21 35.875 162.2 23.0 14.1 22 32.5 149.5 18.0 10.2 23 33.25 152.3 18.5 10.7 24 33.5 153.2 18.5 10.7 25 35.5 160.7 20.5 12.5 26 36.25 163.6 29.0 18.0
19 Removal Efficiency Calculation
Removal efficiency was calculated using the following equation from the NJDEP Filter Protocol:
100 x Test Water of Volume Total ion x Concentrat TSS Effluent Average ater Drawdown W of Volume Total ion x Concentrat TSS Flow Drawdown Average ater Effluent W of Volume Total ion x Concentrat TSS Eflluent Adjusted Test Water of Volume Total ion x Concentrat TSS Influent Average (%) Efficiency Removal − − =
For each run, sediment concentrations of background, influent, effluent, and drawdown, as well as calculated removal efficiency, are summarized in Table 10. As shown in this summary table, the EcoPure BioFilterTM demonstrated a cumulative sediment removal efficiency of 88.0% over the course of 26 test runs. No removal efficiencies below 80% were experienced.
20 Table 10 Removal Efficiency Results
Run # Average Influent TSS (mg/L) Influent Water Volume (gal) Adjusted Average Effluent TSS (mg/L) Effluent Water Volume (gal) Adjusted Average Drain Down TSS (mg/L) Drain Down Water Volume (gal) Single Run Removal Efficiency (%) Mass of Captured Sediment (g) Cumulative Removal Efficiency (%) 1 200 5316 21 5194 37 122 89.1 3579 89.1 2 193 5320 23 5191 41 129 88.0 3429 88.6 3 200 5162 22 5032 38 130 88.7 3473 88.6 4 208 5145 24 5013 56 132 88.1 3568 88.5 5 214 5154 24 5019 32 135 88.5 3692 88.5 6 202 5177 24 5042 28 135 87.9 3484 88.4 7 211 5177 26 5038 24 139 88.0 3641 88.4 8 196 5180 24 5041 19 140 87.7 3368 88.3 9 204 5175 26 5034 22 141 87.5 3492 88.2 10 200 5170 26 5027 21 143 87.2 3419 88.1 11 200 5173 24 5031 19 142 88.3 3462 88.1 12 208 5166 25 5021 19 146 87.9 3570 88.1 13 195 5165 23 5020 17 146 88.4 3373 88.1 14 197 5164 24 5016 20 149 87.9 3380 88.1 15 187 5166 22 5016 19 151 88.5 3244 88.1 16 200 5171 30 5018 24 153 85.3 3336 87.9 17 197 5176 26 5021 22 155 87.0 3361 87.9 18 206 5182 27 5027 22 156 87.0 3514 87.8 19 199 5164 26 5005 22 159 87.2 3390 87.8 20 204 5160 26 5000 24 160 87.2 3480 87.8 21 201 5102 24 4940 22 162 88.2 3417 87.8 22 202 4660 21 4510 18 149 89.6 3193 87.9 23 193 4649 23 4496 18 152 88.4 3009 87.9 24 187 4619 22 4466 18 153 88.2 2876 87.9 25 210 4631 23 4471 19 161 89.3 3288 88.0 26 204 4630 21 4467 20 164 89.6 3202 88.0 Ave. 200.7 5075 24 4929 24.5 146 88.0 3394 N/A
Cumulative Mass Removed (g) 88242
Cumulative Mass Removed (lbs) 194.5
Total Mass Loaded (lbs) 221.0
21 5.5 Sediment Mass Loading
Sediment mass loading for each run was approximately 8.69 lbs on average for Runs 1-21, and 7.71 lbs for Runs 22-26 (lower for these runs, due to reduced flow rate and a desire to keep the influent TSS concentration at 200 mg/L). These data are summarized in Table 11.
Table 11 Sediment Mass Loading Summary
Run # Sediment Loading (lbs) Cumulative Sediment Loading (lbs) Run # Sediment Loading (lbs) Cumulative Sediment Loading (lbs) 1 8.85 8.9 14 8.48 122.4 2 8.59 17.4 15 8.08 130.5 3 8.63 26.1 16 8.62 139.2 4 8.93 35.0 17 8.51 147.7 5 9.19 44.2 18 8.90 156.6 6 8.74 52.9 19 8.57 165.1 7 9.13 62.0 20 8.80 173.9 8 8.46 70.5 21 8.54 182.5 9 8.80 79.3 22 7.86 190.3 10 8.65 88.0 23 7.50 197.8 11 8.64 96.6 24 7.19 205.0 12 8.96 105.6 25 8.11 213.1 13 8.41 114.0 26 7.88 221.0
Sediment mass loading was calculated from the summation of the total sediment mass added during dosing in each run.
Overall, a total of 221 lbs of sediment was loaded into the EcoPure BioFilterTM over the course of the 26 runs. Total captured mass over the 26 runs was 194.5 lbs (Table 10).
The relationship between removal efficiency and sediment mass loading is shown in Figure 8. The relationship between driving head and sediment mass loading is shown in Figure 9.
22 Figure 8 Removal Efficiency vs. Sediment Mass Loading
23 5.6 Scour
The scour test took place on a unit that had been pre-loaded with 100% of the manufacturer’s recommended maximum sediment storage volume (which occurred during removal efficiency and sediment mass capacity testing). Scour testing was conducted in accordance with Section 4 of the NJDEP Filter Protocol, except for loading, which was done as part of the mass removal efficiency and sediment mass loading testing described above. The target scour testing flow rate was achieved 5 minutes after initiating flow to the system; effluent sampling began 2 minutes after that, and background samples were taken with odd-numbered effluent samples, according to the schedule shown in Table 12.
Table 12 Scour Run Sampling Schedule
Sample Run Time (min)
0 2 4 6 8 10 12 14 16 18 20 22 24 26 28 30
Effluent X X X X X X X X X X X X X X X
Background X X X X X X X X
Note: The Run Time of 0 minutes was the time at which the target flow rate was achieved.
The flow rate during the scour run averaged 111.2 gpm (185% of MTFR), with a COV of 0.003, which is in compliance with the NJDEP Filter Protocol. The maximum temperature during the scour run was 56.8 degrees Fahrenheit, which is also in compliance with the NJDEP Filter Protocol.
Scour test TSS results are presented in Table 13. The maximum background TSS concentration was 2 mg/L, which is far below the maximum of 20 mg/L allowed by the NJDEP Filter Protocol. Each effluent TSS concentration was adjusted by subtracting the background concentration. For samples that did not have a corresponding background sample, the background TSS concentration was interpolated from the previous and subsequent background samples’ TSS concentration. The average adjusted TSS concentration of the effluent is 2 mg/L. As this value is below the NJDEP-Protocol-specified limit of 20 mg/L, the EcoPure BioFilterTM met the requirement for on-line use.
Table 13 Scour Run TSS Results
Scour Test TSS Concentrations (mg/L)
Sample # 1 2 3 4 5 6 7 8 9 10 11 12 13 14 15
Effluent 16 6 6 3 3 2 4 2 2 2 2 2 1 1 1
Background 2 2 2 1 2 1 1 1
Adjusted
Effluent 14 4 4 1 1 0.5 3 0.5 0 0.5 1 1 0 0 0
24 6. Design Limitations
Maximum Flow Rate
The 4’ x 8’ EcoPure BioFilterTM tested has an MTFR of 0.13 cfs (60 gpm) and an effective filtration treatment area (EFTA) of 60 ft2 (loading rate = 1.0 gpm/ft2). The EFTA is calculated by the surface area of the exiting manifold. The exiting manifold consists of five (5) double sided perforated HDPE flat panel pipes that are 4 feet long and 18” in height. EFTA = 5 panels x 2 sides x 4 ft in length x 1.5 ft in height = 60 ft2. Commercial units only vary in the length of the manifold systems, i.e., a 4 x16 unit has 120 ft2 of exiting manifold area. The loading rate of 1.0 gpm/ ft2 is constant.
Slope
The EcoPure BioFilterTM is recommended for installation with little-to-no slope to ensure proper, consistent operation. Steep slopes should be reviewed by ADS/BaySaver Engineering support.
Allowable Head Loss
There is an operational head loss associated with the EcoPure BioFilterTM. The head loss will increase over time due to the sediment loading to the system. When configured with an internal bypass, a design head loss of 36 inches should be used. Site-specific treatment flow rates, peak flow rates, pipe diameter, and pipe slopes should be evaluated to ensure there is appropriate head for the system to function properly.
Sediment Load Capture Capacity
Based on laboratory testing results, the EcoPure BioFilterTM model tested has a mass loading capacity of 221 lbs while operating at a sediment removal efficiency of 88.0%; the total sediment load captured by the tested EcoPure BioFilterTM is 194.5 lbs, which is the governing value for calculating allowable drainage area.
Pre-treatment Requirements
The EcoPure BioFilterTM does not require additional pretreatment.
Configurations
The EcoPure BioFilterTM is available in multiple configurations, with curb, gutter, grated inlet, or straight-in pipe inlets. The EcoPure BioFilter™ can be installed above (i.e., planter box), or at grade with a planting bed to allow maximum design flexibility.
Structure Load Limitations
The EcoPure BioFilterTM is typically located adjacent to a roadway and therefore, the precast vault or structure is designed to handle H-20 traffic loads. For deeper installations or installations requiring a greater load capacity, the system will be designed and manufactured to meet those
25
requirements. ADS/BaySaver provides full-service technical design support throughout the life of a project and can help ensure the system is designed for the appropriate structural load requirements.
7. Maintenance Plan General Inspection
The ADS inspection process for the EcoPure BioFilterTM is detailed in the Operation and Maintenance Guidelines and is available electronically at https://baysaver.com/resources/, under the EcoPure BioFilterTM information section. It is also provided to the owner at the time of installation and detailed in this report.
ADS recommends inspecting the EcoPure BioFilterTM quarterly for the first year of service, and after every significant storm event occurring during the first six months. The definition of a significant storm event will vary depending on the geographic area, but if the event is greater than 1 inch of intensity within an hour or 3 inches within a 24-hour period, the system should be inspected. After the first year, systems should be inspected at least bi-annually and ideally before the spring or rainy season and after the summer season, or prior to fall or winter seasons. It is recommended that some general “good housekeeping” maintenance be performed at the beginning of the rainy or spring season every year.
For maintenance needs related to the top plant section of the EcoPure BioFilterTM the process follows the practices used for handling standard bioretention systems (i.e., general landscaping, cover management, and replacement planting of surface plants). Additional maintenance involving removing some of the captured sediment is not possible in many bioretention systems (both generic and proprietary) in that once sediment introduced and lost into the media of those systems, it cannot be readily extracted. For the EcoPure BioFilter™ design, a sizable amount of collected sediment can be removed from the pretreatment cell and the bottom cavity of the bioretention cell before it enters into the bioretention media matrix. This ability assists in “adding” to the longevity of the EcoPure BioFilter™ bioretention soil media. This is explained in greater detail below in the General Inspection and Maintenance Procedure section (see the 5th and 6th paragraphs).
Inspection and General Maintenance Equipment
The following is a list of equipment recommended for inspection and general maintenance:
• Personal Protection Equipment - (pants, steel-toed shoes, safety glasses, gloves, safety vest, hard hat, etc.)
• Manhole Hook
• Traffic Cones and Signage
• Stadia Rod and Tape Measure
• Inspection Operation & Maintenance Log (provided in the O&M Manual) or other recording method
26
• Trash Removal “Net” Device
• Shovel, rake, broom, and trash receptacle
• Vactor Truck (if more extensive maintenance is required)
• Light Duty Construction Equipment (if media replacement is required) General Inspection and Maintenance Procedure
Routine inspection will ensure that the system is performing at optimal conditions and that the risk of flooding is low. EcoPure BioFilterTM inspection involves a visual inspection of the plant surface area, structure inlet, pretreatment cell, and clean-out ports. This can all be done at the surface and requires no confined-space entry into the EcoPure BioFilterTM cell. An Inspection O&M log should be used, and dates and weather conditions should be noted.
If the EcoPure BioFilterTM is located in a traffic area (i.e., roadway or automobile travel way), and inspection is not possible without entering the vehicular area, safety measures should be employed -- safety cones set up, etc. -- prior to performing the inspection and maintenance.
A visual inspection of the general appearance of the EcoPure BioFilterTM should be performed, and notes should be taken detailing the condition of the surface plant life, invasive species intrusion, erosion in the planting area and any signs of standing water or disturbed or “shifted” surface soil bed area. This general system condition should be noted in the inspection/maintenance log.
If the plant life and surface media show signs of distress, general landscaping O&M should be performed, i.e., raking, weeding (removal of invasive plants), and general planting replacement to maximize the cover area in the planting bed/media treatment cell. If signs of excessively high water levels (i.e., damp wet conditions still visible in the top planting area) are seen in the media treatment cell and the last rain event was greater than 24 hours prior, further inspection should be performed to ensure the effluent pipe is not blocked. All blocked pipes should be cleared and cleaned. Inspecting the bypass piping in the pretreatment cell is also advised to see if the system is going into bypass during recent storms (i.e., signs of debris in bypass piping). If the inspection results in the conclusion that the media is compromised or has reached its service life, total replacement of the media treatment cell is recommended. ADS should be contacted for material specifications and replacement parts. Media cell replacement will involve utilizing small construction excavation equipment.
For inspection of the pretreatment cell, the manhole cover should be safely removed (i.e., using a manhole hook). A visual inspection of the condition of the surface concrete and any inlet grates should be noted. If grates are missing or inlets are damaged, contact ADS for recommendation of repair. The suspended trash grate area should be relatively clear of debris. If excessive debris is observed, a trash capture net should be employed, and debris removed. Next, a stadia rod should be sent down to the bottom of the pretreatment cell and the level of debris should be recorded in the maintenance log. When the debris in the sump reaches 10 inches in average depth, a vactor truck should be used to remove the accumulated sump debris. Employing a vactor track for
27
cleaning the pretreatment cell follows the typical guidelines used for cleaning hydrodynamic stormwater devices.
For inspection and cleaning of the chamber section of the EcoPure BioFilterTM (open cavity under the media cell), it is generally recommended that if the 10-inch sediment mark has been reached in the pretreatment cell, the owner should backwash the chamber section of the media cell. With the pretreatment cell cleaned and dewatered, the cleanout risers should be exercised and low-pressure water (60-80 psi) should be introduced to force and move sediment within the chamber cavities into the pretreatment cell (the riser tees have a removable cap to facilitate a “bottom” exit at the floor of the first cell). See the O&M guide for details of backflushing this unit. Once it is deemed that most of the sump sediment from the media cell has been backflushed, clean water flow should cease. The pretreatment cell should be vacuumed dry (during this backflushing procedure), the trash rack reinstalled/repositioned, and the manhole cover replaced. The backflushing process may require confined-space entry, and all rules and precautions should be adhered to, based on OSHA requirements and the practices and procedures in place for the entity performing the work.
Disposal of material from the pretreatment cell, trash debris rack, and chamber cavity should be in accordance with the local municipality’s requirements. Typically, traditional municipal landfills can be used for disposal of solids and trash obtained from servicing the EcoPure BioFilterTM. The same disposal methods should be used if the media cell is replaced. Call ADS at 1-800-821-6710 for further information.
8. Statements
The attached pages include signed statements from the manufacturer (Advanced Drainage Systems, Inc.), the supervising third-party observer (Boggs Environmental Consultants, Inc.), and NJCAT. These statements are included as a requirement for the verification process.
28 March 18, 2020
Dr. Richard S. Magee, Sc.D., P.E., BCEE NJCAT
Center for Environmental Systems Stevens Institute of Technology Castle Point on Hudson
Hoboken, NJ 07030-0000
Advanced Drainage Systems is pleased to provide this letter as our statement certifying that the protocol, “New Jersey Department of Environmental Protection Laboratory Protocol to Assess Total Suspended Solids Removal by a Filtration Manufactured Treatment Device” (NJDEP Filter Protocol, January25, 2013),was strictly followed while testing our EcoPure BioFilterTM system. The testing was
performed at the BaySaver Laboratory, located in Mount Airy, MD. All data pertaining to the EcoPure BioFilterTM NJDEP Protocol test is included in the Verification Report.
Sincerely,
Daniel J Figola, PE
Director of Sustainability Development Advanced Drainage Systems, Inc.
31 Center for Environmental Systems
Stevens Institute of Technology One Castle Point
Hoboken, NJ 07030-0000
April1, 2020
Gabriel Mahon, Chief NJDEP
Bureau of Non-Point Pollution Control Bureau of Water Quality
401 E. State Street
Mail Code 401-02B, PO Box 420 Trenton, NJ 08625-0420
Dear Mr. Mahon,
Based on my review, evaluation and assessment of the testing conducted on the Advanced Drainage Systems EcoPure BioFilter™ (4’ x 8’ commercial system) at the BaySaver Laboratory (BaySaver Technologies, LLC is a subsidiary of Advanced Drainage Systems, Inc.), under the independent third-party oversight of Boggs Environmental Consultants (BEC), Inc., the test protocol requirements contained in the “New Jersey Department of Environmental Protection Laboratory Protocol to Assess Total Suspended Solids Removal by a Filtration Manufactured Treatment Device” (NJDEP Filter Protocol, January 2013) were met or exceeded. Specifically:
Test Sediment Feed
The test blend was custom-blended using various commercially available silica sands under the oversight of BEC. The particle size distribution was independently analyzed by Environmental Consulting Services (ECS), using the methodology of ASTM method D422-63.The blended silica met the specification within tolerance as described in Section 5B of the NJDEP filter protocol and was acceptable for use.
Removal Efficiency Testing
Twenty-six (26) removal efficiency testing runs were completed in accordance with the NJDEP filter protocol. Twenty-one (21) of the 26 test runs were conducted at the target flow rate of 60
32
gpm and an influent sediment concentration of 200 mg/L. Maximum driving head of 36” was reached at Test Run 21 and the flow rate was reduced to 90% of the MTFR (54 gpm) for Test Runs 22-26 per the filter protocol. The EcoPure BioFilter™ demonstrated an average sediment removal efficiency on a cumulative mass basis of 88.0% over the course of the 26 test runs.
Sediment Mass Loading Capacity
Mass loading capacity testing was conducted concurrently with removal efficiency testing. The 4’ x 8’ EcoPure BioFilter™ has a mass loading capture capacity of 194.5 lbs (3.24 lbs/ft2 of filtration area).
No maintenance was performed on the test system during the entire testing program.
Scour Testing
The 4’ x 8’EcoPure BioFilter™ at 100% mass loading/capture capacity demonstrated minimal scour (2.0 mg/L adjusted effluent sediment concentration) at 111.2 gpm (185% of MTFR) qualifying it for on-line installation up to this flow rate.
Sincerely,
33
VERIFICATION APPENDIX
34
Introduction
• Manufacturer – Advanced Drainage Systems, Inc, 4640 Trueman Blvd, Hilliard, OH 43026 Website: https://www.ads-pipe.com Phone: 800-229-7283.
• MTD - EcoPure BioFilter™ verified models are shown in Table A-1. In the bio-media bed
• TSS Removal Rate – 80%
• On-line installation up to 185% MTFR Detailed Specification
• NJDEP sizing tables and physical dimensions of EcoPure BioFilter™ verified models are attached (Table A-1). These sizing tables are valid for NJ following NJDEP Water Quality Design Storm Event of 1.25" in 2 hours (NJAC 7:8-5.5(a)).
• Maximum inflow drainage area
o The maximum inflow drainage area is governed by the maximum treatment flow rate of each model as presented in Table A-1.
• Driving head will vary for a given EcoPure BioFilter™ model based on the site-specific configuration. The maximum head available until bypass is 36”, but the minimum head varies depending on the flow rate through the unit and the cumulative mass captured in the biofiltration cell over time. Design support is given by BaySaver for each project, and site-specific drawings (cut sheets) will be provided that show pipe inverts, finish surface elevation, and peak treatment and maximum flow rates through the unit.
• The drawdown flow exits via an effluent pipe at the bottom of the filter bed. A clean filter draws down in approximately 20 minutes. The pretreatment cell of the EcoPure BioFilterTM remains full of water after drawdown.
• See Advanced Drainage Systems EcoPure BioFilter™ Design Manual I & M Section for inspection and maintenance procedures at https://baysaver.com/resources/.
35
Table A-1 EcoPure BioFilter
TMModel Sizes and New Jersey Treatment Capacities
Overall Unit (ft) Pre-treatment Cell (ft) Filter Bed (ft) Effective Filtration Treatment Area (EFTA) (ft2)1 Effective Sedimentation Treatment Area (ESTA) (ft2) ESTA/EFTA Wet Volume (WV) (ft3) WV/EFTA MTFR (cfs)2 Mass Capture Capacity (lbs) Drainage Area (acres)3 4 x 8 4 x 3 4 x 4.5 60 30 0.50 56 0.94 0.134 194.5 0.324 4 x 10 4 x 4 4 x 5.5 75 38 0.51 73 0.97 0.167 242.4 0.404 4 x 12 4 x 5 4 x 6.5 90 46 0.51 90 1.00 0.201 291.8 0.486 4 x 14 4 x 6 4 x 7.5 105 54 0.51 106 1.01 0.234 339.6 0.566 4 x 16 4 x 7 4 x 8.5 120 62 0.52 123 1.03 0.268 389.0 0.648 8 x 12 8 x 5 8 x 6.5 180 92 0.51 179 0.99 0.401 583.5 0.973 8 x 16 8 x 7 8 x 8.5 240 124 0.52 246 1.02 0.535 778.0 1.297 8 x 20 8 x 8.5 8 x 11 315 156 0.50 304 0.96 0.702 1021.1 1.702 8 x 24 8 x 10.5 8 x 13 375 188 0.50 371 0.99 0.836 1215.6 2.026
1. Effective Filtration Treatment Area (EFTA) is defined as the surface area of the ADS AdvanEDGE pipe that is available for flow from the bioretention filter media layer.
2. Based on 1 gpm/ft2 of effective filtration treatment area.
3. Drainage Area is based on Mass Capture Capacity (194.5/60 = 3.24 lbs/ft2 of filtration area) and the equation in the NJDEP Filter Protocol wherein