Iran J Public Health, Vol. 45, No.10, Oct 2016, pp.1332-1339
Original Article
Non-auditory Effect of Noise Pollution and Its Risk on Human
Brain Activity in Different Audio Frequency Using
Electroence-phalogram Complexity
Armin ALLAHVERDY
1, 2, *Amir Homayoun JAFARI
1, 21. Dept. of Medical Physics and Biomedical Engineering, Tehran University of Medical Sciences, Tehran, Iran 2. Research Center for Biomedical Technologies and Robotics (RCBTR), Tehran University of Medical Sciences, Tehran, Iran
*Corresponding Author: Email: [email protected]
(Received 25 Dec 2015; accepted 16 May 2016)
Introduction
Noise pollution is a universal feature of urban and industrial areas, which may cause auditory and non-auditory effects on human health (1). Sounds are one of the possible sources of danger for human health (2). Noise pollution is an un-wanted source of sounds, which may cause unde-sirable effects on human ability and may cause many types of psychopathies. If noise exposure oversteps a certain limit, negative outcomes may be seen. The first health effects of noise were seen in occupation settings that high levels of noise are produced, like weaving mills (3). The noise pollution may cause a wide range of non-auditory health effects like offense (4), sleep dis-orders (5), cardiovascular disease (6, 7) and
cogni-tion disorders in children (8). There are several researches about impact of noise pollution on human health. Most of them studied the effect of noise pollution on auditory system (9), but a few of them studied noise pollution effects on non-auditory systems, which may cause many disord-ers or diseases. One of non-auditory systems, which is affected by noise pollution, is the central nervous system and brain (10). Annoyance is the most common effect of auditory noises in urban and industrial population and may disturb the daily activities, feelings, thoughts, sleep and rest and it may cause anger, feebleness and other be-havioral disorders (11, 12). Besides, getting ex-posed to the auditory noises can stimulate the
Abstract
Background: Noise pollution is one of the most harmful ambiance disturbances. It may cause many deficits in ability and activity of persons in the urban and industrial areas. It also may cause many kinds of psychopathies. Therefore, it is very important to measure the risk of this pollution in different area.
Methods:This study was conducted in the Department of Medical Physics and Biomedical Engineering, Tehran Uni-versity of Medical Sciences from June to September of 2015, in which, different frequencies of noise pollution were played for volunteers. 16-channel EEG signal was recorded synchronously, then by using fractal dimension and rela-tive power of Beta sub-band of EEG, the complexity of EEG signals was measured.
Results:As the results, it is observed that the average complexity of brain activity is increased in the middle of audio frequency range and the complexity map of brain activity changes in different frequencies, which can show the effects of frequency changes on human brain activity.
Conclusion:The complexity of EEG is a good measure for ranking the annoyance and non-auditory risk of noise pollution on human brain activity.
autonomic nervous system and endocrine system (13). This type of noise may lead to cognitive disorders, like attention deficits, communication difficulties, learning defect and depression (3, 14). Electroencephalogram (EEG) describes brain activity and metabolism (15) that can provide in-formation about function of brain. There are so many works about applications of EEG for de-tecting abnormalities and disorders like diagnosis ADHD children (16), autistic children (17) and other psychopathies (18). In addition, EEG has a wide range of applications in bracomputer in-terface (19-21) and is a useful to predict seizures in epileptic patients (22). The complexity of EEG can illustrate the activity and inactivity of neurons of brain. In other words, the complexity of EEG can be an index of mental pressure. Fractal di-mensions can illustrate the complexity of a time series like EEG (23).
This study investigated the impact of different frequencies of noise pollution on brain activity by using Fractal dimension to determine complexity of EEG signals.
Materials and Methods
The complexity of EEG signal is investigated in different frequencies of noise pollution. First, we recorded 16-channel EEG synchronously, and then the complexity of the signals is measured. We used Katz and Sevcik fractal dimension as complexity index as well as the relative power of Beta sub-band of EEG to investigate high-frequency activation of the brain. This study was conducted in the Department of Medical Physics and Biomedical Engineering, Tehran University of Medical Sciences from June to September of 2015.
Data Acquisition
For EEG signals recording, g-tec’s USBamp (generation 3.0) has been used. Ten volunteers participated in the study. None of them had a history of auditory or neurological problems. Subjects gave written consent to participate in-tensively. The 16-channel EEG signals were rec-orded in a room without any ambient sounds by
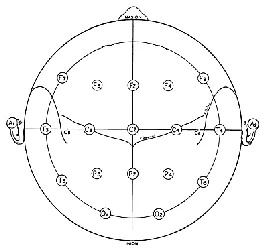
electrodes located on F3, F4, F7, F8, Fz, C3, C4, C5, C6, T5, T6, P3, P4, Pz, O1 and O2 and Cz as reference electrode (Fig. 1).
Fig. 1: The electrode location (24)
The EEG recording procedure contained 7 sec-tions that each section’s duration was 10 min. In the first section, the volunteers were asked to close their eyes and be relaxed and there was no ambient sound at EEG recording duration. In the other 6 sections, volunteers were asked to close their eyes to listen a pure tone sinusoidal sound respectivly with frequencies: 196, 392, 784, 1568, 3136 and 6272 Hz and 44100 Hz sampling frequency. The audio intensity of sounds for all frequencies was 80 dB and played as sound field. The EEG recording sample rate was 512 Hz. A high pass filter with 3dB frequency 0.5 Hz and a lowpass filter with 3dB frequency 50 Hz are ap-plied to EEG Signals. During EEG recording, volunteers were asked to score annoyance of each noise between 6 and 1 as 6 and 1 belong to the most and least annoying noise respectively.
Katz Fractal Dimension
Fractal dimension means, the non-integer dimen-sion of an object and is diversely used in biomed-ical signal processing, especially EEG signal (25). The fractal dimension may be used as interpreter of signal’s complexity (26), therefore, higher val-ue of fractal dimension shows higher complexity of EEG.
be-tween 1 and 1.5. This fractal dimension for straight lines will be 1 and for random signals will be 1.5. This fractal dimension is defined as:
𝐹𝐷𝐾= ln(𝑁 − 1)
ln(𝑁 − 1) + ln(𝑑𝐿)
Eq.1
where N is the number of data samples in EEG time series and L is the length oftime series and is defined as follow:
𝐿 = 𝑆 𝑖 − 1 − 𝑆(𝑖) 𝑁
Eq.2
where S(i) is the value of signal at i-th sample time, d is the diameter of time series, and is de-fined as difference of maximum and minimum values of EEG.
Sevcik Fractal Dimension
Sevcik fractal dimension is introduced in 2010 (28). In this approach, the fractal dimension is approximated from N values of sampled time series and use normalized time series as bellow:
𝑆 𝑖 = 𝑆 𝑖 − 𝑆𝑚𝑖𝑛
𝑆𝑚𝑎𝑥− 𝑆𝑚𝑖𝑛 𝑓𝑜𝑟 𝑖 = 1: 𝑁
Eq.3
where S is the original time series and 𝑆 is the normalized time series. Smax and Smin are maximum
and minimum values of time series, respectively and i is sample number. Finally, the Sevcik fractal dimension is defined as follow:
𝐹𝐷𝑆= 1 +
ln(𝐿)
ln(2 𝑁 − 1 ) Eq.4
where L is the total length of normalized time series as Eq 2.
Relative Power
For investigating the relative power of EEG sig-nals, the EEG signal is divided to four sub-bands containing delta (0 to 4 Hz), theta (4 to 8 Hz), alpha (8 to 12 Hz) and beta (12 to 30Hz). Then the absolute power of each sub-band is calculated and the relative power could be obtained by fol-lowing formula:
𝑅𝑃 𝑖 = 𝑃(𝑖)
𝑃(𝑗)𝐾
Eq.5
where RP(i) is the relative power of i-th sub-band, P(i) is the absolute power of i-th sub-band and K is the number of sub-bands. In these four sub-bands of EEG, beta sub-band shows the fastest changes of EEG and approximately may show the complexity of EEG (29). Therefore, in this study, the relative power of beta sub-band will be considered.
Results
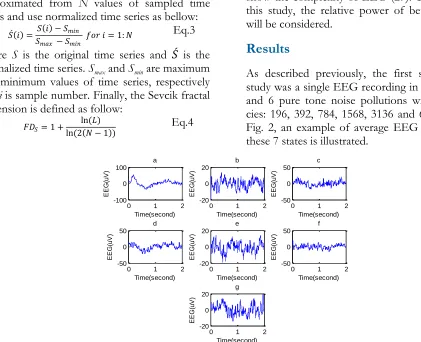
As described previously, the first step of this study was a single EEG recording in silence state and 6 pure tone noise pollutions with frequen-cies: 196, 392, 784, 1568, 3136 and 6272 Hz. In Fig. 2, an example of average EEG recorded in these 7 states is illustrated.
Fig. 2:An example of average recorded EEG in (a) silence mode, (b) 196 Hz, (c) 392 Hz, (d) 784 Hz, (e) 1568 Hz,
(f) 3136 Hz and (g) 6272 Hz noise pollution
0 1 2
-100 0 100 a Time(second) E E G (u V )
0 1 2
-20 0 20 b Time(second) E E G (u V )
0 1 2
-50 0 50 c Time(second) E E G (u V )
0 1 2
-50 0 50 d Time(second) E E G (u V )
0 1 2
-20 0 20 e Time(second) E E G (u V )
0 1 2
-50 0 50 f Time(second) E E G (u V )
0 1 2
According to volunteer scores to degree of noise annoyance, the most annoying noise frequency was 784 Hz and the other ranks respectively
be-longed to 392 Hz, 1568 Hz, 3136 Hz, 6272 Hz and 196 Hz. The average score of each noise is presented in Fig. 3.
Fig. 3:Average score of annoyance of each noise claimed by volunteers
In the second step, the Katz and Sevcik fractal dimensions and relative power of Beta sub-band of EEG signals were calculated for each elec-trode at each state. Finally, we averaged the frac-tal dimensions and relative powers of Beta
sub-band over electrodes for each person. In Fig. 4, the average of Katz fractal dimension, Sevcik fractal dimension and relative power of Beta sub-band over each state is illustrated.
Fig. 4:(a) Average Sevcik Fractal Dimension of EEG, (b) Average Katz Fractal Dimension of EEG, (c) Average
According to the ranks of annoyance which claimed by volunteers, Katz and Sevcik fractal dimensions and relative power of Beta sub-band can show this ranking. For statistical evaluation of the Sevcik and Katz fractal dimensions and relative power of Beta sub-band of EEG signals and the rank of annoyance claimed by the volun-teers, we calculated the correlation coefficients,
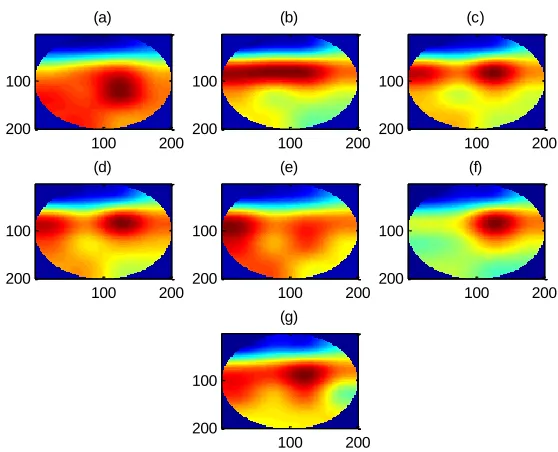
between each feature of EEG and annoyance rank, using this approach, the correlation of Sev-cik fractal dimension and annoyance rank was 0.9692, for Katz fractal dimension this value was 0.9656 and this value was 0.9613 for relative power of Beta sub-band. For visualizing the spa-tial variations of these features, the brain map of each feature is shown in Fig. 5 to 7.
Fig. 5:Brain map of Sevcik Fractal Dimension in 7 states: (a) Silence, (b) 196 Hz, (c) 392 Hz, (d) 784 Hz, (e) 1568
Hz, (f) 3136 Hz and (g) 6272 Hz
Fig. 6:Brain map of Katz Fractal Dimension in 7 states: (a) Silence, (b) 196 Hz, (c) 392 Hz, (d) 784 Hz, (e) 1568 Hz,
(f) 3136 Hz and (g) 6272 Hz (a)
100 200
100
200
(b)
100 200
100
200
(c)
100 200
100
200
(d)
100 200
100
200
(e)
100 200
100
200
(f)
100 200
100
200
(g)
100 200
100
200
(a)
100 200
100
200
(b)
100 200
100
200
(c)
100 200
100
200
(d)
100 200
100
200
(e)
100 200
100
200
(f)
100 200
100
200
(g)
100 200
100
Fig. 7:Brain map of Relative Power of Beta Sub-band in 7 states: (a) Silence, (b) 196 Hz, (c) 392 Hz, (d) 784 Hz, (e) 1568 Hz, (f) 3136 Hz and (g) 6272 Hz
As it is obvious from Fig. 5 and 6 that the brain map of fractal dimensions of EEG signals, which are recorded during noise with frequencies of 392 Hz, 784 Hz and 1568 Hz, are showing more differ-ence to sildiffer-ence mode than other EEG signals. This fact with a little tolerance can be seen in Fig. 6.
Discussion
In this study, we recorded 16 channels EEG in 7 states, including silence mode and 6 noise pollu-tion in monotones with frequencies 196, 392, 784, 1568, 3136, 6172 Hz from 10 volunteers and asked them to score the annoyance of these nois-es. Then the Katz and Sevcik fractal dimension and relative power of Beta sub-band extracted from these EEG signals. These features approx-imately showed the annoyance ranking of noise. As the results of these three features are similar, each of them can be suggested for ranking an-noyance of noise and measuring the variation of EEG complexity versus frequency of noise (16). However, power of Beta sub-band feature has more computational cost, since power of Beta sub-band computing needs to extract the Beta sub-band of EEG signals and then compute the
power spectrum density of this sub-band and the whole EEG. However, the Katz and Sevcik frac-tal dimensions use the time series of EEG signal directly and do not need to use extra computa-tions.
Analogous to most researches, we have shown that regardless of sound intensity, the frequency of noise has a major effect on its harm (30). This result is reasonably expressed by annoyance scores. In contrast to previous studies, which are just content to consider qualitative measures like performance and subjective reactions, this study has proven that there are more qualitative and accurate indexes that can be extracted from EEG which are independent of subject cooperation or declaration. In addition, we have used frequen-cies in auditory range rather than very low fre-quencies of noise, which are merely audible (30) to investigate the non-auditory effects of the noise. The results showed that the most harmful audio frequencies are in middle band of sounds and annoyance of sounds affects the complexity of brain activities and EEG signals which may cause psychological disorders like reduced atten-tion and also affect the funcatten-tion of individuals and their cardiovascular condition (8, 31).
(a)
100 200
100
200
(b)
100 200
100
200
(c)
100 200
100
200
(d)
100 200
100
200
(e)
100 200
100
200
(f)
100 200
100
200
(g)
100 200
100
According to these results, we can rank the an-noyance of noise pollution of industrial and ur-ban areas and compare them. Fractal dimensions are suitable features for measuring annoyance and effect of noise pollution on non-auditory sys-tems. In addition, the middle frequencies of noise pollution have more influence on complexity of EEG and annoyance of noise so can be more harmful for human health and can have more non-auditory effect on human. These frequencies may be produced in every area by different tools. Measuring these frequencies may help us to rank the annoyance and non-auditory impact of the noise on human brain activity to compare them concentrating on the occupational health aspects. A universal standard protocol may be designed for ambiance noise to decrease its impact on hu-man functions; for example, this standard proto-col can be applied in car design for decreasing the most annoying noise made by produced car and enforce the manufacturers to reject or modulate the most harmful frequencies. Another advantage of these results is monitoring the hearing protec-tion of the industrial centers to determine eligible persons and employees to work in these centers. In future work, more complex noises like noises with multiple frequencies can be played for sub-jects and the complexity of their EEG can be computed to analyze their brain activity in the presence of these noises.
Conclusion
The present study provides evidence for effect of noise pollution on brain activity in human and shows the effect of different frequencies of noise pollution on its annoyance. By using this evi-dence, the risk of noise pollution may be quanti-fied in every environment.
Ethical considerations
Ethical issues (Including plagiarism, informed consent, misconduct, data fabrication and/or fal-sification, double publication and/or submission,
redundancy, etc.) have been completely observed by the authors.
Acknowledgement
The authors declare that there is no conflict of interests.
References
1. Basner M, Babisch W, Davis A, Brink M, Clark C, Janssen S, Stansfeld S (2014). Auditory and non-auditory effects of noise on health. Lancet, 383:1325-1332.
2. Hughes RW, Jones DM (2003). Indispensable benefits and unavoidable costs of unattended sound for cognitive functioning. Noise Health, 6 (21):63-76.
3. Stansfeld S, Haines M, Brown B (2000). Noise and health in the urban environment. Rev Environ Health, 15:43-82.
4. Miedema H, Oudshoorn C (2001). Annoyance from transportation noise: relationships with exposure metrics DNL and DENL and their confidence intervals. Environ Health Perspect, 109 (4):409-16.
5. Muzet A (2007). Environmental noise, sleep and health. Sleep Medicine Reviews, 11(2):135-142. 6. Van Kempen E, Babisch W (2012). The
quantitative relationship between road traffic noise and hypertension: a meta-analysis. J Hypertens, 30 (6):1075-86.
7. Sørensen M, Andersen ZJ, Nordsborg RB, Jensen SS, Lillelund KG, Beelen R, Schmidt EB, Tjonneland A, Overvad K, Raaschou-Nielsen O (2012). Road traffic noise and incident myocardial infarction: a prospective cohort study. PLoS One, 7 (6):e39283.
8. Stansfeld SA, Matheson MP (2003). Noise pollution: non-auditory effects on health. Br Med Bull, 68:243-57.
9. Akan Z, Körpinar MA, Tulgar M (2011). Effects of noise pollution over the blood serum immunoglobulins and auditory system on the VFM airport workers, Van, Turkey. Environ Monit Assess 177 (1-4):537-43.
cognitive function in the elderly. Environ Res, 109 (8):1004-11.
11. Fritschi L, Brown L, Kim R, Schwela D, Kephalopolous S (2011). Burden of disease from environmental noise: Quantification of healthy years life lost in Europe, World Health Organisation, available from
www.who.int/quantifying_ehimpacts/publications /e94888/en/.
12. Öhrström E, Skånberg A, Svensson H, Gidlöf-Gunnarsson A (2006). Effects of road traffic noise and the benefit of access to quietness. J Sound Vib, 295 (1-2):40-59.
13. Lusk SL, Gillespie B, Hagerty BM, Ziemba RA (2004). Acute effects of noise on blood pressure and heart rate. Arch Environ Health, 59 (8):392-9.
14. Evans GW (2006). Child development and the physical environment. Annu Rev Psychol, 57:423-51.
15. Laufs H, Krakow K, Sterzer P, Eger E, Beyerle A, Salek-Haddadi A, Kleinschmidt A (2003). Electroencephalographic signatures of attentional and cognitive default modes in spontaneous brain activity fluctuations at rest. Proc Natl Acad Sci USA, 100 (19):11053-8. 16. Allahverdy A, Nasrabadi AM, Mohammadi MR
(2011). Detecting ADHD children using symbolic dynamic of nonlinear features of EEG. ICEE, pp. 1-4.
17. Coben R, Clarke AR, Hudspeth W, Barry RJ (2008). EEG power and coherence in autistic spectrum disorder. Clin Neurophysiol, 119 (5):1002-9.
18. Lee Y-J, Zhu Y-S, Xu Y-H, Shen M-F, Zhang H-X, Thakor N (2001). Detection of non-linearity in the EEG of schizophrenic patients. Clin Neurophysiol, 112 (7):1288-94. 19. Chambayil B, Singla R, Jha R (2010). Virtual
keyboard BCI using Eye blinks in EEG. WiMob, pp. 466-70.
20. Aguilar JM, Castillo J, Elias D (2015). EEG Signals Processing Based on Fractal Dimension Features and Classified by Neural Network and Support Vector Machine in Motor Imagery for a BCI. IFMBE Procedings, 49: 615-8.
21. Woo J-S, Muller K-R, Lee S-W (2015). Classifying directions in continuous arm movement from EEG signals. Brain-Computer Interface (BCI), 2015 3rd International Winter Conference on IEEE, pp. 1-2.
22. Sharif B, Jafari AH (2015). A new approach to automatically generate optimal Poincaré plane from discrete time series, Electrical and Computer Engineering (CCECE), 2015 IEEE 28th Canadian Conference on, IEEE, pp. 581-6. 23. Akar SA, Kara S, Latifoğlu F, Bilgiç V (2015).
Investigation of the noise effect on fractal dimension of EEG in schizophrenia patients using wavelet and SSA-based approaches. Biomed Signal Process Control, 18:42-8.
24. Klem GH, Lüders HO, Jasper H, Elger C (1999). The ten-twenty electrode system of the International Federation. Electroencephalogr Clin Neurophysiol Suppl, 52:3-6.
25. Esteller R, Vachtsevanos G, Echauz J, Litt B (2001). A comparison of waveform fractal dimension algorithms. IEEE Trans Circuits Syst I, 48 (2):177-83.
26. Sandau K, Kurz H (1997). Measuring fractal dimension and complexity—an alternative approach with an application. J Microsc, 186 (2):164-176.
27. Katz MJ (1988). Fractals and the analysis of waveforms. Comput Biol Med, 18 (3):145-56. 28. Sevcik C (2010). A procedure to estimate the
fractal dimension of waveforms. Chaos Soliton Fractals,1003.5266.
29. Adeli H, Ghosh-Dastidar S, Dadmehr N (2007). A wavelet-chaos methodology for analysis of EEGs and EEG subbands to detect seizure and epilepsy. IEEE Trans Biomed Eng, 54(2):205-11.
30. Persson Waye K, Bengtsson J, Kjellberg A, Benton S (2001) , Low frequency noise "pol-lution" interferes with performance.Noise
Health,4 (13): 33-49.
31. Regecová V, Kellerová E (1995). Effects of ur-ban noise pollution on blood pressure and heart rate in preschool children. J Hypertens,