OWA-FRPS: A Prototype Selection method
based on Ordered Weighted Average Fuzzy
Rough Set Theory
Nele Verbiest1, Chris Cornelis1,2, and Francisco Herrera2 1
Department of Applied Mathematics, Computer Science and Statistics, Ghent University, Krijgslaan 281 (S9), B-9000 Gent, Belgium
2 Department of Computer Science and Artificial Intelligence, University of Granada,
Calle del Periodista Daniel Saucedo Aranda s/n, 18071 Granada, Spain
[email protected] [email protected]
Abstract. The Nearest Neighbor (NN) algorithm is a well-known and effective classification algorithm. Prototype Selection (PS), which pro-vides NN with a good training set to pick its neighbors from, is an important topic as NN is highly susceptible to noisy data. Accurate state-of-the-art PS methods are generally slow, which motivates us to propose a new PS method, called OWA-FRPS. Based on the Ordered Weighted Average (OWA) fuzzy rough set model, we express the quality of instances, and use a wrapper approach to decide which instances to se-lect. An experimental evaluation shows that OWA-FRPS is significantly more accurate than state-of-the-art PS methods without requiring a high computational cost.
Keywords: Ordered Weighted Average, Fuzzy Rough Sets, Prototype Selection, KNN
1
Introduction
One of the most well-known and most widely used classification algorithms is Nearest Neighbors (NN,[1]). This method classifies a test instancetto the class of the nearest neighbor oft in the training set. Although NN has been proven to be very useful for many classification problems, it deals with some problems, among which its sensitivity to noise and its large storage requirements are the most important ones.
In this work we alleviate these problems by using Prototype Selection (PS,[2]). This technique removes redundant and/or noisy instances from the training set, such that the training set requires less storage and such that the NN algorithm is more accurate. PS techniques that mainly try to improve the classification accuracy are called edition methods, those that focus on reducing the required storage are condensation methods. Hybrid PS techniques try to tackle both prob-lems simultaneously. In this work we develop an editing method.
can be found in [2]. When the algorithm does not make use of a specific clas-sifier to classify the entire training set, the method is called a filter method. Condensation methods do use a specific classifier, the NN classifier in our case, to classify the entire training data to obtain a quality assessment of a certain prototype subset. Filter methods are generally faster and less accurate, while wrapper methods are slower and more accurate. Many wrapper PS algorithms are evolutionary based, like CHC [3], GGA [4, 5] or SSMA [6], while others use other search heuristics like RMHC [7] or RNG [8]. Most of the filter methods are based on the NN algorithm itself, like AllKNN [9] or MENN [10]. The method that we develop is a wrapper.
Although many researchers have focused on developing fuzzy rough feature se-lection [11] algorithms, there is not much literature on fuzzy rough PS yet. Nevertheless, fuzzy rough set theory [12] is a good tool to model noisy data. To the best of our knowledge, the only fuzzy rough based PS method is FRIS [13]. This method selects those instances that have a fuzzy positive region higher than a certain threshold. This method has some problems, the main one being that the method’s performance highly relies on a good threshold selection. In this work, we propose a new fuzzy rough based PS method that assesses the quality of instances using Ordered Weighted Average (OWA) fuzzy rough set theory [14], a more robust version of fuzzy rough set theory, and automatically selects an appropriate threshold.
The remainder of this work is structured as follows. In Section 2, we first discuss three OWA fuzzy rough quality measures that can be used to assess the quality of instances, and then show how these measures can be used to carry out PS. In Section 3, we evaluate our algorithm, called OWA Fuzzy Rough Prototype Selection (OWA-FRPS), and we conclude in Section 4.
2
Ordered Weighted Average based Fuzzy Rough
Prototype Selection
In this section we present our new PS method. In the first subsection we define three measures to assess the quality of instances, and in the second subsection we demonstrate how we can use these measures to carry out PS.
2.1 Assessing the quality of instances using OWA fuzzy rough sets
First we introduce some notations. We consider a decision system (X,A ∪ {d}), consisting ofn instancesX ={x1, . . . , xn},mattributesA={a1, . . . , am} and a decision attribute d /∈ A. We denote bya(x) the value of an instance x∈X for an attribute a ∈ A. We assume that each continuous attribute a ∈ A is normalized, that is, ∀x∈X :a(x)∈ [0,1]. The categorical attributes can take values in a finite set. The decision attribute d is categorical too and assigns a classd(x) to each instancex∈X.
We associate a fuzzy indiscernibility relationR:X×X→[0,1] with the decision system as follows. First, we calculate the fuzzy indiscernibilityRafor each feature
a∈ Aseparately. Whenais categorical,Ra(x, y) = 1 forx, y∈Xifa(x) =a(y) andRa(x, y) = 0 otherwise. Whenais continuous,Ra(x, y) = 1− |a(x)−a(y)| for allx, y∈X.
Next, we combine these separate fuzzy indiscernibility relations using a t-norm T (the Lukasiewicz t-norm3in this paper):
∀x, y∈X :R(x, y) =T(Ra(x, y))
| {z }
a∈A
(1)
This fuzzy indiscernibility relation is the keystone of fuzzy rough set theory. A fuzzy setS can be approximated by its fuzzy rough lower approximation
∀x∈X : (R↓S)(x) = min
y∈XI(R(x, y), S(y)) (2) withIthe Lukasiewicz implicator4in this paper, and by its upper approximation
∀x∈X: (R↑S)(x) = max
y∈XT(R(x, y), S(y)) (3) The fuzzy lower approximation expresses to what extent instances similar tox also belong toS , while the upper approximation expresses to what extent there exist instances that are similar toxand belong toS.
These concepts can be used to assess the quality of instances. First, note that we can consider the class [x]d of an instancex∈X as a fuzzy set inX:
∀y∈X: [x]d(y) =
1 if d(x) =d(y)
0 else (4)
which can be considered as the crisp set that contains all instances that have the same class asx.
If we want to assess the quality of an instancex, we can use the lower approxi-mation of [x]d :
(R↓[x]d)(x). (5)
This value expresses to what extent instances similar toxalso belong to the same class asx. Another option is to use the upper approximation of [x]d:
(R↑[x]d)(x) (6)
which expresses to what extent there exist instances that are similar to xand that belong to the same class asx.
Both measures are particularly meaningful in the context of NN classification, because they rate instances highly if they are surrounded by neighbors of the same class: the lower approximation measure is high forxif there are no instances
3
The Lukasiewicz t-norm is the mapping T : [0,1]2 → [0,1], such that ∀a, b ∈
[0,1],T(a, b) = max(0, a+b−1)
4
The Lukasiewicz implicator is the mapping I : [0,1]2 → [0,1], such that ∀a, b ∈
from a different class that are near (similar) tox, while the upper approximation measure is high if there exist neighbors from the same class.
In [14] it was noted that the traditional fuzzy rough approximations are highly susceptible to noise, as they use the crisp min and max operators, such that sin-gle instances can drastically influence the approximation values. A solution to this problem is to use OWA fuzzy rough sets [14], which replace these crisp operators by softer OWA operators [15]. Recall that, given a weight vector W =hw1, . . . , wnifor which
n P i=1
wi = 1 and∀i ∈1, . . . , n, wi ∈[0,1], the OWA aggregation ofnvaluess1, . . . , sn is given by:
OW AW(s1, . . . , sn) = n X
i=1
witi, (7)
whereti=sj ifsj is theith largest value ins1, . . . , sn.
Whenh0, . . . ,0,1iis used as weight vector, the minimum operator is retrieved, which is the operator that is used in the traditional fuzzy lower approximation. We replace this minimum by a less strict operator that still has the characteristics of a minimum operator, that is, we consider a weight vector with ascending weights, such that lower values get higher weights, and higher values get lower weights. In this work we use the weight vectorWmin=hw1, . . . , wniwhere
∀i∈1, . . . , n:wi= i
n(n+ 1)/2. (8) Completely analogously, we can define theOW AWmax operator that softens the maximum operator. Its weights Wmax =hw1, . . . , wni are defined as follows in this paper:
∀i∈1, . . . , n:wi= n−i+ 1
n(n+ 1)/2. (9) Replacing the strict minimum and maximum operators in the traditional defini-tions of fuzzy lower and upper approximation leads to the following more robust definitions of OWA fuzzy rough sets:
∀x∈X : (R↓OW AS)(x) =OW AW min y∈X I(R(x, y), S(y)) (10) ∀x∈X : (R↑OW AS)(x) =OW AW max y∈X T(R(x, y), S(y)) (11) We will use this OWA fuzzy rough set model, leading to the following three quality measures: ∀x∈X :γL(x) = (R↓OW A[x] d)(x), (12) ∀x∈X:γU(x) = (R↑OW A [x]d)(x), (13) and ∀x∈X :γLU(x) = (R↓OW A[x]d)(x) + (R↑OW A[x]d)(x) (14)
2.2 OWA-FRPS
Based on the quality measures γ defined in the previous subsection, we can formulate an algorithm to find a good subset of instances. We obviously want to select the instances with a highγvalue and remove those with a lowγvalue, but now the question raises what threshold to use.
The main idea of our approach is to use the γ values of all instances in X as threshold. We calculate the leave-one-out training accuracy of the corresponding reduced subsets of instances and select the threshold that corresponds to the highest accuracy. More specifically, we carry out the following steps:
1. Calculate the γ(x) values for all instancesx∈X.
2. Remove the duplicates among all these γ values, the final set of γ values, which will all be considered as thresholds, isG={τ1, . . . , τp}, p≤n. 3. For each of the thresholdsτ ∈G, consider the following subset:Sτ ={x∈
X|γ(x)≥τ}.
4. Calculate the training leave-one-out accuracy of each of these subsets using the LOO procedure in Algorithm 1.
5. Select the subsets Sτi1, . . . , Sτis with the highest leave-one-out accuracy.
Note that multiple subsets can correspond to the same leave-one-out ac-curacy.
6. Return the subsetSmedian(τi1,...,τis).
Algorithm 1LOO, procedure to measure the training accuracy of a subset of instances using a leave-one-out approach
Input: Reduced decision system (S,A ∪ {d}) (S⊆X).
acc←0
forx∈X do if x∈S then
Find the nearest neighbornnofxinS\ {x}
else
Find the nearest neighbornnofxinS end if if d(nn) =d(x)then acc→acc+ 1 end if end for Output:acc
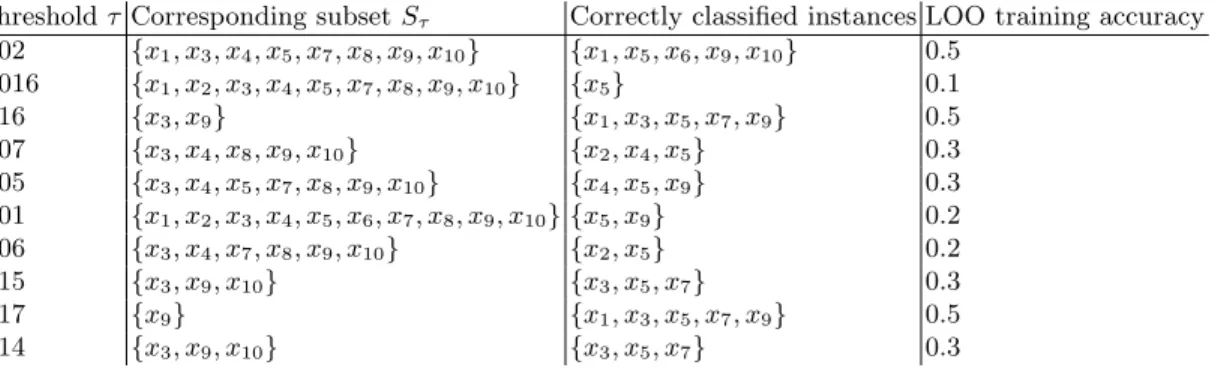
We illustrate the algorithm with an example. Consider the decision system in Table 1, with ten instances, two continuous features and one categorical feature. The values γLU are given in the last column for each instance. There are no duplicates, so the set of thresholds consists of the ten values in the last column of Table 1. In Table 2, we show the corresponding subsets. In order to calculate the training leave-one-out accuracy, we need the Euclidean distances between
the instances, which are given in Table 3. In the last two columns of Table 2, the instances that are correctly classified using the subsetSτ are given, together with the training accuracy. The subsets corresponding to the highest LOO training accuracy areSτ1, Sτ3 andSτ9, and subsetSτ3 ={x1, x3, x5, x9}will be returned by the OWA-FRPS algorithm.
Table 1.Decision system with 2 continuous features (a1 anda2) and one categorical
feature (a3). The class is given in columndand the value for theγLUmeasure is shown
in the last column.
a1 a2 a3d γLU x1 0.2 0.4 A 0 1.02 x2 0.3 0.3 A 1 1.016 x3 1 0 B 0 1.16 x4 0.7 0.9 B 1 1.07 x5 0.4 0.3 A 0 1.05 x6 0.3 0.6 A 1 1.01 x7 0.4 1 B 0 1.06 x8 0.3 0.2 B 1 1.15 x9 0.7 0.5 A 0 1.17 x100 0.1 A 1 1.14
Table 2. Thresholds τ considered in the OWA-FRPS algorithm and corresponding subsets of instancesSτ.
ThresholdτCorresponding subset Sτ Correctly classified instances LOO training accuracy
1.02 {x1, x3, x4, x5, x7, x8, x9, x10} {x1, x5, x6, x9, x10} 0.5 1.016 {x1, x2, x3, x4, x5, x7, x8, x9, x10} {x5} 0.1 1.16 {x3, x9} {x1, x3, x5, x7, x9} 0.5 1.07 {x3, x4, x8, x9, x10} {x2, x4, x5} 0.3 1.05 {x3, x4, x5, x7, x8, x9, x10} {x4, x5, x9} 0.3 1.01 {x1, x2, x3, x4, x5, x6, x7, x8, x9, x10} {x5, x9} 0.2 1.06 {x3, x4, x7, x8, x9, x10} {x2, x5} 0.2 1.15 {x3, x9, x10} {x3, x5, x7} 0.3 1.17 {x9} {x1, x3, x5, x7, x9} 0.5 1.14 {x3, x9, x10} {x3, x5, x7} 0.3
3
Experimental Evaluation
In this section we carry out an experimental evaluation to demonstrate the benefits of OWA-FRPS over other PS methods.
Table 3.Euclidean distance between the instances x1 x2 x3 x4 x5 x6 x7 x8 x9 x10 x1 0.000 0.082 0.775 0.707 0.129 0.129 0.683 0.592 0.294 0.208 x2 0.082 0.000 0.726 0.712 0.058 0.173 0.707 0.580 0.258 0.208 x3 0.775 0.726 0.000 0.548 0.695 0.785 0.673 0.420 0.668 0.819 x4 0.707 0.712 0.548 0.000 0.695 0.645 0.183 0.465 0.622 0.843 x5 0.129 0.058 0.695 0.695 0.000 0.183 0.705 0.583 0.208 0.258 x6 0.129 0.173 0.785 0.645 0.183 0.000 0.624 0.622 0.238 0.337 x7 0.683 0.707 0.673 0.183 0.705 0.624 0.000 0.465 0.668 0.810 x8 0.592 0.580 0.420 0.465 0.583 0.622 0.465 0.000 0.645 0.606 x9 0.294 0.258 0.668 0.622 0.208 0.238 0.668 0.645 0.000 0.465 x100.208 0.208 0.819 0.843 0.258 0.337 0.810 0.606 0.465 0.000 3.1 Experimental Set-up
We use 28 datasets from the KEEL dataset repository5. The characteristics of these datasets are listed in Table 4. As our main focus is to improve the accuracy of NN, we compare OWA-FRPS with 12 PS algorithms that are most accurate according to the study performed in [2]. Additionally, we also compare OWA-FRPS to FRIS [13] with parameter valueα= 10. In Table 5, we give an overview of the algorithms we consider with references to the literature. Note that we use three versions of the new OWA-FRPS algorithm, depending on which measure is used to rank the instances.
For each dataset and PS method, we carry out the following 10 fold cross vali-dation procedure. For each fold, we apply the PS method to the remaining folds (the train data) and then let NN find the nearest neighbors of the test instances in this reduced training set. We report the average classification accuracy, re-duction and running time over the 10 folds.
3.2 Results
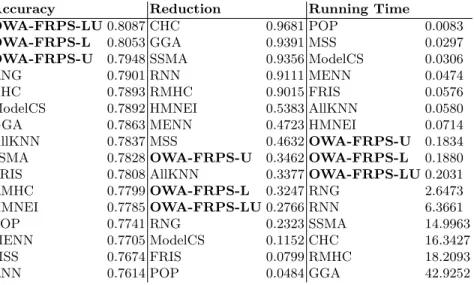
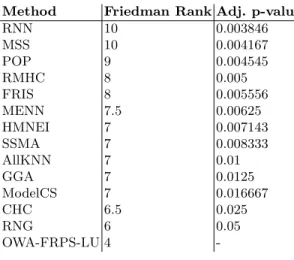
In Table 6, we show the average accuracy, reduction (the percentage of removed instances) and running time (in seconds) over all datasets. First, we note that on average, the OWA-FRPS-LU algorithm is more accurate than the other ver-sions, which shows that both the lower and upper approximation contribute to the quality assessment of the instances. All OWA-FRPS algorithms outperform the state-of-the-art PS algorithms. From now on, we continue the analysis with OWA-FRPS-LU, to which we simply refer to as OWA-FRPS. To test if the im-provement is significant, we carry out the statistical Friedman test and Holm post hoc procedure [21]. The Friedman ranks and the adjusted p-values of the Holm post hoc procedure are listed in Table 7. The OWA-FRPS algorithm has the best (i.e. lowest) rank. The low adjusted p-values confirm that OWA-FRPS is significantly more accurate than the state-of-the-art PS algorithms.
5
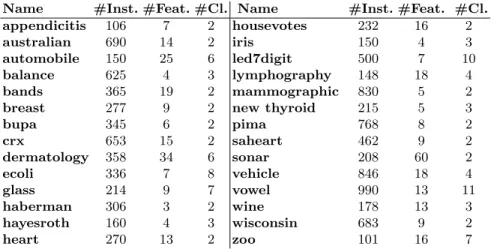
Table 4.Datasets used in the experimental evaluation with their number of instances (#Inst.), number of features (#Feat.) and number of classes (#Cl.).
Name #Inst. #Feat. #Cl. Name #Inst. #Feat. #Cl. appendicitis 106 7 2 housevotes 232 16 2
australian 690 14 2 iris 150 4 3
automobile 150 25 6 led7digit 500 7 10
balance 625 4 3 lymphography 148 18 4
bands 365 19 2 mammographic 830 5 2
breast 277 9 2 new thyroid 215 5 3
bupa 345 6 2 pima 768 8 2 crx 653 15 2 saheart 462 9 2 dermatology 358 34 6 sonar 208 60 2 ecoli 336 7 8 vehicle 846 18 4 glass 214 9 7 vowel 990 13 11 haberman 306 3 2 wine 178 13 3 hayesroth 160 4 3 wisconsin 683 9 2 heart 270 13 2 zoo 101 16 7
Table 5.Overview of the algorithms evaluated in the experimental study.
Name Description Reference
AllKNN NN based filter method [9] CHC Evolutionary based wrapper method [3] GGA Evolutionary based wrapper method [4, 5] HMNEI Hit and miss network based filter method [16] MENN NN based filter method [10] ModelCS Tree-based filter method [17] MSS Spatial-based filter method [18] POP Spatial-based filter method [19] RMHC Random mutation hill climbing wrapper method [7] RNG Graph based wrapper method [8] RNN NN based filter method [20] SSMA Evolutionary wrapper method [6] FRIS Fuzzy rough based filter method [13] OWA-FRPS-LU New OWA-FRPS method based on the quality
measure that takes into account both the lower and upper approximation
-OWA-FRPS-L New OWA-FRPS method based on the quality measure that takes into account the lower approx-imation
-OWA-FRPS-U New OWA-FRPS method based on the quality measure that takes into account the upper approx-imation
-The reduction rate of the OWA-FRPS algorithms is about 30 percent, which is not as high as some of the evolutionary PS methods, but as the focus of our method is to improve the accuracy rather than reducing the storage needs, this result is of less importance.
The running time is of more interest to us. OWA-FRPS is slower than 6 other methods, but these methods have considerably lower accuracy rates. The run-ning time of OWA-FRPS is shorter than the runrun-ning times of the most accurate PS methods, so although OWA-FRPS is a wrapper and obtains excellent accu-racy results, it does not come with the extra computational cost that wrapper PS methods typically have.
Table 6. Average results of the PS methods averaged over all datasets, ordered ac-cording to performance. Reduction is the ratio of removed instances, running time is given in seconds.
Accuracy Reduction Running Time
OWA-FRPS-LU0.8087 CHC 0.9681 POP 0.0083
OWA-FRPS-L 0.8053 GGA 0.9391 MSS 0.0297
OWA-FRPS-U 0.7948 SSMA 0.9356 ModelCS 0.0306 RNG 0.7901 RNN 0.9111 MENN 0.0474 CHC 0.7893 RMHC 0.9015 FRIS 0.0576 ModelCS 0.7892 HMNEI 0.5383 AllKNN 0.0580 GGA 0.7863 MENN 0.4723 HMNEI 0.0714 AllKNN 0.7837 MSS 0.4632OWA-FRPS-U 0.1834 SSMA 0.7828OWA-FRPS-U 0.3462OWA-FRPS-L 0.1880 FRIS 0.7808 AllKNN 0.3377OWA-FRPS-LU0.2031 RMHC 0.7799OWA-FRPS-L 0.3247 RNG 2.6473 HMNEI 0.7785OWA-FRPS-LU0.2766 RNN 6.3661 POP 0.7741 RNG 0.2323 SSMA 14.9963 MENN 0.7705 ModelCS 0.1152 CHC 16.3427 MSS 0.7674 FRIS 0.0799 RMHC 18.2093 RNN 0.7614 POP 0.0484 GGA 42.9252
4
Conclusion and Future Work
In this paper, we proposed a new PS method based on the OWA fuzzy rough set model, called OWA-FRPS. In order to select a subset of instances from the training set that improves the classification of the NN classifier, OWA-FRPS ranks the instances according to a OWA fuzzy rough measure, and then au-tomatically selects a suitable threshold to select the final subset of instances. An experimental evaluation on several datasets shows that our method achieves accuracy rates that are better than those of state-of-the-art PS methods, and moreover, OWA-FRPS is considerably faster.
Table 7. Values of the statistics of the Friedman test and Holm post hoc procedure that compares OWA-FRPS-LU to the state-of the-art algorithms. The second column shows the Friedman ranks, the third column the Holm adjusted p-values.
Method Friedman Rank Adj. p-value
RNN 10 0.003846 MSS 10 0.004167 POP 9 0.004545 RMHC 8 0.005 FRIS 8 0.005556 MENN 7.5 0.00625 HMNEI 7 0.007143 SSMA 7 0.008333 AllKNN 7 0.01 GGA 7 0.0125 ModelCS 7 0.016667 CHC 6.5 0.025 RNG 6 0.05 OWA-FRPS-LU 4
-classifiers like SVM and to improve OWA-FRPS for imbalanced datasets, that is, datasets for which one class is significantly more present than the other [22, 23].
Acknowledgment
This work was partially supported by the Spanish Ministry of Science and Tech-nology under Project TIN2011-28488.
References
1. Cover, T., Hart, P.: Nearest neighbor pattern classification. IEEE Transactions on Information Theory 13(1) (1967) 21–27
2. Garc´ıa, S., Derrac, J., Cano, F.: Prototype selection for nearest neighbor classi-fication: Taxonomy and empirical study. IEEE Transactions on Pattern Analysis and Machine Intelligence34(3) (2012) 414–435
3. Cano, J., Herrera, F., Lozano, M.: Using evolutionary algorithms as instance selection for data reduction in kdd: an experimental study. IEEE Transactions on Evolutionary Computation7(6) (2003) 561–575
4. Kuncheva, L., Jain, L.: Nearest neighbor classifier: Simultaneous editing and fea-ture selection. Pattern Recognition Letters20(1999) 1149–1156
5. Kuncheva, L.: Editing for the k-nearest neighbors rule by a genetic algorithm. Pattern Recognition Letters16(8) (1995) 809–814
6. Garc´ıa, S., Cano, J., Herrera, F.: A memetic algorithm for evolutionary prototype selection: A scaling up approach. Pattern Recognition41(2008) 2693–2709
7. Skalak, D.: Prototype and feature selection by sampling and random mutation hill climbing algorithms. Machine Learning: Proceedings of the Eleventh International Conference (1994) 293–301
8. Sanchez, J., Pla, F., Ferri, F.: Prototype selection for the nearest neighbour rule through proximity graphs. Pattern Recognition Letters18(1997) 507–513 9. Tomek, I.: An experiment with the edited nearest-neighbor rule. IEEE
Transac-tions on Systems, Man and Cybernetics6(6) (1976) 448–452
10. Hattori, K., Takahashi, M.: A new edited k-nearest neighbor rule in the pattern classification problem. Pattern Recognition32(2000) 521–528
11. Cornelis, C., Jensen, R., Hurtado, G., Slezak, G.: Attribute selection with fuzzy decision reducts. Information Sciences180(2) (2010) 209–224
12. Dubois, D., Prade, H.: Rough fuzzy sets and fuzzy rough sets. International Journal of General Systems17(1990) 191–209
13. Jensen, R., Cornelis, C.: Fuzzy-rough instance selection. Proceedings of the 19th International Conference on Fuzzy Systems (2010) 1776–1782
14. Cornelis, C., Verbiest, N., Jensen, R.: Ordered weighted average based fuzzy rough sets. Proceedings of the 5th international conference on Rough set and knowledge technology (2010) 78–85
15. Yager, R.: On ordered weighted averaging aggregation operators in multicriteria decisionmaking. IEEE Transactions on Systems, Man and Cybernetics18(1988) 183–190
16. Marchiori, E.: Hit miss networks with applications to instance selection. Journal of Machine Learning Research9(2008) 997–1017
17. Brodley, C.: Recursive automatic bias selection for classifier construction. Machine Learning20(1995) 63–94
18. Barandela, R., Ferri, F., Sanchez, J.: Decision boundary preserving prototype se-lection for nearest neighbor classification. International Journal of Pattern Recog-nition and Artificial Intellgence19(2005) 787–806
19. Riquelme, J., Aguilar-Ruiz, J., Aguilar-Ruiz, J., Toro, M.: Finding representative patterns with ordered projections. Pattern Recognition36(4) (2003) 1009–1018 20. Gates, G.: The reduced nearest neighbor rule. IEEE Transactions on Information
Theory 18(3) (1972) 431–433
21. Derrac, J., Garc´ıa, S., Molina, D., Herrera, F.: A practical tutorial on the use of nonparametric statistical tests as a methodology for comparing evolutionary and swarm intelligence algorithms. Swarm and Evolutionary Computation1(1) (2011) 3–18
22. Ramentol, E., Caballero, Y., Bello, R., Herrera, F.: Smote-rsb*: A hybrid prepro-cessing approach based on oversampling and undersampling for high imbalanced data-sets using smote and rough sets theory. Knowledge and Information Systems (2011) 1–21
23. Ramentol, E., Verbiest, N., Bello, R., Caballero, Y., Cornelis, C., Herrera, F.: Smote-frst: A new resampling method using fuzzy rough set theory. In proceedings of the 10th International FLINS Conference on Uncertainty Modeling in Knowledge Engineering and Decision Making (2012) 800–805