299
© Global Society of Scientific Research and Researchers http://asrjetsjournal.org/
Type 2 Diabetic Prediction Using Machine Learning
Algorithm
Sreeja Vishaly M
a*, Umamaheswari k
baCognizant Technology Solutions, Coimbatore, India
bDepartment of Information Technology,PSG College of Technology Coimbatore, India aEmail:[email protected]
b
Email: [email protected]
Abstract
Diabetes mellitus is one of the most important chronic disease and has become a major public health challenge in the recent world. Currently Machine Learning approaches have been used to analyze and predict the probability of people getting affected by diabetes. Diabetes can be effectively identified using the proposed Machine Learning technique. Many techniques and algorithms were used before for the prediction of type 2 diabetes prediction ,one such model was Multinomial Logistic Regression .Moving a step ahead to improve the diagnostic efficiency, this paper proposes the use of Weighted K –Nearest neighbor for detecting the type-2 Diabetes. This new approach proves higher effectiveness when compared to Multinomial Logistic Regression. Using Pima Indian Dataset the experiments were performed and it shows that efficiency is higher for weighted KNN when compared to Multinomial Logistic Regression.
Keywords: Machine Learning; Supervised Model; Weighted KNN; Type 2 Diabetes.
1.Introduction
Nowadays, Diabetes is often called a modern-society disease. It is categorized as one of the major global health problems according to many reports; for instance, more than 25.8 million people, or 8.3% of the U.S. population, have diabetes is what predicted. The total cost of health care for diabetes is expected to be $490 billion by 2030, accounting for 11.6% of the total health care expenditure in the world. Diabetes-Mellitus refers to the metabolic disorder that happens from malfunction in insulin secretion and action. It is characterized by hyperglycemia.
--- * Corresponding author.
300
The persistent hyperglycemia of diabetes leads to damage, malfunction and failure of different organs such as kidneys, eyes, nerves, blood vessels and heart.
The diagnosis of diabetes is very important; there are so many techniques in Machine Learning that can be effectively used for the prediction and diagnosis of diabetes disease. These algorithms in Machine Learning prove to be cost-effective and time saving for diabetic patients. In this paper, Prediction of Diabetes Mellitus using a new developed algorithm called Weighted K- Nearest Neighbor algorithm. It can be used as an effective Machine learning supervised Model technique compared to Normal KNN.
KNN algorithm is one of the best and the most popular classification algorithms which is used largely in different applications. K-Nearest Neighbor is an example of instance-based learning, in which the training dataset is stored, so that a classification for a new unclassified record may be found simply by comparing it to the most similar records in the training set . The distance function is used in this method to determine which member of the training set is closest to an unknown test instance. Also, because of its simplicity, KNN is easy to modify for more complicated classification problems. For instance, KNN is particularly well-suited for the object which has many class labels . In this paper, we used Weighted KNN. The proposed scheme improves the accuracy of KNN algorithm . The organization of this paper is formed as follows. Literature Survey is briefed in Section II . Proposed system is explained in Section III. Dataset and Attributes is explained in Section IV. Experimental Results and discussion is explained in Section V, followed by results and conclusion in Sections VI , respectively.
2.Literature Review
There is a variety of research work which has been carried out by many researchers based on the observed medical diabetes data. The author in [1] have presented the result which shows the classification using Multinomial Logistic Regression and produce normal evaluation value, with fulfilment rate of 78.9%, [2] shows experiments performed using Bayes network and the result was 72.3%. An analytical study of numerous algorithms is done in [3] which includes clustering, classification, vector machines and neural networks Machine Learning is the method of identifying, exploring and modelling huge amounts of data that discover unidentified Patterns or relationships that produce a correct result. Thus Machine Learning tools can be successfully applied in various fields in order to find patterns automatically with least amount of user input and efforts. Many Organizations now started using Machine Learning as a tool, to deal with the competitive environment for data analysis and evaluate various trends and pattern of market and to produce quick and effective market trend analysis . These methods use different algorithms and can be implemented with different data and types. More specifically, there are various data classification algorithms available in Machine Learning. Among these, K-Nearest Neighbour algorithm (KNN) used for this research is discussed hereafter.
An analytical result has been validated for the approaches such as clustering, neural network, vector machines and hybrid approaches. It is observed that the hybrid approaches are observed to produce significant results in terms of the classification accuracy, processing time as shown in [5]. Authors in [4] have applied adult population data from Ministry of National Guard Health Affairs (MNGHA), Saudi Arabia on three data mining
301
algorithms, namely Self-Organizing Map (SOM), C4.5 and Random Forest, to predict diabetic patients using 18 risk factors. Random Forest achieved the best performance compared to other data mining classifiers ,with the need for a simple and effective model have led to take up weighted KNN for effective performance of the diabetes.
3.Proposed System
3.1 Algorithm: K-Nearest Neighbour
1. Randomly selected K means of the quantity of nearest neighbours.
2. Compute the distance between the query instance and all the training samples.
3. Sort the distances for all the training samples and determine the nearest neighbour based on the K-th minimum distance.
4. Since this is supervised learning, get all the categories of your training data for the sorted value which fall under K.
5. Use the majority of nearest neighbours as the prediction value.
3.2 The K-Nearest Neighbor
Algorithm of K-Nearest Neighbor is defined as a supervised learning algorithm used for classifying objects based on closest training examples in the feature space. KNN is the most basic type of instance-based learning or lazy learning. It assumes all instances are points in n-dimensional space. A distance measure is needed to determine the “closeness” of instances . KNN algorithm is a simple technique that stores all available cases and classifies new cases based on a similarity measure. It is a type of lethargic knowledge where the function is only approximated nearby and the entire working out is deferred until classification. An entity is classified by the best part of its neighbors. K is always a positive integer. The correct classification is predicted because the neighbors are selected from a set of objects .
Some of the main advantages of KNN are: (i) it is simple to implement and easy to justify the outcome of KNN (ii) Robust to noisy training data (especially if we use Inverse Square of weighted distance as the “distance”), and (iii) Effective if the training data is large. Although KNN has those advantages, it has some disadvantages such as: (i) There is no thumb rule to determine value of parameter K, (ii) A high computation cost since it depends on computing the distance of each test instance to all training samples, and finally (iii) Low accuracy rate in multidimensional data sets with irrelevant features .
3.3 The Performance of Nearest Neighbor Classification
There are several key elements that may affect the performance of Nearest Neighbor classification:
302
One of the parameters to choose is the value of K. The value for K is pre-selected and the optimal value of K depends on the size and nature of the data . Because all K nearest neighbours are considered equally important with respect to the classification, the choice of K is crucial . Since using relatively large K may include too many points from other classes and on the other hand, using very small K may make the result sensitive to noise points. In both cases the classification accuracy will decrease. The data analyst needs to balance these considerations when choosing the value of K that minimizes the classification or estimation error and highest accuracy .
3.3.2 Choice of Distance Metric
A distance metric measures the dissimilarity between two data points in terms of some numerical value. It also measures similarity; we can say that more distance is the less similar the data points, and less distance is the more similar the data points.
The choice of the distance measure is another important consideration. Commonly, Euclidean or Manhattan distance measures are used. For two points x and y, with n attributes, these distances are given by the following formulas:
d(x, y) = Sqrt ( ∑(XK -YK)^2) --- Euclidean distance (1) where sigma value ranges from n to K=1
d(x, y) = Sqrt ( ∑⎸XK -YK⎸ ) --- Manhattan distance (2) where sigma value ranges from n to K=1
Where Xk and Yk are the kth attributes (components) of x and y, respectively. Although there are other possible choices, most instance-based learner’s special k nearest neighbours (KNN) classification use Euclidean distance function.
3.3.3 Weighted Voting
The problem, when using the Euclidean distance between two points in KNN algorithm is the weighting of the contributions of the different attributes , where the KNN algorithm uses all the record attributes equally however; all attributes might not have the same role in the classification process. Perhaps, some of these attributes are irrelevant to the classification, these irrelevant attributes can lead to distinguish two near records so far from each other and so the classification cannot be done correctly. Idiomatically, this problem is called as a curse of dimensionality . Generally, there are two types of combination functions: un weighted voting and weighted voting. In the unweighted voting combination function, the class label which has the majority between neighbours of new record is selected as the class label of the new record without considering the preference of each neighbour. But, in the weighted voting more weight is given to some neighbours that are so close to the new record. In other words, the ones which are more similar to the new record , where each objects weights vote by its distance and the influence of a particular record is inversely proportional to the distance of the record from the new record to be classified; but when the distance is zero, the inverse would be undefined. In this case the algorithm should choose the majority classification of all records whose distance is zero from the new record. The weight factor is often taken to be the reciprocal of the squared distance :
303
PWi = 1/(d(x1, x2)) ^2
Where x1, x2 denotes the two records
3.3.4 Performance Measures
For the calculation of the predicted positive cases the below mentioned formulas are used :
• True positive (TP) : Those Sick people who are correctly diagnosed as sick . • False positive (FP) : The Healthy people who are incorrectly identified as sick . • True negative (TN) : The Healthy people who are correctly identified as healthy . • False negative (FN) : The Sick people who are incorrectly identified as healthy .
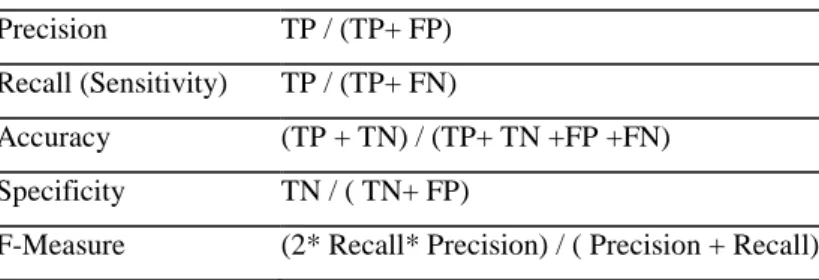
Various performance measures like sensitivity, specificity, accuracy and F-Measure are calculated using this matrix as depicted in Table 1:
Table 1: The Performance Measure Formulas
Performance MeasureFormulas
Precision TP / (TP+ FP)
Recall (Sensitivity) TP / (TP+ FN)
Accuracy (TP + TN) / (TP+ TN +FP +FN) Specificity TN / ( TN+ FP)
F-Measure (2* Recall* Precision) / ( Precision + Recall)
4. Data Set and Attributes
The original source of the data is taken from PIMA Indian diabetes dataset .
This dataset is publicly available at UC Irvine Machine Learning Lab and widely used as a standard for testing the accuracy of diabetes status using Machine Learning algorithms .
The Indian Diabetes dataset, the dataset consists of 8 attributes plus class . The dataset was collected from 768 females.
The diagnosis can be carried out depending on personal data (age, number of times pregnant) and results of medical examination (blood pressure, body mass index, result of glucose tolerance test, triceps skin fold thickness, serum insulin, pedigree function).
304
nearest neighbour technique for classification dataset, we used Min–Max Normalization to prevent attributes with initially large ranges from outweighing attributes with initially smaller ranges, and filling the missing value.
This algorithm performs better because it increases the plausibility and accuracy of the forecasts.
Table 2: The Characteristics Used For Diabetes Type II Diagnose
Attribute No. Attribute Description Type
Atr_1 PREG Numbers of time pregnant Numeric
Atr_2 PGGT Plasma glucose concentration in an oral glucose tolerance test Numeric
Atr_3 BP Diastolic blood pressure(mmHg) Numeric
Atr_4 SKIN Triceps skin fold thickness (mm) Numeric
Atr_5 INS Serum insulin (μU/ml) Numeric
Atr_6 MASS (BMI) Body Mass Index (kg/m) Numeric
Atr_7 PEDI Diabetes pedigree function Numeric
Atr_8 AGE Age of patient (years) Numeric
Y DIABETES Diabetes diagnose results ("tested_positive", ―‖tested_negative") Nominal
4.1 Data Normalization
Normalization is the scaling of data transformation of instances. In a dataset, the instance may have different values ranging from minimum to maximum values. This normalizes all the numerical values present in the dataset. The result values occupy the range between 0 and 1.
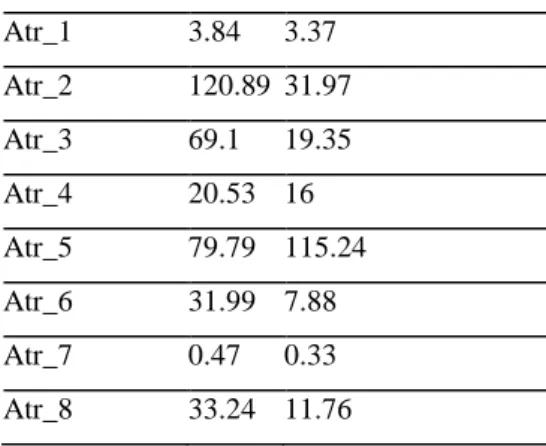
By using translation and scale parameters the range can be changed. Mean and standard deviation of the PIMA dataset before normalization are given in Table 3.
Table 3: Mean and Standard deviation before Normalization.
Attribute No. Mean Standard Deviation Atr_1 3.84 3.37 Atr_2 120.89 31.97 Atr_3 69.1 19.35 Atr_4 20.53 16 Atr_5 79.79 115.24 Atr_6 31.99 7.88 Atr_7 0.47 0.33 Atr_8 33.24 11.76
305
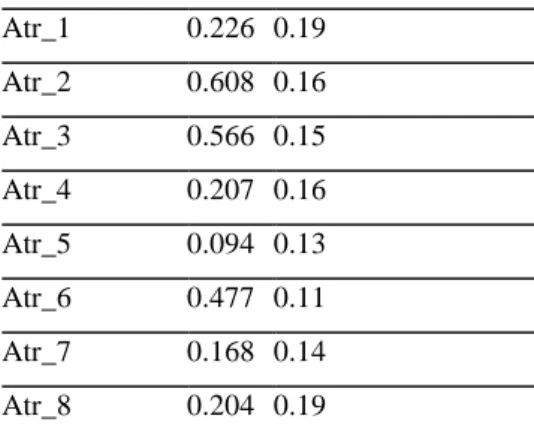
Table 4: Mean and Standard deviation after Normalization
Attribute No. Mean Standard Deviation Atr_1 0.226 0.19 Atr_2 0.608 0.16 Atr_3 0.566 0.15 Atr_4 0.207 0.16 Atr_5 0.094 0.13 Atr_6 0.477 0.11 Atr_7 0.168 0.14 Atr_8 0.204 0.19
After the normalization process the mean and standard deviation values are normalized to be in the range -1 to +1 and the difference between each attribute is less.
4.2 Performance Measures for weighted KNN
To remove the drawbacks and to make the KNN a faster algorithm Weighted KNN is proposed here. In our paper, we used to weighted KNN algorithm. The advantage of this method is figuring out of the distance, not only, the quantity of attributes that is considered but also, the quality of attributes that is emphasized, so it increases the classification accuracy. It's obvious that how accurate weights may be the classification accuracy increase but, if the weights are not selected accurately, the classification accuracy even decreases than before.
4.3 Algorithm to Proposed system Execution
1. Input: The Diabetes Dataset
2. For each attribute A: For each value V of that attribute:
• Count how often each class appears. • Find the most frequent class(C), c. • Make a rule "if A=V then C=c".
Calculate the succeed rate of this rule. Calculate the succeed rate of this attribute.
3.Weighted Voting of attribute (wi) is equal the succeed rate of this attribute.
4. Determine the parameter K number of nearest neighbours.
306
Euclidean distance with weighted voting (w). d(x1,x2) = n , where n denotes the number of attributes.
6. Sort the distances for all the training samples and determine the nearest neighbour based on the Kth minimum distance.
7. Since this is supervised learning, get all the categories of your training data for the sorted value which fall under K.
8. Use the higher weight among weights of nearest neighbours as the prediction value. Where, the weight of neighbour (pwi) , but if the distances for all the samples are equal zero then use the majority of nearest neighbours as the prediction value.
5. Experimental Results and Discussion
We experimentally tested Weighted accuracy using the Indian Diabetes dataset. It was divided into 70% of training dataset and 30% of testing dataset. In this paper, Thus to reduce the execution time in R programming, we test values of K (3, 5, 7 and 10) on training datasets to estimate the error rate . Table shows the chosen values of K for K-nearest neighbour method .
For example, in the below table we chose K=5 because it achieves the best accuracy. It is evident from the below table that the performance results with weighted voting are much better than those without weighted voting in k-nearest neighbour methods.
For example, the accuracy of dataset without missing achieves (73.88%) in case of KNN method without weight; meanwhile the accuracy of this method achieves (80.12 %) when we use weight.
Table 5: The Performance Comparison Between Proposed k-NN Methods with Different K Values
KNN Method
Accuracy %
K=3 K=5 K=7 K=10 K-Nearest Neighbor without weight 69.40% 73.88% 70.89% 67.16% Proposed K-Nearest Neighbor with weight 74.18% 80.12% 75.00% 73.25%
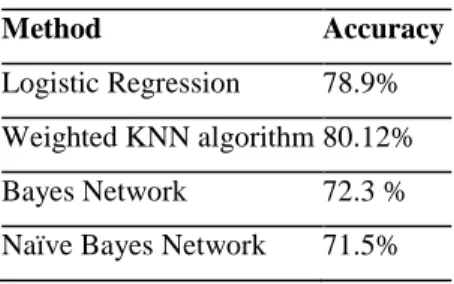
Table 6: Performance analysis
Method Accuracy
Logistic Regression 78.9% Weighted KNN algorithm 80.12% Bayes Network 72.3 % Naïve Bayes Network 71.5%
307
Finally when we used weighted KNN with k=5 we achieved a better accuracy of 80.12%.
6. Conclusion
Disease diagnosis is one of the successful aspects of Machine Learning. Diabetes is most commonly found in adults because of improper diet. Detection of this crucial disease at an early stage and proper medication leads to decrease the diabetician’s rate. In this paper, we have proposed Weighted KNN technique for the prediction of type2 diabetes and the results were compared with the existing algorithms. This can also be used to detect various diseases such as cancer and heart diseases. Although disease diagnosis is done with the help of Machine Learning tools, less research has been done to predict the treatment of diseases.
References
[1] Janani Priya R, Umamaheswari K, Type 2 Diabetes Prediction Using Multinomial Logistic Regression. Aust. J. Basic & Appl. Sci., 8(10): 31-37, 2014
[2] Yang Guo , Guohua Bai , Yan Hu, “Using Bayes Network for Prediction of Type-2 Diabetes”
IEEE Explore Vol. 8, No. 2, July 2012.
[3] S. Peter, An Analytical Study on Early Diagnosis and Classification of Diabetes Mellitus
Bonfring International Journal of Data Mining, Vol. 4, No. 2, June 2014
[4] Tahani Daghistani,Riyad Alshammari, Diagnosis of Diabetes by Applying Data Mining Classification Techniques, (IJACSA) International Journal of Advanced Computer Science and Applications, Vol. 7, No. 7, 2016
[5] Huy Nguyen Anh Pham, Evangelos Triantaphyllou, 2008. Prediction of Diabetes by Employing a New Data Mining Approach Which Balances Fitting and Generalization. Computer and Information Science Studies in Computational Intelligence, 131: 11-26.
[6] Mark Hall EibeFrank, Geoffrey Holmes, Bernhard Pfahringer Peter Reutemann, H. Ian Witten, 2009. The WEKA Data Mining Software: An Update. SIGKDD Explorations, 11(1).Shouman, M., T. Urne, R. Stocker, 2012.
[7] G. Karegowda, M.A. Jayaram and A.S. Manjunath,“Cascading K-means Clustering and KNearestNeighbor Classifier for Categorization of Diabetic Patients,” International Journal of Engineering and Advanced Technology (IJEAT), vol.1, no.3, pp. 147-151, 2012.