Predictions based on Twitter -
A Critical View on the Research Process
Lisa Madlberger
Information & Software Engineering Group Vienna University of Technology
Vienna, Austria [email protected]
Amal Almansour
Dept. of Computer ScienceKings College London London, United Kingdom [email protected]
Abstract—Twitter data is increasingly used to make predictions about real-world events. However recently, several studies directly or indirectly questioned proposed Twitter prediction procedures. In this paper, we conduct a literature review to investigate the research processes adopted by previous Twitter prediction studies in detail. We first identify the actors involved, and then we study how they influence the different phases of the research process. We found that in Twitter prediction research up to four actors perform several sampling, filtering, classification and assessment decisions throughout the development of prediction models. If these decisions and the reasons behind them are not sufficiently documented, the developed prediction methods cannot be reproduced in future research and consequently their validity and reliability are hard to assess.
Keywords—twitter; prediction; microblog; reliability; validity I. INTRODUCTION
Every day, people around the world publish 500 million tweets [1] to inform the outside world about what they do, what is happening, or to share news with their followers. In recent years, both the academic and the business world realized the potential of these messages, as a source of real-time information, which allows to detect trends and to even make predictions about the future. Most studies that have used Twitter data to predict elections [2], diseases [3] or stock market developments [4] provided promising results, suggesting that Twitter data could reveal great predictive power. However, the new information source Twitter comes with a risk: As in other “Big data” domains, the amount of data a researcher has at hand is huge and noisy, which might accommodate enough data to support any kind of hypothesis, if just enough specially tailored sampling and filtering techniques are applied. “It is quite possible that the most interesting patterns we discover during a data mining exercise will have resulted from measurement inaccuracies, distorted samples or some other unsuspected difference between the reality of the data and our perception of it” [5]. In fact,
recently, several studies directly or indirectly question the practices applied in previous Twitter prediction studies [6], [7]. Experiments used to evaluate the quality of the proposed methods are hard to reproduce, because access to historic Twitter data is expensive. Additionally, researchers require knowledge of a multitude of different parameters in order to repeat presented experiments, but existing studies often lack a precise description of these.
The goal of this paper is to explore which actors are involved in Twitter prediction research processes, and which decisions are taken that might influence the prediction result. For this purpose, we analyze 24 studies from different domains which aimed to perform predictions based on Twitter data. We show that Twitter-based predictions involve a number of sampling, filtering and classification steps which are performed by up to four different actors. Each of these actors might bring in their own reality and thereby influence the objectivity of the study. This paper can be seen as a first exploratory step on the way to more reliable and valid Twitter-based predictions research. This paper is organized as follows: first, we introduce related work, the sample of studies we selected for our survey and the method. Next, we elaborate on the actors involved in the Twitter research process and their role in the reviewed studies. We critically discuss how these roles affect validity and reliability, and conclude with a short summary and limitations.
II. RELATED WORK
There is a variety of literature-based approaches examining prediction models using social media data, starting with the extensive work done by Kalampokis et al. [8], who depicted the state-of-the-art in predictive applications based on social media and developed a general social media prediction framework. They found that most prediction studies which claimed to evidence Twitter’s predictive power did not employ any predictive analytics in their studies. Metaxas et al. [7] and Gayo-Avello [9] review existing studies and question both the predictive power of Twitter as well as applied prediction
methods, particularly in the political domain. Both agreed that prediction through Twitter is exaggerated and is only slightly better than chance, raising issues related to the lack of consideration of users’ demographics and biased data samples. They pointed out that these issues did not receive much attention by the reviewed studies and call for improved documentation of data sampling parameters and in-depth investigation of applied sentiment analysis methods. Other studies focused especially on the data sampling applied in Twitter research and questioned the quality of the data retrieved from Twitter [10], [11]. Following these critics, in this paper, we investigate the Twitter prediction research process in more detail and shed light on the involved actors and decisions.
III. DATA &METHOD
Sampling papers for this study is, like sampling data from Twitter, not a trivial task which will be inevitably biased by our personal decisions. We decided to include all papers listed in the extensive literature review on social media prediction carried out by Kalampokis et al. [8] in 2013. We applied the same search terms and search methodology and complemented this set of papers with more recent studies from 2013 and 2014. After obtaining a list of papers, we selected the 5 most recent (publication year) and influential studies (based on google citations) for each domain. Table I shows the papers included into this study per domain. We subsequently analyzed and extracted 25 attributes from these papers concerning the research process and the involved actors. In the next section, we will provide more insight into the collected data.
TABLE I. THE SELECTED STUDIES FOR EACH DOMAIN
Domain Studies
Movie Asur & Huberman 2010 [12], Rui &
Whinston 2012[13], and Du et al. 2014[14].
Health Culotta 2010 [15], Paul & Dredze 2011
[16], Signorini et al. 2011 [17], Achrekar et al. 2011 [18], Lampos & Cristianini 2012 [19], and Brennan et al. 2013[3].
Politics Metaxas et al. 2011 [7], O’Connor et al.
2010 [20], Tumasjan et al. 2010 [2], Conover et al. 2011 [21], Gayo-Avello 2011[9], Sang and Bos 2012 [22], and Franch 2012 [23].
Natural Disasters & Crime Sakaki et al. 2010 [24], Earle et al. 2012
[25], and Gerber 2014 [26].
Finance Oh and Sheng 2011 [27], Bollen et al.
2011 [28], Smailović et al. 2013 [29], and Rao & Srivastava 2014 [4].
IV. ACTORS IN THE TWITTER PREDICTION RESEARCH
While reviewing the literature, we identified essentially four different actors: the users, Twitter, the researchers; and the assessors. In the following sections we will elaborate on their role and how they affect the research process.
A. User
The decision of a user to publish his or her personal experience in a tweet influences whether this information can be used for subsequent predictions. However, not all people are equally likely to share information on Twitter. Therefore any research based on tweets has to take the demographic bias into consideration. Twitter users have different characteristics, they live in different geographic places, publish tweets in various languages and dialects, belong to different age groups, some are followed by a larger number of people and their messages spread widely, while others’ are not. Only 6 out of the 24 reviewed studies consider users features in their sampling and prediction processes as listed in Table II. Although determining traits such as the age and gender of Twitter users could be effective for prediction in domains such as politics where there is an age boundary for voting eligibility. In addition, only two studies [24], [25] include more than one language. Including all languages spoken by people related to an event might be important to not systematically exclude any group (e.g. in case of the prediction of US election outcomes, groups tweeting in Spanish but are eligible to vote are excluded [7], [9], [21]). In addition, users’ locations are important for domains such as politics and disasters. If the locations of users are not considered, a mismatch between the demographics and the real world problem might result (e.g. the locations of Twitter users are probably quite different from the location of the voters).
TABLE II. CONSIDERED USERS INFORMATION
Used by Domain Users’ Information Considered
Brennan, et al. 2013[3] Health Location Du et al. 2014[14] Movie Influence Sakaki et al. 2010[24] Disaster Different Language Earle et al. 2012[25] Disaster Different Language Metaxas et al. 2011 [7] Politics Location Gayo-Avello 2011[9] Politics Location, Age
B. Twitter
Twitter as a medium and a platform can be seen as an actor as well, since the provided the user interface and API features influence the information generation and data collection process.
1) Information Generation
Twitter and its features cannot be assumed to be a static constant over time. Although the general idea of providing a platform for open information exchange still persists, Twitter keeps developing the features it provides to its users which might change the way users interact with the platform. For example, in 2009, Twitter changed its byline from “What are you doing?” to “What is happening?”, broadening the focus from personal subjects to happenings in general. In July 2009, they introduced automatic linking of hashtags, which allows users the possibility to tag and browse tweets relating to a specific topic.
2) Information dissemination
Not all tweets posted by users will be published on the Twitter API. First of all, tweets are only disseminated, if they are public. Furthermore, illegal or spam tweets are removed [30]. Although Twitter is generally an open platform and strives to not filter tweets based on content, tweets might have to be withheld in a certain country, based on governmental request. Twitter publishes a transparency report listing all requests for removal, from January till June 2014, overall, 25 accounts and 251 tweets were withheld in various countries around the world [31]. The number of tweets withheld is just a minor fraction given the total volume of tweets sent per day, which would have to be considered in case researchers particularly focus on critical content, e.g. discriminatory issues. Twitter data can be retrieved through different channels:
Twitter Search API: provides tweets matching certain
keywords posted in the previous seven days relative to the retrieval time. Only a specific number of tweets can be retrieved per call and the number of requests is limited in a specific time window.
Twitter Streaming API: provides up to 1% of all tweets in
real-time. Either a random sample or a filtered sample (matching keywords or geographical areas) can be retrieved.
External providers can provide a better coverage
e.g. Decahose Twitterstream (10%), or the Firehose Twitter Stream (100%). Furthermore domain-specific and historic tweets can be acquired commercially.
Using the same selection criteria but with different methods of data collection influences the scope of the data sample. In fact, also using the same criteria and the same data source at different points in time might reveal different coverage, since the maximum amount of data retrieved is proportional to the total number of tweets sent globally. The total tweet volume has been increasing in the past years and is also impacted by global events like a soccer world cup. Furthermore, we do not have any control over future changes of the coverage level and the Twitter API features. Therefore, the sampling performed on the side of the Twitter API cannot be assumed to be a static factor over time. As depicted in Table III, only 4 of 24 reviewed studies stated the coverage of their data sample. However, it is challenging to obtain qualified information about Twitters’ sampling techniques used in past versions of the API. Therefore the results of previous studies, are hard to interpret, especially when sufficient descriptions of the sampling techniques are not provided.
TABLE III. USED API AND COVERAGE
API / Coverage Not Stated 1% 10% 100%
Third Party 2
Streaming API 3 1 3
REST API 8
No info 7 1
C. Researcher
As in any research process, a central role in the Twitter prediction research process is attributed to the researchers. The researchers decide (1) how the data sample is collected and the scope, (2) how irrelevant tweets are removed from the sample, (3) the prediction model and the dependent and predicted variables, and eventually (4) about the method of evaluation. In this study we focus on the first two steps which are specific to Twitter used as a data source.
1) Sampling
As of today, August 2014, about 500 million Twitter messages are sent daily. Typically just a tiny fraction of these data is related to the researchers’ topic of study. In order to reduce the data amount and to increase the ratio of relevant data in the sample, researchers apply different strategies in essentially two subsequent steps. First, when data is requested from the Twitter API, researchers can either retrieve a 1% random sample or they specify selection criteria. The reviewed studies used mainly keywords or geographic bounding boxes for sampling. Second, after the data has been retrieved, researchers might apply additional filtering techniques, e.g. in some cases only tweets with geotags were included in other cases tweets including URLs were excluded, or retweets were removed. Note that according to the current twitter API documentation, twitter stream filtering, returns only Tweets matching the specified keywords or bounding boxes, and returns up to 1% of the global tweet volume. Local filtering performed after retrieval, will result in a more focused subsample but cannot increase the coverage.
In our review, we found that 17 of 24 studies (See Table IV) used keywords as sampling criteria, two studies used geographic boundaries, and one study used a random sample. Four studies did not state clearly how data was collected, however two of them used a data sample collected by a third party.
TABLE IV. APPLIED SAMPLING METHODS
Sampling Method No.
Third Party Data Set 2
Keywords Topic Specific 13
Keywords not Topic Specific 4
Geographic 2
Random 1
Not Stated 2
Since the majority of the studies used keywords as sampling technique, in what follows, we elaborate on the keywords used and how those keywords were chosen.
Interestingly, in 12 out of 17 cases, keywords were chosen by the researchers without documenting how they have been selected. Three studies applied a dynamic keyword-selection approach which involves the researcher less or not at all. Two studies used neutral keywords, e.g. “I”, “am”, “feel” to only retrieve tweets that relate to personal statements, while others used topic specific keyword e.g. “flu”, “H1N1”. The keyword selection phase seems to be a critical phase, as the quality of
the sample depends on the researchers’ capacity to define the right keywords. In studies using geographic bounding boxes as selection criteria, the researcher has to define the number of places to be observed. In the studies reviewed, one study selected only tweets around English cities, whereas another one retrieved tweets within 3km distance of airports. This approach is less reliant on the researchers’ capabilities to correctly guess keywords, but introduces another sort of bias, since it will limit the sample to geotagged tweets. Less than 1.5% of all tweets are geotagged and Twitter users have to actively choose for the option to geotag tweets, which means this sample cannot be considered to be random.
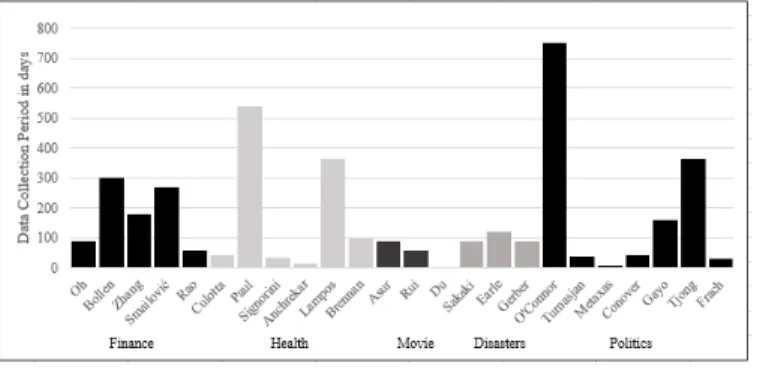
Another challenge for the researcher is to select a period the period of data collection. We observed very different periods of time ranging from a week to more than 2 years. Even in studies with a similar prediction objective, collection times vary substantially (See Fig 1). Although previous studies showed that the time period chosen can significantly influence the result [6], [7], reviewed studies mostly do not state why a particular time period has been chosen.
After the data has been collected, additional filtering methods are applied, e.g. limiting the sample to Tweets in a specific language, only users with specific home location or the exclusion of retweets or tweets including links.
Figure 1. Period of Data Collection.
2) Classification
Apart from the filtering applied during or after retrieval, some studies additionally apply supervised machine learning classifiers to exclude non-relevant tweets more effectively. In this case, a classifier is trained based on manually tagged relevant and non-relevant examples of tweets and used to assign future tweets to one of this classes. While this approach is less influenced by the researchers, it introduces a new actor in the Twitter research process.
D. Assessor
Supervised classification assessing the relevance or sentiment polarity of Tweets typically involves human judgments. In contrast to the other approaches, in this case, a human referred to as “assessor” reviews the content of a tweet and assigns it to a certain class. A big advantage of this approach is that also keywords and rules can be found, which exist in the data, however would not have been a priori in the mind of the researcher. It is well known that a high quality set
of training data is a necessary condition for the construction of an effective prediction model. Therefore the assessor can be seen as an additional actor affecting the prediction model. 11 of the 24 surveyed papers involve human assessors for the creation of training data sets for sentiment or relevance classification (See Table V). Whether a tweet is considered to be relevant or not, positively or negatively formulated, is subjective to the assessors’ view. The way how we make classifications in daily life is dependent on our cultural background and personal experiences. Therefore, assessors might disagree about the class assigned to a tweet. For instance, in 2012 Sang & Bos [22] tried to label tweets according to political directions, i.e. whether a tweet is negative or positive with regard to a specific party and reported on average 20% disagreement between assessors. Some studies discarded messages for which annotators assigned different labels [12], [22], others reported that it is sometimes even for humans difficult to judge whether a tweet is reporting an actual earthquake or not, for example a user might write ”Is this an earthquake or a truck passing?”[24]. Depending on the extent of disagreement, this practice could again systematically exclude some tweets from the training data and might thereby introduce an additional type of selection bias in future classifications. It should be noted that some studies applied techniques to help attaining training data not only from human assessors but also using other sources, like Social Graph Analysis [21], emoticons [29] or a sentiment lexica [7]. These methods are less time consuming and limit the personal influence of assessors.
In most of the studies, researchers or volunteers took over the role of the assessors. One study employed Amazon Mechanical Turk (AMT) workers for manual labelling. This practice involves additional human classification systems as AMT workers live in various countries and have different cultural backgrounds. For example, a tweet relating to “coughing” might be seen as a sign for flu in one country or considered irrelevant by a person from another for whom this is “normal”. Most studies did not disclose any information related to the assessors, their backgrounds or demographics. It remains unclear whether assessors were representative of the Twitter users observed so they could understand their perspectives and assign accurate labels.
E. Other Actors
Although not stated in the surveyed studies, there might be further actors potentially influencing prediction results. For example, in March 2014, the access to Twitter was banned in Turkey after users posted messages accusing the governmental party of being corrupt [32]. A study monitoring the flu world-wide would most certainly have been affected by this event and consequently also the prediction result.
V. RELIABILITY AND VALIDITY OF TWITTER PREDICTIONS
Two important requirements any scientifically developed method has to meet are reliability and validity. Based on the insights gained, in this section we will examine the reliability and validity of Twitter-based predictions.
TABLE V. STUDIES INVOLVING ASSESSORS Used by Oh & Sheng 2011 [27] Smailović et al. 2013 [29] Culotta 2010 [15] Paul & Dredze 2011 [16] Asur & Huberman 2010 [12] Rui & Whinston 2012[13] Du et al. 2014[14] Sakaki et al. 2010 [24] Sang & Bos 2012 [22] Conover et al. 2011 [21] Metaxas et al. 2011 [7]
Domain Finance Finance Health Health Movie Movie Movie Disaster Politics Politics Politics
Assessors: Researchers/ Crowdsourced users / Others R O R O C R - - - - R No. of Assessor 3 - - 2 3 2 - - 2 - - Application: Sentiment/ Relevance S S R R S S S R S S S Agreements Percentage - - - 75% - 85% - - - - 79.5% - - A. Reliability
“Reliability concerns the extent to which an experiment, test or any measuring procedure yields the same result on repeated trials.“ [33].
Since Twitter prediction methods are automated, two prediction experiments using the exact same dataset, will yield the same prediction results. However in practice, repeating experiments is hard, since access to historic Twitter data is expensive. As illustrated in previous sections, researchers have to take multiple decisions during the data collection process. Existing studies often lack a precise description of these decisions, which makes it difficult to repeat the same experiment. If an experiment was repeated in two different time periods, the number of people using Twitter, the way how they use it, the way in which Twitter provides data in its API, or the degree of access to Twitter could have changed, which might affect the result. While the researcher can control the method, several other actors which influence the prediction result, like the users, Twitter or governments cannot be controlled by the researcher and cannot be assumed to be static over time. As long as prediction models do not integrate these factors, they can hardly be reliable over time.
B. Validity
“An indicator of some abstract concept is valid to the extent that it measures what it purports to measure. Validity concerns the crucial relationship between concept and indicator.“ [33]. Typically the Twitter studies aim to provide an alternative way to measure existing indicators; for example, Achrekar et al. [18], try to predict a statistic from the national health organization, reporting the number of people who visited a doctor with influenza like symptoms. Therefore the study did not actually aim to predict the number of sick people, rather the number of people who visited a doctor as reported by the statistic. The validity can be evaluated by repeatedly comparing the result of the predicted value with the
result of the official statistics. However, this poses a challenge in domains where official data is not frequently available, e.g. for election outcomes. If we were interested into the actual number of sick people, rather than the number of people visiting a doctor, the Twitter prediction might theoretically reflect the number of sick people better than the official statistics. But how could we ever move beyond official statistics, if any divergence is interpreted as prediction error? Furthermore, it is hard to judge about the validity of a method when it is not completely clear what a method intends to measure. Should a Twitter prediction method tested on flu in the US, also work in other geographical regions? Could it also predict the spread of other diseases? Most of the studies reviewed developed and tested their models exclusively on English tweets and one specific use case. In many methods a list of manually selected keywords is a prerequisite which is both specific to a language as well as to the use case. The validity of the prediction result might therefore depend very heavily on the ability of a researcher to develop an exhaustive list of relevant keywords for the other language or use case and therefore restrict general applicability. In other cases, assessors are involved to provide their individual judgments to be integrated into algorithmic classifiers. Again, when transferring the method to another language or use case, a new classifier would have to be trained, potentially involving other assessors. If the accuracy of the prediction changed, how could we determine if the method is not valid for the other language or the ability of the assessors to provide accurate judgment is different for another language or domain. If the scope or the application area are not clearly defined, it is hard to objectively assess the validity of given methods.
VI. CONCLUSION &LIMITATIONS
In this study, we reviewed 24 Twitter prediction studies to identify the actors who are involved into Twitter prediction research process as well as their tasks and influences. We found that from the point of creation of tweets by Twitter
users, to the point where they are used within prediction models, several sampling, filtering and classification decisions are taken by researchers, Twitter and human assessors. If the decisions and reasons behind the decisions are not sufficiently documented the validity and reliability of current Twitter prediction research is hard to assess and therefor remains questionable. Given the exploratory nature of this study, further research is necessary to evaluate our findings empirically. In addition, the focus in this study was on Twitter-specific phases of the research process, future work could also study the steps of model-building and evaluation in more detail.
ACKNOWLEDGMENT
The first author of this paper is financially supported by the Vienna PhD School of informatics (http://www.informatik.tuwien.ac.at/teaching/phdschool).
REFERENCES
[1] Twitter “New Tweets per Second Record, and How!“, Twitter Blogs. [Online]. Available: https://blog.twitter.com/2013/new-tweets-per-second-record-and-how. [Oct. 6, 2014].
[2] A. Tumasjan, T. O. Sprenger, P. G. Sandner, und I. M. Welpe, “Predicting Elections with Twitter: What 140 Characters Reveal about Political Sentiment“, ICWSM, vol. 10, pp. 178–185, 2010.
[3] S. Brennan, A. Sadilek, und H. Kautz, “Towards Understanding Global Spread of Disease from Everyday Interpersonal Interactions“, in Proceedings of the Twenty-Third international joint conference on Artificial Intelligence, 2013, pp. 2783–2789.
[4] T. Rao und S. Srivastava, “Twitter Sentiment Analysis: How to Hedge Your Bets in the Stock Markets“, in State of the Art Applications of Social Network Analysis, Springer, 2014, pp. 227–247.
[5] D. J. Hand, H. Mannila, und P. Smyth, Principles of Data Mining. MIT press, Cambridge, 2001.
[6] A. Jungherr, P. Jürgens, und H. Schoen, “Why the Pirate Party Won the German Election of 2009 or the Trouble with Predictions: A Response to Tumasjan, A., Sprenger, Sander, PG, & Welpe, in “Predicting Elections with Twitter: What 140 Characters Reveal about Political Sentiment”“, Social Science Computer Review, vol. 30, no. 2, pp. 229–234, 2012.
[7] P. T. Metaxas, E. Mustafaraj, und D. Gayo-Avello, “How (not) to Predict Elections“, in Privacy, security, risk and trust (PASSAT), 2011 IEEE third international conference on and 2011 IEEE third international conference on social computing (SocialCom), 2011, pp. 165–171.
[8] E. Kalampokis, E. Tambouris, und K. Tarabanis, “Understanding the Predictive Power of Social Media“, Internet Research, vol. 23, no. 5, pp. 544–559, 2013.
[9] D. Gayo-Avello, “Don’t Turn Social Media into Another Literary Digest Poll“, Commun. ACM, vol. 54, no. 10, pp. 121–128, 2011. [10] K. Joseph, P. M. Landwehr, und K. M. Carley, “Two 1% s don’t make
a Whole: Comparing Simultaneous Samples from Twitter’s Streaming API“, in Social Computing, Behavioral-Cultural Modeling and Prediction, Springer, 2014, pp. 75–83.
[11] F. Morstatter, J. Pfeffer, H. Liu, und K. M. Carley, “Is the Sample Good Enough? Comparing Data from Twitter’s Streaming API with Twitter’s Firehose.“, in ICWSM, 2013.
[12] S. Asur und B. A. Huberman, “Predicting the Future with Social Media“, in IEEE/WIC/ACM International Conference on Web
Intelligence and Intelligent Agent Technology (WI-IAT), 2010, 2010, vol. 1, pp. 492–499.
[13] H. Rui und A. Whinston, “Designing a Social-broadcasting-based Business Intelligence System“, ACM Trans Management Information Systems, vol. 2, no. 4, pp. 22:1–22:19, Jan. 2012.
[14] J. Du, H. Xu, und X. Huang, “Box Office Prediction Based on Microblog“, Expert Syst. Appl., vol. 41, no. 4, Part 2, pp. 1680–1689, March 2014.
[15] A. Culotta, “Towards Detecting Influenza Epidemics by Analyzing Twitter Messages“, in Proceedings of the first workshop on social media analytics, 2010, pp. 115–122.
[16] M. J. Paul und M. Dredze, “You are What you Tweet: Analyzing Twitter for Public Health.“, in ICWSM, 2011, pp. 265–272.
[17] A. Signorini, A. M. Segre, und P. M. Polgreen, “The Use of Twitter to Track Levels of Disease Activity and Public Concern in the US During the Influenza A H1N1 Pandemic“, PloS One, vol. 6, no. 5, pp. e19467, 2011.
[18] H. Achrekar, A. Gandhe, R. Lazarus, S.-H. Yu, und B. Liu, “Predicting Flu Trends Using Twitter Data“, in IEEE Conference on Computer Communications Workshops (INFOCOM WKSHPS), 2011, pp. 702–707.
[19] V. Lampos und N. Cristianini, “Nowcasting Events from the Social Web with Statistical Learning“, ACM Trans. Intell. Syst. Technol. TIST, vol. 3, no. 4, pp. 72, 2012.
[20] B. O’Connor, R. Balasubramanyan, B. R. Routledge, und N. A. Smith, “From Tweets to Polls: Linking Text Sentiment to Public Opinion Time Series.“, ICWSM, Bd. 11, pp. 122–129, 2010.
[21] M. D. Conover, B. Goncalves, J. Ratkiewicz, A. Flammini, und F. Menczer, “Predicting the Political Alignment of Twitter Users“, in
2011 IEEE Third International Conference on Privacy, Security, Risk and Trust (PASSAT) and 2011 IEEE Third International Conference on Social Computing (SocialCom), 2011, pp. 192–199.
[22] E. T. K. Sang und J. Bos, “Predicting the 2011 Dutch Senate Election Results with Twitter“, in Proceedings of the Workshop on Semantic Analysis in Social Media, Stroudsburg, PA, USA, 2012, pp. 53–60. [23] F. Franch, “(Wisdom of the Crowds)2: 2010 UK Election Prediction
with Social Media“, Journal of Information Technology Politics, vol. 10, no. 1, pp. 57–71, June 2012.
[24] T. Sakaki, M. Okazaki, und Y. Matsuo, “Earthquake Shakes Twitter Users: Real-time Event Detection by Social Sensors“, in Proceedings of the 19th international conference on World wide web, 2010, pp. 851–860.
[25] P. S. Earle, D. C. Bowden, und M. Guy, “Twitter Earthquake Detection: Earthquake Monitoring in a Social World“, Ann. Geophys., vol. 54, no. 6, 2012.
[26] M. S. Gerber, “Predicting Crime using Twitter and Kernel Density Estimation“, Decis. Support Syst., Bd. 61, pp. 115–125, 2014. [27] C. Oh und O. Sheng, “Investigating Predictive Power of Stock Micro
Blog Sentiment in Forecasting Future Stock Price Directional Movement“, ICIS 2011 Proc., Dec. 2011.
[28] J. Bollen, H. Mao, und X. Zeng, “Twitter Mood Predicts the Stock Market“, J. Comput. Sci., Bd. 2, Nr. 1, pp. 1–8, 2011.
[29] J. Smailović, M. Grčar, N. Lavrač, und M. Žnidaršič, “Predictive Sentiment Analysis of Tweets: A Stock Market Application“, in
Human-Computer Interaction and Knowledge Discovery in Complex, Unstructured, Big Data, Bd. 7947, A. Holzinger und G. Pasi, Hrsg. Berlin, Heidelberg: Springer Berlin Heidelberg, 2013, pp. 77–88. [30] “Tweets still must flow“, Twitter Blogs. [Online]. Available:
https://blog.twitter.com/2012/tweets-still-must-flow. [Oct. 6, 2014]. [31] “Removal requests | Transparency Report“, Twitter Transparency
Report. [Online]. Available: https://transparency.twitter.com/removal-requests/2014/jan-jun. [Oct 6, 2014].
[32] K. Rawlinson, “Turkey blocks use of Twitter after prime minister attacks social media site“, The Guardian, 21-March-2014.
[33] E. G. Carmines und R. A. Zeller, Reliability and Validity Assessment, vol. 17. Sage, 1979.
![TABLE V. S TUDIES INVOLVING A SSESSORS Used by Oh & Sheng 2011 [27] Smailović et al](https://thumb-us.123doks.com/thumbv2/123dok_us/678896.2582561/5.918.69.852.118.339/table-tudies-involving-ssessors-used-oh-sheng-smailović.webp)
