Tampereen teknillinen yliopisto. Julkaisu 1255
Tampere University of Technology. Publication 1255
Pavlo Molchanov
Radar Target Classification by Micro-Doppler
Contributions
Thesis for the degree of Doctor of Science in Technology to be presented with due permission for public examination and criticism in Sӓhkӧtalo Building, Auditorium S3, at Tampere University of Technology, on the 20th of October 2014, at 12 noon.
Tampereen teknillinen yliopisto - Tampere University of Technology
Tampere 2014
ISBN 978-952-15-3390-7 (printed)
ISBN 978-952-15-3398-3 (PDF)
ISSN 1459-2045
Abstract
T
hisin silicon-germanium and monolithic microwave integrated circuit technologies allows to buildthesis studies non-cooperative automatic radar target classification. Recent developments cheap and powerful continuous wave radars. Availability of radars opens new applications in different areas. One of these applications is security. Radars could be used for surveillance of huge areas and detect unwanted moving objects. Determination of the type of the target is essential for such systems. Microwave radars use high frequencies that reflect from objects of millimetre size. The micro-Doppler signature of a target is a time-varying frequency modulated contribution that arose in radar backscattering and caused by the relative movement of separate parts of the target. The micro-Doppler phenomenon allows to classify non-rigid moving objects by analysing their signatures. This thesis is focused on designing of automatic target classification systems based on analysis of micro-Doppler signatures.Analysis of micro-Doppler radar signatures is usually performed by second-order statistics, i.e. common energy-based power spectra and spectrogram. However, the information about phase coupling content in backscattering is totally lost in these energy-based statistics. This useful phase coupling content can be extracted by higher-order spectral techniques. We show that this content is useful for radar target classification in terms of improved robustness to various corruption factors.
A problem of unmanned aerial vehicle (UAV) classification using continuous wave radar is covered in the thesis. All steps of processing required to make a decision out of the raw radar data are considered. A novel feature extraction method is introduced. It is based on eigenpairs extracted from the correlation matrix of the signature. Different classes of UAVs are successfully separated in feature space by support vector machine. Within experiments or real radar data, achieved high classification accuracy proves the efficiency of the proposed solutions.
Thesis also covers several applications of the automotive radar due to very high growth in technologies for intelligent vehicle radar systems. Such radars are already build-in in the vehicle and ready for new applications. We consider two novel applications. First application is a multi-sensor fusion of video camera and radar for more efficient vehicle-to-vehicle video transmission. Second application is a frequency band invariant pedestrian classification by an automotive radar. This system allows us to use the same signal processing hardware/software for different countries where regulations vary and radars with different operating frequency are required.
We consider different radar applications: ground moving target classification, aerial target classification, unmanned aerial vehicles classification, pedestrian classification. The highest pri-ority is given to verification of proposed methods on real radar data collected with frequencies equal to 9.5, 10, 16.8, 24 and 33 GHz.
Preface
T
hisTampere University of Technology, Finland.work has been carried out during 2010-2014 at the Department of Signal Processing,I wish to express my gratitude to Prof. Karen Egiazarian for making it possible for me to start working on interesting topic of the dissertation, for his help, support and advice during the working process.
I am grateful to Prof. Jaakko Astola for providing a constant feedback and advice during my work. I wish to express my gratitude to Prof. Alexander Totsky, National Aerospace University, Ukraine, for introducing me to the world of radars, and providing a constant support during my studies.
I wish to thank pre-examiners of the thesis, Prof. Alexander Yarovoy, Delft University of Technology, the Netherlands, and Prof. Aleksandra Pizurica, Ghent University, Belgium, for careful evaluation and constructive comments that helped to improve the dissertation.
I would like to thank all members of Department of Signal Processing for sharing ideas and demonstrating high research level. Especially, I wish to thank Prof. Alessandro Foi, Prof. Vladimir Katkovnik, Prof. Atanas Gotchev, Dr. Aram Danielyan, Dr. Robert Bregovi´c for sharing experience and making work-enjoyable environment. Thanks to Suren, Mikhail, Olli and Tatiana for cheering me up during long winter time.
Special thanks go to Ronny Harmanny, Thales, the Netherlands, and Dr. Jacco de Wit, TNO, the Netherlands, for exciting work on UAVs classification by radar systems. This collaboration have contributed to a number of papers and presented in the thesis as a Chapter 7. The work on automotive radar (Chapter 6) would not be possible without Prof. Alexey Vinel, Halmstad University, Sweden, Dr. Evgeny Belyaev, Tampere University of Technology, Finland and Svante
Bj¨orklund, Swedish Defence Research Agency, Sweden. I am grateful to Prof. Ioan Tabus for
collaboration on inventing novel feature selection algorithm presented in the Chapter 4.
I wish to thank administrative staff at Tampere University of Technology and especially Sil-taloppi Ulla, Ruotsalainen Pirkko, Larmila Virve, Rotola-Pukkila Noora, Anttila Susanna, Pernu Johanna, Juha Peltonen, Elina Orava for helping me dealing with daily routines.
The financial support of the Graduate School in Electronics, Telecommunications and
Au-tomation (GETA), the Nokia Foundation and the Arvoisa Henry Fordin S¨a¨ati¨on is gratefully
acknowledged. Especially I would like to thank Prof. Ari Sihvola and Marja Lepp¨aharju for
unforgettable experience being a part of Finnish graduate school.
I wish to thank my family for their encouragement on my way to PhD studies and constant support during my life way. My warmest thanks go to my wife, Iuliia, for being a special part of me, for her support, help, understanding and encouragement.
Pavlo Molchanov Tampere, October 2014 v
Contents
Abstract iii Preface v Contents vi List of Acronyms xi List of Figures xiList of Tables xviii
1 Introduction 1
I Need of automatic target classification systems . . . 1
A) Sensors used for automatic surveillance . . . 1
II Motivation and research objectivities . . . 2
A) Micro-Doppler phenomenon . . . 2
B) Radar target classification . . . 5
C) Joint time-frequency analysis . . . 7
D) Higher-order spectral analysis . . . 7
E) Unmanned Aerial Vehicle classification . . . 10
F) Joint usage of camera and automotive radar for overtaking assistance . . . 11
G) Frequency band invariant automotive radar system for pedestrian classifi-cation . . . 12
H) Feature selection . . . 13
I) Multiple target classification . . . 13
III Outline of the Thesis . . . 14
IV Publications and author’s contribution . . . 15
2 Basics of radar signal processing 17 I Continuous Wave (CW) radar . . . 18
A) Velocity estimation . . . 18
II Frequency Modulated Continuous Wave (FMCW) radar . . . 19
A) Range estimation . . . 20
B) Range and velocity estimation . . . 22
C) Range-Doppler processing by 2D DFT . . . 24
D) Triangular wave . . . 25
E) Azimuth estimation . . . 27 vii
viii Contents
3 Period estimation of micro-Doppler signature 31
I Introduction . . . 31
II Suggested approach . . . 33
A) Problem statement . . . 33
B) Theoretical background . . . 33
C) Developed approach . . . 34
D) Correction of non-integer number of periods . . . 35
E) Optimal window length estimation . . . 35
F) Block diagram of the proposed algorithm . . . 35
G) Computational complexity analysis . . . 36
III Performance evaluation with simulated data . . . 36
IV Performance evaluation with measured data . . . 39
A) Human walking indoors . . . 39
B) Toy helicopter blade rotation . . . 40
C) Variations in target aspect angle . . . 40
4 Machine learning techniques and feature selection 45 I General notations for the Chapter . . . 46
II Dimensionality reduction . . . 46
A) Linear discriminant analysis . . . 46
III Decision making techniques . . . 47
A) Statistical classifiers . . . 47
B) Maximum likelihood decision rule . . . 50
C) Support vector machine (SVM) . . . 50
D) Multilayer perceptron . . . 51
IV Techniques for performance evaluation . . . 52
A) Probability of correct classification . . . 52
B) K-fold cross validation . . . 52
C) Confusion matrix . . . 52
V Feature selection by information-based criteria . . . 53
A) Theoretical background . . . 54
B) Proposed algorithm . . . 56
C) Comparative analysis . . . 59
VI Summary . . . 64
5 Bispectrum-based features 67 I Higher order spectral techniques . . . 67
A) Geometrical interpretation of frequency and phase coupling phenomenon in radar returns . . . 71
B) Micro-Doppler signature of human walking . . . 73
C) Bispectrum analysis for the human walking . . . 75
D) Bicoherence analysis . . . 78
II Classification of one, two and three walking humans . . . 81
A) Theoretical background . . . 82
B) Experimental data . . . 84
C) Analysis of classifier performance . . . 88
III Aerial target classification . . . 94
Contents ix
B) Feature extraction strategies . . . 96
C) Computer simulated data . . . 101
D) Results . . . 103
E) Discussions . . . 110
IV Summary . . . 111
6 Automotive radar 113 I Usage of automotive radar in application of video-based overtaking assistance . . . 113
A) Description of the proposed system . . . 114
B) ROI determination by a radar . . . 115
II Pedestrian classification by automotive radar via frequency band invariant features 120 A) General scheme . . . 121 B) Key observations . . . 122 C) Proposed approach . . . 125 D) Data collection . . . 128 E) Classification results . . . 129 III Summary . . . 135
7 Classification of small UAVs and birds by micro-Doppler signatures 137 I Introduction . . . 137
II Related work . . . 138
III Signal model . . . 139
IV Proposed approach . . . 140
A) General scheme . . . 140
B) Estimation of micro-Doppler signature . . . 141
C) Filtering . . . 141
D) Alignment of the micro-Doppler signatures . . . 142
E) Feature extraction . . . 144
V Rotor diameter estimation . . . 146
VI Data collection . . . 147
VII Classification results . . . 149
A) Classification by rotor diameter . . . 149
B) Classification by extracted features . . . 151
VIII Summary . . . 155
8 Classification of ground moving radar targets by using joint time-frequency analysis 157 I Introduction . . . 157
II Real radar data description . . . 157
III Problem Statement . . . 158
IV Feature Extraction Algorithms Suggested . . . 159
A) Bilik’s approach . . . 159
B) Time-Frequency Distribution - Direction Features (TFD-DF) . . . 159
C) Time-Frequency Distribution - Singular Values Decomposition - Fourier Transform (TFD-SVD-FT) . . . 160
V Experimental setup . . . 162
VI Analysis of Experimental Results . . . 164
x Contents
Conclusions and Future Work 171
List of Acronyms
ADC Analogue-to-Digital Converter
ANN Artificial Neural Network
AWGN Additive White Gaussian Noise
CV Cross-Validation
CW Continuous Wave
dB decibel
DFT Discrete Fourier Transform
FFT Fast Fourier Transform
FMCW Frequency Modulated Continuous Wave
IFs Instantaneous Frequencies
ISAR Inverse Synthetic Aperture Radar
HOS Higher-Order Spectra
HOSI Higher-Order Spectra Invariants
LBM Local Binary Mask
LDA Linear Discriminate Analysis
LRR Long Range Radar
m-D micro-Doppler
MI Mutual Information
MIMI Maximum Information Minimum Intersection
ML Maximum Likelihood
MLE Maximum Likelihood Estimator
MLP Multilayer perceptron
MSE Mean Squared Error
MR Maximum Relevance
mRMR minimum Redundancy Maximum Relevance
NBC Naive Bayes Classifier
PCA Principal Component Analysis
PDF Probability Density Function
PSF Point-Spread Function
RCS Radar Cross Section
ROI Region Of Interest
SNR Signal-to-Noise Ratio
SRR Short Range Radar
UAV Unmanned Aerial Vehicle
WAVE Wireless Access for Vehicular Environments
List of Figures
1.1 Nature of Doppler and micro-Doppler effects. Doppler effect arises with motion
of rigid body object. Complex motion (e.g. translational and rotational motion) of rigid body, or motion of non-rigid body, causes unique frequency modulation of
radar signal called micro-Doppler phenomenon. . . 3
1.2 Human locomotion as an example of non-rigid body motion which provokes
micro-Doppler phenomenon. Human locomotion involves different body parts to move by
a special law. Different activities have different motions of body parts. . . 4
1.3 Spectrogram of micro-Doppler signal provoked by walking human. The signal is
simulated by software designed in [30] with wavelengthλ= 0.02 m. . . 4
1.4 Example of the spectrogram of micro-Doppler phenomenon from rotating propeller
(top view). . . 5
1.5 Different approaches to radar target classification . . . 6
1.6 Analysis of the simulated radar backscattered signal of the human walking.
Spec-trogram (top left), squared magnitude short-time Fourier transform, represents time-frequency energy distribution. Phase plot (top right) shows phase distribu-tion on the time-frequency plain. Phase plot is difficult to analyse and therefore is missed from analysis by many researchers. Bicoherence plot (bottom) shows phase coupling of the frequency components. Bicoherence estimate takes into account
phase information in the short-time Fourier transform. . . 8
1.7 High range resolution profiles for three targets (AH-64, An-26 and B-52) depending
on the variations of aspect angle (185o, 190o, 195o). Range is horizontal axis,
amplitude is vertical axis. . . 9
2.1 Structure of the CW radar, Ps power splitter, Tx transmitting antenna, Rx
-receiving antenna, LPF - low pass filter, Amp - amplifier, ADC - analogue to digital
converter. . . 18
2.2 Block scheme of FMCW radar. VCO - voltage controlled oscillator, Ps - power
splitter, LPF - low pass filter, Tx - transmitting antenna, Rx - receiving antenna . 19
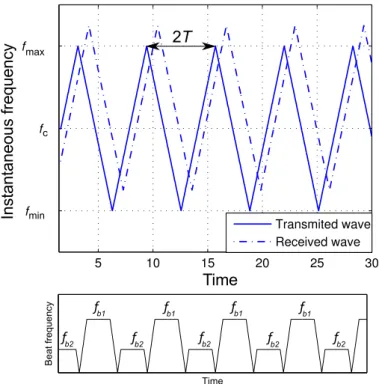
2.3 (Top) Instantaneous frequency of transmitted and received waves in case of a single
stationary object. (Bottom) Resulting beat frequency. τ is a signal delay caused
by wave travelling double distance to an object,T is a period of modulation,B is
a bandwidth of modulation . . . 22
2.4 (Top) Instantaneous frequency of transmitted and received waves in case of a single
moving object. (Bottom) Resulting beat frequency. Doppler shift is denoted asfd. 24
2.5 General scheme for range-Doppler processing by 2D DFT method. τ is maximum
possible delay due to signal travelling to and from an object . . . 26
xiv List of Figures
2.6 FMCW waveform and beat signals in case of triangular wave modulation: fb2 =
ff −fs,fb1=ff +fs. . . 26
2.7 Angle of arriving estimation by two receiving antennas. . . 27
2.8 Angle of arriving estimation by phase comparison technique. For far-field (r >> d) we assume that∠dc=θ. . . 29
3.1 Block diagram of the proposed algorithm. . . 36
3.2 Function D(i). The frequency content of the spectrogram illustrated in Fig. 1.3. The period of the spectrogram depends on the position of the second maximum. . 37
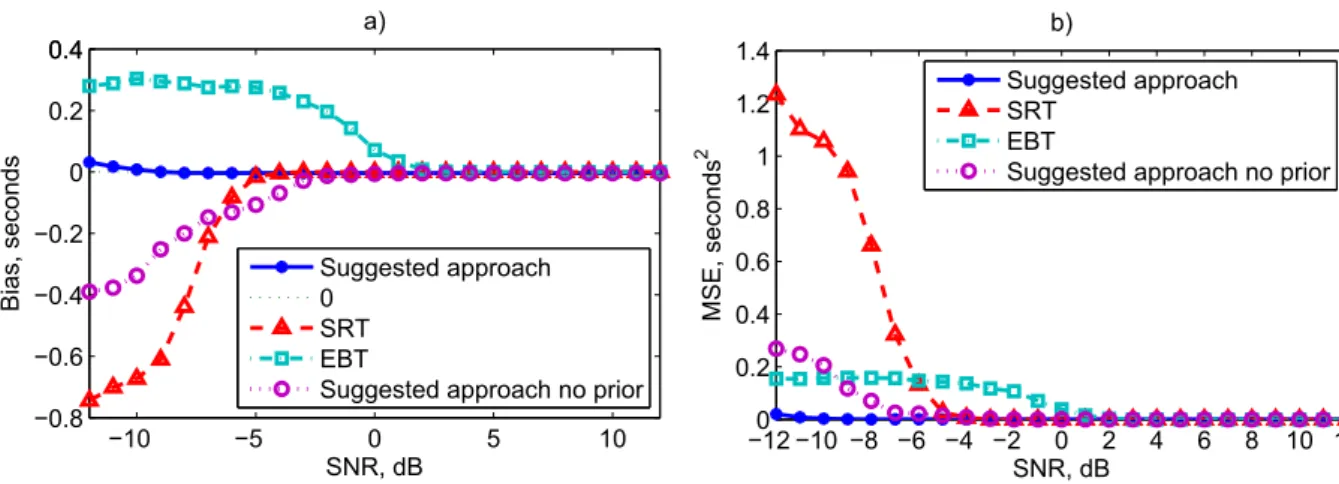
3.3 Bias (a) and MSE (b) of estimators depending on SNR level, computed for modeled micro-Doppler data of walking human. . . 38
3.4 Maximum value of function D(i) depending on the length of window function L. . 38
3.5 Estimated period of human gait depending on the distance. The data for experi-ment were collected indoor in the 20 meters long corridor. . . 39
3.6 Experimental setup of micro-Doppler signal collecting from rotating blades of a toy helicopter. . . 40
3.7 Spectrogram of micro-Doppler signal from rotating blades of a toy helicopter. . . . 40
3.8 Period of micro-Doppler signature as a function of observed signal length, obtained from helicopter’s blades and estimated by the suggested approach. The results for method without correction (Section D)) is shown as dashed line. The result after correction by (3.13) is shown as a solid line. . . 41
3.9 Spectrograms of micro-Doppler signal of walking human with aspect angle 0o (a) and 90o (b). The data is recorded by 24 GHz radar outdoor. . . . . 41
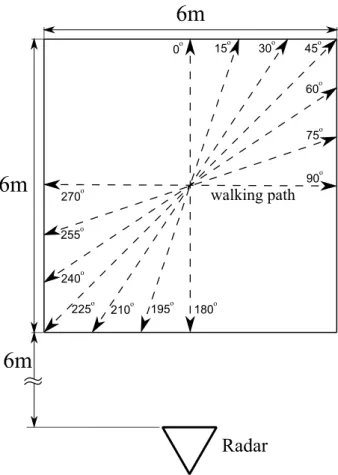
3.10 Experimental setup (top view) of micro-Doppler data collection of human walking at different aspect angles. . . 42
4.1 Feature extraction is a typical operation for machine learning. It is used to trans-form high-dimensional radar data into low-dimensional space, then features are used for classification, instead of radar data. . . 45
4.2 K-means clustering algorithm . . . 49
4.3 Probability density function approximation by a two stage algorithm. First initial estimate is obtained from K-means algorithm and then the final one by GMM. . . 50
4.4 Classification by Naive Bayes Classifier (on the left) and SVM (on the right) for 2 dimensional feature space. . . 51
4.5 N-fold cross-validation as a method for performance estimation of a classification scheme for 2-classes problem . . . 53
4.6 10-fold CV error rate on HDR (a), PIE (b), ARR (c) and PCMAC (d) data sets using MIMI, mRMR and MR features. . . 62
4.7 LOOCV error rate on AR (a) and LYM (b) data sets using MIMI, mRMR and MR features. . . 63
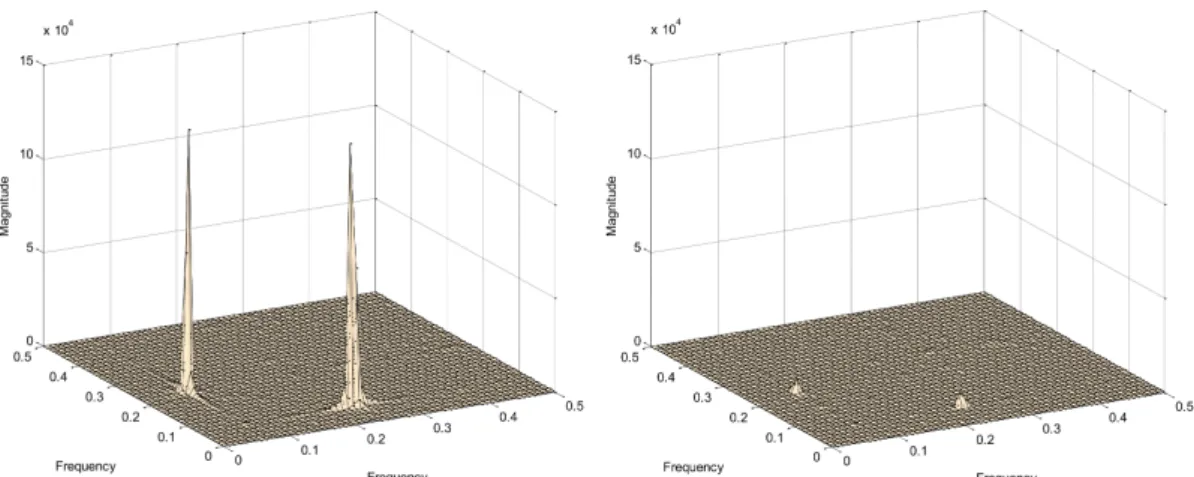
5.1 Analysis of random distributions by power spectrum density (top) and bispectrum (bottom). . . 70
5.2 Analysis of phase coupling by bispectrum analysis. Amplitude estimates are shown for signal with phase coupling (left) and without (right). . . 71
5.3 Scenarios for frequency coupling to exist. . . 72
5.4 Scenario for phase coupling to exist. . . 73
List of Figures xv
5.6 Human walking models: (a) with 12 body parts, 3 translational trajectories and
14 rotation trajectories, image is taken from [166]; (b) time-velocity dependence of
body parts involved in human walking, image is taken from [156]. . . 74
5.7 Analysis of the simulated radar backscattered signal of the human walking.
Spec-trogram (top left), squared magnitude short-time Fourier transform, represents time-frequency energy distribution. Phase plot (top right) shows phase distribu-tion on the time-frequency plain. Phase plot is difficult to analyse and therefore is missed from analysis by many researchers. Bicoherence plot (bottom) shows phase coupling of the frequency components. Bicoherence estimate takes information of
phase information in the short-time Fourier transform. . . 76
5.8 Analysis of real radar backscattered signal of the human walking. Spectrogram (top
left), squared magnitude short-time Fourier transform, represents time-frequency energy distribution. Phase plot (top right) shows phase distribution on the time-frequency plain. Bicoherence plot (bottom) shows phase coupling of the time-frequency
components. . . 76
5.9 Analysis of sinusoidal baseband signal by STFT and bicoherence. Spectrogram (top
left), squared magnitude short-time Fourier transform, represents time-frequency energy distribution. Phase plot (top right) shows phase distribution on the time-frequency plain. Bicoherence plot (bottom) shows phase coupling of the time-frequency components. Because of a single component there are no phase coupling and
bico-herence estimate doesn’t have a pattern. . . 77
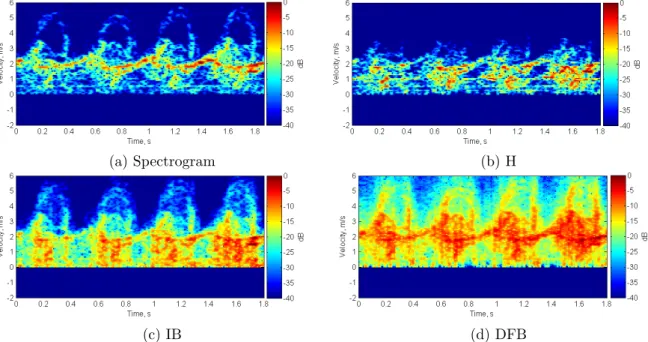
5.10 Bispectrum-based TFD computed simulated radar signal of human walking: (b)
H, (c) IB, (d) DFB; compared to spectrogram (a). . . 78
5.11 Bispectrum-based TFDs computed for real radar data of human walking. . . 79
5.12 Contributions of the body part to the bicoherence estimate. One by one, body parts are removed from the simulator, spectrogram of the resulting signal is on the left. The contribution of the body part (by (5.21)) to bichorence estimate is shown
on the right. . . 80
5.13 Bicoherence estimate of the radar return of human walking, with highlighted areas
of contributions. . . 81
5.14 Comparison of contributions to bicoherence estimates of simulated and real radar
data. . . 81
5.15 Structure scheme of a decision making concept applied in this study. A non-stationary signal can be divided into a series of quasi non-stationary segments. The features are extracted and conditional posterior probabilities are computed for those segments. Conditional probabilities are then multiplied and the maximum
likeli-hood rule is applied . . . 82
5.16 Scheme of the ATR system implemented in this work . . . 83
5.17 Ground surveillance radar system used for experimental data collection. . . 85
5.18 Time-frequency radar signatures measured in vegetation clutter and represented by: (a) spectrogram; (b) bicepstrum-based features (5.19); (c) bicepstrum-based features (5.20). The spectrogram is computed in the form of the amplitude of the Short Time Fourier Transform (STFT), and the bicepstrum-based features are
xvi List of Figures
5.19 Bispectrum based features CDFB (5.23) belonging to one (a), two (b) and three (c) walking persons and their approximation (d) using the 3-order GMM at the level
of 3 σ. The regions occupied by information features corresponding to different
classes overlap; therefore, a sophisticated classifier strategy must be applied. . . 86
5.20 Histograms of the second bicepstrum/cepstrum coefficients related to the single (blue), two (red) and three (green) walking persons and computed using: (a) (5.23) and (b) (5.34). The histograms show that it is difficult to discern a single walking
person from two or three persons by using only this one feature. . . 87
5.21 Inter-class similarity computed for the feature vector C (5.34) (dashed curve) and CIB (5.22) (straight curve). The correlation values are smaller for the bispectrum-based feature extraction technique, which means the latter technique possesses
better orthogonality in its the features. . . 88
5.22 Scheme of the proposed ATR system. . . 89
5.23 Scheme of parameter estimation. An 11-fold cross-validation is applied for the performance evaluation of the ATR system, where a data mining is carried out and
the optimal parameters are estimated. . . 89
5.24 Probability of correct classification as a function of the processing data length for the GMM classifier (a) and MLP classifier (b). Decision making interval is equal
to 2 s. The regularity of the results does not depend on the classifier. . . 92
5.25 Probability of correct classification as a function of the processing data length for
the SVM classifier. The decision-making interval is equal to 2 s. . . 93
5.26 Probability of correct classification as a function of the feature vector dimension-ality. Parameters: the decision-making interval is equal to 2 s; the processing data
length is 64 ms; the cepstrum-based technique; and the GMM classifier. . . 93
5.27 Elapsed time for feature extraction depending on the processing data length and method used. The processing time required for bispectrum-based techniques is significantly larger than for the cepstrum-based technique. Fortunately, real-time implementation is possible, because the processing time is smaller than the
obser-vation length. . . 94
5.28 ATR used in this study for evaluation of the feature extraction strategies . . . 95
5.29 Effectiveness of the radar classification techniques depending on the aspect angle. Please note, that JEM effectiveness depends on the position and type of the jet, for example for turbine engine JEM will be more efficient for observing target from
behind. . . 96
5.30 Generalization of considered feature extraction strategies. . . 97
5.31 Amplitude variations of micro-Doppler content extracted from the radar returns
for aspect angle equal to 185o. . . . 98
5.32 Spectrograms of the micro-Doppler contributions for three aspect-angles of 185o,
190o, 195o and three aerial targets: Ah-64, An-24 and B-52. . . 100
5.33 Bicoherence estimates of the micro-Doppler content in the radar returns for three aerial targets and three aspect angles. . . 101
5.34 Correct classification probability rates depending on the window lengthL (a) and
the number of overlapping samples Q (b) computed using the BCH technique. . . . 105
5.35 Feature spaces of data for Scenario 2, aspect angle is 185o for training set, aspect
angles are equal to 190o and 195o for testing data set. . . 105
List of Figures xvii
5.37 Variability of aspect angle, roll and pitch under atmosphere turbulence. Radar data correspond to this parameters is used for testing, whereas clear data (without
variations of angles) is used for training . . . 108
5.38 Time elapsed for feature extraction depending on number of radar returns . . . 110
6.1 The overtaking scenario examined . . . 114
6.2 General structure of the proposed overtaking system . . . 114
6.3 Designed waveform for overtaking assistance application. It consists of three seg-ments: segment 1 - to estimate velocity and azimuth of an ongoing vehicle, segments 2 and 3 - to estimate range. . . 115
6.4 Periodogram of real life scenario at highway for scenario shown in Fig. 6.1. . . 117
6.5 Pinhole camera model of the considered application . . . 118
6.7 Application of proposed frequency band invariant automatic radar classification system . . . 121
6.8 General structure classification system . . . 122
6.9 Examples of the Doppler spectrum computed for human walking with the param-eters: (a) operating frequency 24 GHz, aspect angle 180o (b) operating frequency 77 GHz, aspect angle 105o (c); operating frequency 77 GHz, aspect angle 180o. . . 124
6.10 Spectrograms of human walking collected by 24 GHz (a) and 77 GHz (b) radars. Despite the fact that at radar data of 24 GHz human was walking faster, spectro-grams still look similar. . . 125
6.11 Main step to compute LBM descriptors of the Doppler spectrum (power spectrum density) . . . 126
6.12 Training and testing procedures of a pedestrian classification system based on LBM 127 6.13 Description of HOSI feature extraction . . . 128
6.14 Training and testing procedures of a pedestrian classification system based on HOSI129 6.15 Considered scenarios: a) Sc1: One and two persons walking toward and away from the radar; b) Sc2: One person walking or running perpendicularly to the radar LOS; c) Sc3: Person walking at random path; d) Sc4: Vehicle driving towards and backwards the radar; e) Sc5: Vehicle driving perpendicularly to the radar LOS; f) Sc6: Vehicle turns left and goes away; g) Sc7: Vehicle maneuvering . . . 130
6.16 Examples of spectrograms for each considered scenario . . . 131
7.1 Block scheme of the proposed approach . . . 140
7.2 Examples of the filtering for two cases (a) and (b): raw spectrogram is on the left hand side; result of the filtering is on the right hand side. . . 143
7.3 Examples of the averaged radar clutter estimated from data used in experiments. . 143
7.4 Examples of the alignment’s results for flying birds: left - raw spectrogram and tracked motion; right - aligned spectrogram . . . 145
7.5 Example of the spectrogram from small helicopter, on the left hand side. Result of the projection of spectrogram to frequency dimension, on the right hand side. Red line shows the threshold for bandwidth estimation . . . 147
7.6 Examples of UAVs used for experimental study, from left to right, from top to bottom: YAK54 (class 1), EasyStar El-Sailor (class 2), Parrot AR.Drone (class 4), stationary rotors (classes 5-8), Mikado Logo 600 (class 9), Mikado Logo 400 (class 10), Align T-REX 450 (class 11). . . 148
xviii List of Figures
7.7 Examples of filtered and aligned micro-Doppler signatures of 5 classes (first row);
Eigenvectors corresponding to the largest eigenvalue (second row) and the second largest eigenvalue (third row) of Ψ for corresponding signatures. These eigenvectors are basis functions of the micro-Doppler signatures. . . 149
7.8 Probability density function of the rotor’s diameter estimate, for (a) Mikado Logo
400 (class 10), true value 1.04 m; (b) Align T-REX 450 (class 11),true value 0.715 m.150
7.9 Probability of correct classification for 11-classes problem depending on: (a) the
number of Fourier coefficients in (7.13); (b) depending on the number of eigenpairs in (7.14) . . . 151 7.10 Classification rate for 11-class problem depending on the dwell time . . . 155 7.11 Classification rate depending on SNR, 11-classes problem . . . 156
8.1 General structure of the TFD-DF feature extraction method for a test signal
-sinusoidal baseband signal. It extracts features that depend on relevant information
and parameters of the radar signal and irrelevant to not informative ones. . . 161
8.2 Block-scheme of classification algorithm . . . 162
8.3 The decisions are made on local segments of radar date and then aggregated by
majority voting. . . 163
8.4 Single walking human. Spectrogram (on the left) and first five left singular vectors
with singular values (on the right). . . 164
8.5 Truck. Spectrogram (on the left) and first five left singular vectors with singular
values (on the right). . . 165
8.6 Noise (clutter). Spectrogram (on the left) and first five left singular vectors with
singular values (on the right). . . 165
8.7 Wheeled. Spectrogram (on the left) and first five left singular vectors with singular
values (on the right). . . 165
8.8 Human running. Spectrogram (on the left) and first five left singular vectors with
singular values (on the right). . . 166
8.9 Human crawling. Spectrogram (on the left) and first five left singular vectors with
singular values (on the right). . . 166 8.10 A group of people walking. Spectrogram (on the left) and first five left singular
vectors with singular values (on the right). . . 166 8.11 A group of people running. Spectrogram (on the left) and first five left singular
List of Tables
3.1 Bias of the proposed algorithm depending on the window lengthL . . . 38
3.2 Estimated period (in ms) of human walking at different aspect angles . . . 43
4.1 An example of a confusion matrix . . . 53
4.2 Artificial data used for comparison. . . 58
4.3 Values of weighting vector at different stages . . . 58
4.4 Results of feature ranking and selection of data provided in Table 4.2 . . . 60
4.5 Data sets used in comparison analysis . . . 60
4.6 Error rates (%) obtained by wrapper feature selection. Smaller is better . . . 64
5.1 The probabilities of correct classification given in percentages. Each cell situated in the intersection of the column corresponding to the window width (length of each segment) and row corresponding to the integration time parameter, is split onto three subcells. Each subcell corresponds to the feature extraction technique considered; from left to right: CIB (5.22), CDFB (5.23) and C (5.34) . . . 91
5.2 Confusion matrices for the considered techniques with a data length of 512 ms and decision making time of 2 s. . . 92
5.3 Main characteristics of aerial targets used in the computer simulations . . . 102
5.4 Data dimensions for Scenario #1 fixed aspect angle and single target . . . 104
5.5 Correct classification probability rates computed in percentages. Scenario #1 . . . 106
5.6 Correct classification rates computed in percentages. Scenarios #2 and #3 . . . . 106
5.7 Confusion matrices. Scenario #2 . . . 107
5.8 Classification rates computed in atmosphere turbulence environment . . . 109
6.1 Classification probabilities obtained with LBM features, values represent the per-centage of the data to be classified as pedestrian or vehicle, respectively. Training and testing sets are constructed from 24 GHz radar data . . . 132
6.2 Classification probabilities obtained with HOSI features, values represent the per-centage of the data to be classified as pedestrian or vehicle, respectively. Training and testing sets are constructed from 24 GHz radar data . . . 133
6.3 Classification probabilities obtained with LBM features, values represent the per-centage of the data to be classified as pedestrian or vehicle, respectively. Training set of pedestrian class contains simulated 77GHz radar echoes of human waling, testing sets is constructed from 24 GHz radar data . . . 134
6.4 Classification probabilities obtained with HOSI features, values represent the per-centage of the data to be classified as pedestrian or vehicle, respectively. Training set of pedestrian class contains simulated 77GHz radar echoes of human waling, testing sets is constructed from 24 GHz radar data . . . 134
xx List of Tables
7.1 UAVs used for experimental verification of the proposed ATR system. Type ‘P’ is
for Plane, ‘H’ is for Helicopter, ‘Q’ for quadrocopter, ‘B’ for birds, ‘S’ for stationary
rotors. . . 148
7.2 Probability of correct classification obtained for 5 classes problem using 10-fold
cross validation. Only rotor’s diameter is used as a feature . . . 150
7.3 Confusion matrix for non-linear SVM classifier (5 classes problem using 10-fold
cross validation). Only rotor’s diameter is used as a feature . . . 150
7.4 Probability of correct classification obtained for 5-classes problem using 10-fold
cross validation. . . 152
7.5 Probability of correct classification obtained for 11 classes problem using 10-fold
cross validation. . . 152
7.6 Confusion matrix (in percentages) for linear SVM classifier, 11-classes problem . . 153
7.7 Classification of UAVs hidden from training procedure, 11-classes problem . . . 153
7.8 Classification of the unseen for training classes, 5-classes problem . . . 154
8.1 Accuracy of correct classification depending on decision making time. GMM classifier.168
8.2 Confusion matrix. TFD-SVD-FT. τ = 4sec. GMM classifier. . . 168
8.3 Confusion matrix. TFD-DF.τ = 4sec. GMM classifier. . . 168
8.4 Confusion matrix. BA. τ = 4sec. GMM classifier. . . 169
8.5 Accuracy of correct classification depending on decision making time. SVM classifier.169
8.6 Confusion matrix. TFD-SVD-FT. τ = 4sec . . . 170
8.7 Confusion matrix. TFD-DF.τ = 4sec . . . 170
Chapter 1
Introduction
I
Need of automatic target classification systems
Knowledge and understanding of our surrounding environment is very important to protect our-self from external interference. For many years humanity has constructed defence systems to protect their goods. Surveillance of our surrounding environment is an important aspect of de-fence, as it helps protectors prepare helps for any unwelcome and sudden interference into their territory. Surveillance systems may also have many civil applications. For instance, fire preventing and extinguishing is more efficient if the number of persons and their positions are known inside buildings. Also, automatic (using sensors) door-opening and light switching devices could save re-sources. Observation of traffic conditions may help drivers avoid a collision. However, surveillance performed by humans may be inaccurate due to the “human factor”, which may cause unpre-dictable consequences. Moreover, human sense of the surrounding environment is limited by personal abilities. The “human factor” may be reduced by auxiliary devices or assistant systems. During the last 70 years, progress in electronics made it possible to build a computer, a device which utilizes logic and arithmetic-based operations. Further development helped to construct powerful computing units, which surpassed humans in logic and arithmetic calculations. One of the computer science branches, artificial intelligence, studies how to develop smart systems that could make a decision depending on input parameters. Success in artificial intelligence over last 30 years has made it possible to build semi- and fully automatic decision making systems. One of these systems is an automatic surveillance system which can detect, determine the class and estimate parameters of the objects around.
One of the advanced automatic surveillance technologies allows determination of the type of object, which is performed by automatic target classification. Such a system performs surveillance on large areas and for multiple target scenarios simultaneously. It can, for example, estimate the number and position of persons inside buildings, estimate traffic conditions, perform automatic door opening and light switching, warn of invasion to area etc. The “sensing”, or environment understanding is done by devices called sensors. Some sensors can overcome human abilities in sensing and, therefore, such systems have high potential in automatic surveillance.
A) Sensors used for automatic surveillance
Information used by automatic surveillance and target classification about surroundings depends on the sensor type. Below is an overview of the advantages and disadvantages of several currently available sensors.
2 Chapter 1. Introduction
Visual/video camera sensors measure energy of optical light. Such sensors are low cost and can reconstruct a picture seen by the human eye. It makes easy to recognize objects in good light conditions and absolves obstacles. Systems based on camera sensors could be used for wide view, short-range surveillance or narrow view, far field surveillance. However, good performance is achieved with good weather conditions only. Fog or rain may reduce their efficiency. Moreover, powerful hardware is required due to processing of large data amount.
Infrared sensors estimate energy in infrared range. Their main advantage is capability to detect orthogonal (lateral, perpendicular) movements even at bad optical light. Disadvantages include poor detection of radial motions and poor performance at bad weather conditions such as rain. Also, it is difficult to estimate object parameters such as speed, distance, etc.
Ultrasound sensor is an active device which estimates time delay of transmitted and received waves, providing information of distances to objects. Disadvantages of such sensors are that they have short working distance, speckle and incapability of providing speed measurements precisely.
Radar sensor is based on reflection of electromagnetic waves. High frequency band allows it to estimate radial velocity of the target very precisely, together with accurate distance mea-surements. Other advantages of radar sensors include almost all weather and light condition operation, capability to penetrate through objects, and long operation distance. Disadvantages of the radars include worse 2D and 3D spatial resolution and possible interference with other high frequency electro magnetic waves and multiple reflections.
Furthermore, due to the long operation range and ability to measure moving parameters (distance, speed etc.), radar sensors have a high potential in automatic target recognition systems and considered in this Thesis.
II
Motivation and research objectivities
A) Micro-Doppler phenomenon
The Doppler content arises in radar returns due to the Doppler effect caused by micro-motions [30]. All micro-motions in the scene affect the frequency of the radar’s transmitted wave (as well as all other reflected waves) by changing it, with the value of the frequency shift proportional to the radial velocity. Time varying behavior of micro-motions forms a micro-Doppler signature in a form of Frequency Modulated (FM) multi-component signals.
Principle behind micro-Doppler phenomenon is illustrated in Fig. 1.1. All waves scattered from a moving object will be subject frequency shift, named Doppler effect. For radar it results in a shift of frequency of received wave in respect to transmitted one due to the motion of an object. Basically, the shift is caused by rapid phase changes of reflected wave. If an object is moving then distance to it changes from one successful wave crest to another; therefore, the phase of received wave is changing as well from one crest to another, with respect to transmitted wave. Regular phase changes result in a frequency shift.
Micro-Doppler phenomenon arises with motion of non-rigid body or a complex motion, when the global motion consists of several local micro-motions. As it is illustrated in Fig. 1.1, motion of the object illustrated at bottom consists of translational and rotational motion, resulting in frequency modulation of the reflected signal.
II. Motivation and research objectivities 3 Transmitted wave Received wave Radar
Doppler effect
ft fr = ft+fd Transmitted wave Received wave Radarmicro-Doppler phenomenon
ft fr(t)= ft+fd(t) v v Time Fr eq u en cy Time Fr eq u en cyMotion of non-rigid body causes unique FM of radar signal
Figure 1.1: Nature of Doppler and micro-Doppler effects. Doppler effect arises with motion of rigid body object. Complex motion (e.g. translational and rotational motion) of rigid body, or motion of non-rigid body, causes unique frequency modulation of radar signal called micro-Doppler phenomenon.
Micro-Doppler signature is a characteristic of motion preserved for a special type of objects. Human activities, generally, involve different body parts with different motion structure. There-fore, these activities could be analysed by micro-Doppler signatures. Examples of human loco-motions including walking and running are illustrated in Fig. 1.2.
A common technique for micro-Doppler analysis is the time-frequency representation [33]. Nowadays, conventional spectrogram defined as the square modulus of the short-time Fourier transform (STFT) is a widely spread tool used for time-frequency analysis of micro-Doppler content. Spectrogram is usually computed by using a sliding window truncating a received signal by the sequence of short-time segments and Fourier transform (FT) related to the short-time segmented signals. A larger window length provides higher frequency resolution in the STFT, however, as a consequence, poorer temporal resolution is observed at the same time.
Spectrogram of the simulated1 radar return signal for continuous-wave radar is shown in Fig.
1.3. Each body part involved in walking has a sinusoidal-like change of the velocity during a gait, therefore, forming sinusoidal-like patterns at spectrogram. Human leg has the highest speed and stands out of a common group. The common group is formed by a human body motion and other body parts with a low motion, like shoulders, head etc.
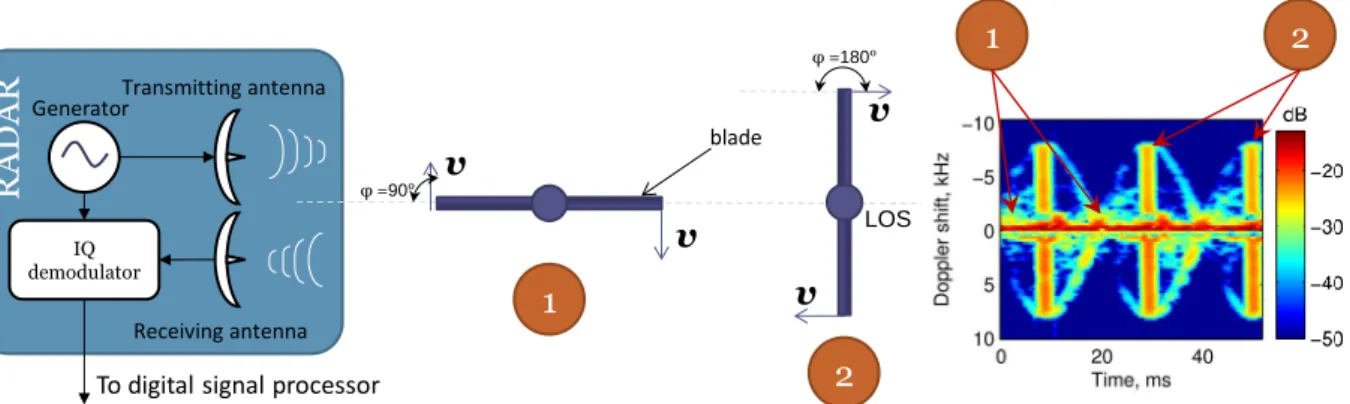
Another source of the micro-Doppler phenomenon is a rotation of a propeller or a blade of flying objects. An example of the spectrogram of the rotating blade is shown in Fig. 1.4. Two key positions of the blade with respect to the radar line of sight (LOS) are marked as ”1” and
”2”. In the position ”1” the blade lies in the LOS plane, and therefore, an angle φ between the
velocity vector and LOS is 90oresulting in near zero Doppler shift. In the position ”2”, the blade
is orthogonal to the LOS forming φ = 180o between direction of the velocity vector and LOS.
Moreover, in position ”2”, the blade reflects the signal from the multiple points between blade’s
1Radar simulated data of a micro-Doppler signal of a walking human is developed in [22] and implemented in [30].
4 Chapter 1. Introduction
(a) Walking
(b) Running
Figure 1.2: Human locomotion as an example of non-rigid body motion which provokes micro-Doppler phenomenon. Human locomotion involves different body parts to move by a special law. Different activities have different motions of body parts.
Figure 1.3: Spectrogram of micro-Doppler signal provoked by walking human. The signal is
II. Motivation and research objectivities 5 Transmitting antenna Receiving antenna Generator IQ demodulator v v blade v v φ =90° φ =180° LOS 1 2 R A DA R
To digital signal processor
1
2
Figure 1.4: Example of the spectrogram of micro-Doppler phenomenon from rotating propeller (top view).
root and blade’s tip, with a velocity from −v to v (tip’s velocity) introducing splashes at the
spectrogram. Between positions ”1” and ”2” we can observe only reflections from the tip, which have a sinusoidal like pattern.
In case of repeatable action of the moving parts, the micro-Doppler signal becomes periodic. One of the main micro-Doppler parameters is a period. It characterises a human gait duration, walking speed, in case of human walking, and a number of propeller rotations per time unit in the case of a rotation blade. Most of the robust methods of period estimation [12, 35, 140, 143, 151, 159] require a prior knowledge of an object or a moving model. In contrast to them, we will propose in Chapter 3 a period-estimation method that requires no a priori knowledge about object and character of the motion. Moreover, the method adaptively estimates the window length for a time-frequency distribution estimation.
B) Radar target classification
Information retrieved from the radar returns could be used for a classification of an object on the scene. Many industrial radars have an output of the demodulated baseband signal which is in a audible range of frequencies. This allows to listen to the output directly by human. The person, called “listener”, listen to the output and makes a decision about the presence of a moving objects in the areas of interest. Recently, researchers working on the problem of moving target recognition and classification by using ground surveillance Doppler radars have paid much attention to development of completely automated systems operating without any human-operator involvement. Advances in artificial intelligence allow to build radar-based automatic target recognition / classification (ATR) systems [157].
Generally, we could divide automatic radar target classification systems into three categories: template matching, model based and machine learning. This division is illustrated in Fig. 1.5.
The idea behind the template matching is to make a decision of a target type by matching the received signal with the predefined dictionary, which contains radar signals of all targets of interest. Generally matching procedure is performed with a radar signal transformed to another space, e. g. spectrum, spectrogram or other transforms. This method is used together with different time-frequency distributions [103] or using dynamic time wrapping [152] techniques. Disadvantage of this approach is a slow decision making process, because a dictionary is typically huge. The advantage of this approach is that only a small amount of information is lost during the transformation. Template matching could perform very good if the dictionary is constructed
6 Chapter 1. Introduction
Radar target
classification
Template
matching
Model
based
Machine
learning
Figure 1.5: Different approaches to radar target classification
in an efficient way and contains all possible signatures of the target.
Model based approach of radar target classification allows to estimate the probability of the radar data to be of a predefined model. For example, models of human walking and running can be used to classify radar data of a human locomotion [65]. Model-based approach simulates the radar data (either in time or in transform domain, like spectrogram) with different input parameters of the model, like step length, height, speed etc. Then, the task is to find with which parameters the difference between the simulated and real radar data is minimal. The advantages of such a method include estimation of target parameters (e.g. like height and speed of a walking human). Disadvantages include a long decision making time, high system requirements on processing unit because of model recalculation for different parameters. Another drawbacks are requirements of a generalized model which uses target parameters (like kinematic parameters for human activity) and “curse of dimensionality”, the problem of non-convergence because of a huge number of input parameters to the model (like velocity, height, aspect angle etc.)
Machine learning is a science of information retrieval from the data. It’s primary goal to learn regularities, properties and rules with which data are formed. After the learning process, a decision making could be performed based on the learned rules. In such a way machine learning could be used to learn the radar data of different targets and then be used to predict a class label of unseen data. The concept of machine learning requires mainly computational power to discover the properties of the data, which is performed off-line during the training procedure, and the decision making by itself is very fast. Therefore, commonly, powerful computational units are used to learn the data, and then a micro-controller could perform a decision making. Disadvantage of such approaches is requirements of a feature extraction step prior to decision making. Feature extraction is a procedure to transform high-dimensional data into a low-dimensional space, called features, with preserving as much as possible useful information about the target and removing all irrelevant. Removing of irrelevant data is required to prevent the machine learning to lean the data based on the irrelevant features. Commonly, for high relevance of the features, data is transformed to another domain where the connection with real physical features is difficult to find. A number of studies have proven the relevance of this method for real radar data [17, 86, 102].
In the rest of the Thesis we will focus on radar target classification by machine learning ap-proach. This method was chosen because of fast decision making which is important for surveil-lance of huge areas and operation in multiple target environment. Even though, a number of approaches have been proposed of radar target classification by machine learning [17, 86, 102], the research on this topic is still ongoing. This can be explained by a fact that it is difficult to define the best features. Moreover, existing system can not guarantee erroneousness operation
II. Motivation and research objectivities 7
together with low complexity.
C) Joint time-frequency analysis
Joint time-frequency analysis of non-stationary radar signals backscattered by a moving ground target provides an information about time-dependent Doppler frequency variations and allows ex-tracting unique recognition and classification features, i.e. the features that are definitely unique to radar target. In the recent years, number of approaches using different kinds of time-frequency distributions (TFD) for ground moving radar target detection, recognition and classification prob-lems have been developed [10, 17, 29, 31, 79, 102, 104, 166]. These include linear transforms such as the TFDs based on the STFT [31]; the spectrogram defined as the square modulus of the STFT [166]; bilinear transforms such as the Wigner-Ville distribution (WVD) [104]; and bispectrum-based TFD [10]. The performances of different decision making concepts for ground moving radar target classification have been studied and include Gaussian mixture model (GMM) concept [17, 107]; hidden Markov model (HMM) [79]; neural network approach [102]; independent component analysis [29]; support vector machine (SVM) [128]; k-nearest neighbour classifier [152]. The disadvantages of time-frequency analysis include uncertainty about parameters for es-timation (window length, overlapping) which results in frequency-temporal resolution trade-off. Another drawback is that target should be observed for period enough to capture temporal in-formation. Separation of the multiple targets is also a problem if they have close velocity profile. Moreover, the phase information of Fourier transform is lost for spectrogram based analysis meth-ods.
Features are extracted from time-frequency distributions for classification by machine learning. Researches have developed a number of feature extraction techniques which extract time-frequency behaviour of the micro-Doppler signature: based on cadence velocity diagram [19], smart generic features [86], Hermite S-method [127], Hough transform [35].
The majority of approaches referred to the moving object classification, unfortunately, do not take into account some interesting information features related to the target radial velocity time-evaluation. The main drawback of this approach lies in discarding of the time correlation between signatures. Assume that human gaits contain several steps. For the known methods dedicated to the pedestrian classification [17, 102], it does not matter in which sequence they are, i.e. Doppler signatures could be permuted. The researchers usually assume independence of the frequency profiles in spectrogram. In Chapter 8 two new methods of feature extraction from the spectrogram are proposed which use the time correlation information. Experimental results show effectiveness of the proposed methods when targets are observed longer than 0.5 seconds.
D) Higher-order spectral analysis
Moving person classification
Recently, approaches exploiting the m-D radar signatures for moving person classification have been reported in the literature [17, 28, 150, 151]. Most approaches deal with quadratic (spectrogram-based) TF analysis of non-stationary and multi-component backscattered radar signals. According to these approaches, discriminative features are extracted from the energy-based TF distributions, i.e. estimates of backscattered signal energy distribution per unit time per unit frequency. Un-fortunately, phase and frequency relationships between certain Doppler spectral components in radar returns that contain important information about phase- and frequency-coupled m-D con-tributions are irretrievable lost in the energy-based TF radar signatures. Therefore, a common
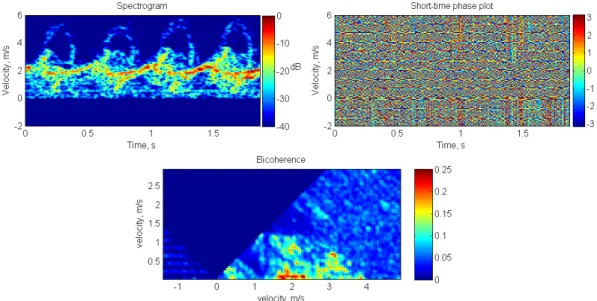
8 Chapter 1. Introduction
Figure 1.6: Analysis of the simulated radar backscattered signal of the human walking. Spec-trogram (top left), squared magnitude short-time Fourier transform, represents time-frequency energy distribution. Phase plot (top right) shows phase distribution on the time-frequency plain. Phase plot is difficult to analyse and therefore is missed from analysis by many researchers. Bico-herence plot (bottom) shows phase coupling of the frequency components. BicoBico-herence estimate takes into account phase information in the short-time Fourier transform.
drawback of the energy-based TF analysis is the impossibility of retrieving additional particular information concerning frequency- and phase-coupling of instantaneous frequencies contained in the radar backscattering. Phase coupling contained in radar backscattering carries an impor-tant information about individual target properties. Extraction of the latter phase relationships from radar backscattering could provide additional insight into radar moving target classifica-tion and improve the classificaclassifica-tion probability rate compared with commonly used energy-based classification features such as power spectrum and cepstrum features.
Fig. 5.7 demonstrates the spectrogram, phase term of STFT and averaged bicoherence es-timate, a measure of phase coupling of simulated radar return of human walking. We can see that spectrogram demonstrates clear repetitive behaviour of frequencies involved in a gait. Phase plot (Fig. 5.7 top right) demonstrates very stochastic behaviour which is difficult to analyse.
However, bichorence estimate (Fig. 5.7 bottom) shows that there is very strong phase coupling
(values higher than 0.5) between frequency components, letting us to assume that phase contains useful information that preserves information about the class. Latter in Chapter 5 we will analyse the contributions to the bicoherence estimate.
It will be shown in Chapter 5 that a sophisticated bispectrum-based signal processing can be used in ATR systems. It helps with extraction and use of phase coupled harmonics in raw radar backscattering contaminated by additive white Gaussian noise (AWGN) and vegetation clutter. The distinctive benefits of the bispectrum-based radar signature compared to a common energy-based spectrogram can be characterized as follows. First, the possibility of retrieving the phase coupled contribution, which common energy-based techniques are simply unable to provide. Second, the bispectrum tends to zero for a stationary zero-mean AWGN, which means that there are no phase coupled frequencies in a linear Gaussian process. Therefore, bispectrum-based
II. Motivation and research objectivities 9
AH-64 An-26 B-52
185o
190o
195o
Figure 1.7: High range resolution profiles for three targets (AH-64, An-26 and B-52) depending
on the variations of aspect angle (185o, 190o, 195o). Range is horizontal axis, amplitude is vertical
axis.
signal processing provides suppression of the AWGN contribution in the TF radar signature. As a result, powerful, (the phase coupled contributions unambiguously belonging to a moving target are emphasized) and the weak, (the phase independent spectral contributions belonging to vegetation clutter and AWGN) are diminished. Therefore, the bispectrum-based approach allows improved signal-to-noise ratio (SNR) in derivatives from the collected radar signatures and, hence, contributes to more accurate feature estimation.
Aerial target classification
Classification and identification of aerial targets by extracting features from the information con-tained in radar returns is a key task in air surveillance [69, 78, 122, 146, 149, 165, 181, 182].
Estimation of High Range Resolution Profile (HRRP) is one of the key techniques for aerial target analysis. HRRP can be considered to be the projection of the spatial intensity distribution of the backscattered electromagnetic field of the target onto the line of sight of the radar. HRRP, therefore, contains an information about the geometry of the aircraft. The contributions of rotating turbine or propeller blades to the radar backscattering in the form of a micro-Doppler
phenomenon2 [30] can contain additional classification information. Both HRRPs and Jet Engine
Modulation (JEM) allow extraction of classification features conforming to the aircraft geometry and particular engine characteristics.
As a result of an aerial target travelling over a large azimuth angle, the HRRP measured and recorded during this travel are affected by three main factors: speckle, rotational range migration and translational range migration. Due to the speckle effect, HRRPs can fluctuate significantly even with only slight aspect variations (as little as tenths of one degree), i.e. only a slight change in elevation or aspect azimuth is enough to provoke a considerable variation in the intensity of peaks, while the location of the peaks may remain unchanged. Examples of intensity variability of HRRPs are presented in Fig. 1.7 for three different types of aircrafts (helicopter AH-64, and
airplanes An-26 and B-52) and for aspect angles equal to 185o, 190o and 195o. These HRRPs
have been computed by using radio physical radar backscattering models developed in [146]. The micro-Doppler effect has been studied for a long time [23, 99, 144]. Concerning aerial
2
10 Chapter 1. Introduction
objects, researchers have mainly studied micro-Doppler effects generated by helicopters [159]. As-sessing the performance of classification methods based on micro-Doppler discriminative features is of considerable interest.
The phase information generated by rotating engine blades and contained in the micro-Doppler contributions can provide additional information about the target. Unfortunately, this informa-tion which gives rise to a phase coupling of micro-Doppler harmonics, is irretrievably lost in HRRPs. In addition, the micro-Doppler content is less sensitive to aspect angle variations than the HRRP. It was mentioned above that even slight aspect variations that are equal to tenths of one angle degree can provoke considerable intensity fluctuations in the HRRP. At the same time, these aspect variations do not create strong variations in the micro-Doppler content caused by the rotating engine (helicopter) blades. This phase information can thus provide certain benefits over the HRRP-based approaches commonly used in ATR systems, and this problem is studied in Chapter 5.
E) Unmanned Aerial Vehicle classification
Unmanned Aerial Vehicles (UAVs) are a special type of aerial targets which have small physical size as they are pilotless. UAVs can be equipped with sensors and weapons for military or civil missions. Civil applications include telecommunication, weather and border monitoring, and remote sensing. Military applications include air reconnaissance, bombing and conducting air combats.
According to the analysis of the market performed by M. Toscano [162], the global market of
the unmanned aerial systems is 11.3 billion US dollars on 2013 year. And over the next 10 years, the global market will increase up to 140 billions. Such a growth is of interest not only from the UAV manufacturers but also from developing of security systems.
The reason is that, UAVs could disturb official meetings, as it was in 2010 in Great Hall of the Binnenhof, The Hague, The Netherlands [89]. Another incident happened on September 15, 2013 when the mini quadcopter got very close to German Chancellor Angela Merkel before it crashed to the ground right in front of the Chancellor[138]. The incidents showed how it is important to be ready for such situations and that special systems should be developed to detect the UAV.
The detection and classification of the small UAVs can be performed by different sensors. The optical and infrared capturing sensors will be not the best solution due to the small size of the target, less than 0.1 m. The passive acoustic sensors will not perform good at long distances as well as the huge number of unwanted sources will corrupt the signal in urban environment. The best solution can be achieved by the radar sensors, and we are focused on this solution.
There are three main concepts in aerial target classification by the radar: High Resolution Range Profile (HRRP), Inverse Synthetic Aperture Radar (ISAR) images and micro-Doppler (m-D) signatures. Classification of UAVs by HRRP is problematic because sub centimetre resolution is required to capture a spatial structure of targets less than 100 cm in length; sub meter resolution can be achieved by systems with wide bandwidth, which are high-cost systems. The usage of ISAR is limited to the high resolution and long observation time requirements to get a reasonable image of the UAV. The m-D signatures provide distinguishing features of the rotating parts of the UAV, which are unique for special type of the UAV; moreover, this tool works with low-cost continuous wave radars. Due to the benefits, we recommend to use m-D signature concept for the classification of the UAVs.
The contributions of rotating turbine or propeller blades in radar backscattering in the form of micro-Doppler contents [30] can contain additional classification information about UAV char-acteristics. These micro-Doppler contributions are unique for different types of UAVs [43].
II. Motivation and research objectivities 11
The UAV classification based on micro-Doppler signature is a novel topic, and the performance of such a system is of interest of the Chapter 7.
F) Joint usage of camera and automotive radar for overtaking assistance
Overtaking on roads may be dangerous when oncoming traffic is detected by the driver too late, or its speed is underestimated. Recently proposed cooperative overtaking assistance systems are based on real-time video transmission, where a video stream captured by a camera installed at the windshield of a vehicle is compressed, broadcast through the wireless channel and displayed to the drivers of vehicles driving behind. In such a system it is of ultimate importance to deliver video information about the opposite lane with low end-to-end latency and good visual quality.
We assume that in near future all road users will be equipped with IEEE 802.11p/1609 Wireless Access for Vehicular Environments (WAVE), which opens a broad range of automotive applica-tions [83]. One of the applicaapplica-tions includes an overtaking assistance based on real-time video transmission [172].
One of the disadvantages of video based overtaking assistance is that in case of many video transmission sources (e.g. urban environment) the interference become huge and video’s bit-rate should be adapted accordingly. By other words, with increasing of the number of transmitting vehicles, video quality degrades significantly.
We propose reallocating the wireless channel resources in favor of the important part of the captured video frames to increase its visual quality. To achieve this goal we apply the automotive radar for the oncoming vehicle detection and use its relative position (of the vehicle with respect to the radar) as a region-of-interest (ROI) for the video rate control.
In order to determine ROI, azimuth and range of the oncoming vehicle should be estimated. This can be achieved by using K-band monopulse FMCW (Frequency Modulated Continuous Wave) radars [82, 175], which consist of one transmitter and two receivers installed on the over-taken vehicle.
Usage of the radar for the proposed cooperative VANET-enabled safety application is justified as follows:
• 24 GHz monopulse FMCW sensors are already available in modern cars for Adaptive Cruise
Control application [134]; azimuth and range estimation of oncoming objects is merely an additional digital signal processing task [81];
• in contrast to other approaches for real-time vehicle detection, e.g. camera-based [172], a
radar-based approach requires rather limited signal processing and is naturally suitable for the detection of oncoming objects without any a priori knowledge about their type and shape, weather conditions, etc.;
• although the geographical coordinates and velocity of the oncoming vehicle are contained
in cooperative awareness messages, the mapping of the oncoming vehicle to the image plane of the camera using this information can be a more complex problem than radar-based mapping.
In Chapter 6 a system which reallocates the wireless channel resources in favour of the part of the captured video frame that contains the oncoming vehicle is proposed. To achieve this goal we apply the automotive radar for the oncoming vehicle detection and use the image of this vehicle as a region-of-interest for the video rate control. We present the theoretical framework, which describes the basics of such an approach and can serve as a useful guideline for the future practical implementation of the overtaking assistance systems.
12 Chapter 1. Introduction
G) Frequency band invariant automotive radar system for pedestrian
classi-fication
According to the statistics of United Nations Organization published in ”Global Plan for the
Decade of Action for Road Safety 2011-2020”, each year approximately 1.3 million people die in road accidents, which is more than 3000 deaths per day, and more than half of these people are not travelling in a vehicle [126]. Therefore, protection of vulnerable road users, such as bicyclists, two-wheelers and, foremost, pedestrians is an important challenge worldwide.
Up-to-date pedestrian protection systems rely on the infrastructure enhancements (improving
roadway lightning, speed limits control, etc.), passive safety systems (design of vehicle body,
pedestrian airbags, etc.) and active safety systems (based on sensors, cameras, etc.) [57].
Radar-based active pedestrian safety systems are a subject of intensive on-going studies [72] due to their following advantages [57]:
• system performance is independent of the weather conditions, time of the day and
illumi-nation intensity of the road;
• availability of the radar sensors on-board of the modern cars (e.g. those used for other driver
assistance systems like parking assistant), which removes the need to install additional radars [64];
• complexity of the signal processing algorithms used in the radar-based systems is typically
significantly lower than the one of video-based systems due to the lower dimension of the data.
Robust real-time algorithm for the classification of objects (normally pedestrians and vehicles) is a key component of radar-based pedestrian protection system [136, 160]. Even though, different sensors could be used for this purpose [57, 58, 92], the main advantage of the radar is a possibility of target parameters estimation like distance, azimuth angle, relative velocity etc. Typically, a decision about presence of targets in front of a vehicle is made by classification system using features extracted from raw data. As a classifier researches propose to use artificial neural networks [131], support vector machine [70], a polynomial classifier [90]. As features for classification a number of different target parameters have been considered: Doppler profile, range profile and radar cross-section [90, 131, 134]. With those features discrimination of pedestrian and vehicle can be performed with a probability above 90% [71, 131]. However, in this study we assume that only Continuous Wave (CW) radar is available, and therefore only Doppler information is available. This scenario put less costs to the radar system and supplemental hardware. This assumption arises because of availability of CW radar for authors only. Typically, vehicles are equipped with Frequency Modulated Continuous Wave (FMCW) radar with allows to estimate range and velocity simultaneously. The proposed classification algorithm can be applied on data from FMCW radar, where objects will be separated on range-Doppler map; with following classification based on velocity profile only.
However, using the radial velocity of the target as the classification feature has several draw-backs:
• a frequency shift of carrier frequency of the target due to the movement of the vehicle, where
the radar sensor is mounted, which can be compensated (for example by interpolation, see Chapter 7) only if the exact speed of this vehicle is known;
• a lateral moving vehicle produces a low radial velocity and can be, therefore, miss-classified
II. Motivation and research objectivities 13
• the wavelength of the radar must be known3 to estimate the radial velocity of the target.
In addition to the desired invariance of the classification method to the radar velocity, one of the ongoing challenges is to design a system with invariant property to the frequency band of the radar sensor [13], since due to the regulations, automotive radars have two different frequency bands: 24 GHz and 77 GHz [72]. Therefore, the objective of this study is to design a pedestrian classification scheme which will be invariant to the frequency band of the radar sensor and the velocity of the radar. Two solutions are presented in Chapter 6.
H) Feature selection
Working with machine learning tasks one can face a situation when a huge amount of features, possibly dependent, is available. Using all features to perform a classification can lead to a high
computational complexity. To tackle this problem, there are two major techniques namelyfeature
extraction and feature selection [80]. These techniques, also called dimensionality reduction, are reducing the amount of used features and, at the same time, are improving the classification
performance. Thedimensionality reductionapproaches can work when class labels of training data
are known (supervised) and when the class labels of training data are not known (unsupervised).
The most popular feature extraction approaches are Principal Component Analysis (PCA), Linear Discriminate Analysis (LDA) and factor analysis. They show a good performance, however, they cannot be used for pinpointing the relevant features for the classification proble
![Figure 1.3: Spectrogram of micro-Doppler signal provoked by walking human. The signal is simulated by software designed in [30] with wavelength λ = 0.02 m.](https://thumb-us.123doks.com/thumbv2/123dok_us/746636.2594382/25.892.331.702.706.974/figure-spectrogram-doppler-provoked-simulated-software-designed-wavelength.webp)