Guide to Using
TopRank
What-If Analysis Add-In for
Microsoft Excel
Version 5.7
September, 2010
Palisade Corporation
798 Cascadilla St
Ithaca, NY 14850
(607) 277-8000
http://www.palisade.com
Copyright Notice
Copyright © 2008, Palisade Corporation
Trademark Acknowledgments
TopRank, BestFit, RISKview and Palisade are registered trademarks of Palisade Corporation
RISK is a trademark of Parker Brothers, Division of Tonka Corporation, and is used under license.
Welcome
Welcome to TopRank, the ultimate What-If tool for spreadsheets from Palisade Corporation. TopRank greatly enhances the standard What-If and data table capabilities found in your spreadsheet. In addition, you can easily step up to powerful risk analysis with its companion package, @RISK.
TopRank helps you find out which spreadsheet value or variable affects your results the most — an automated What-If or sensitivity analysis. You also can have TopRank automatically try any number of values for a variable — a data table — and tell you the results calculated at each value. TopRank also tries all possible combinations of values for a set of variables (a Multi-Way What-If analysis), giving you the results calculated for each combination.
Running a What-If or sensitivity analysis is a key component of making any decision based on a spreadsheet. This analysis identifies which variables affect your results the most. This shows you those factors you should be most concerned with as you 1) gather more data and refine your model and 2) manage and implement the situation described by the model.
TopRank is a spreadsheet add-in for Microsoft Excel. It can be used with any pre-existing or new spreadsheet. To set up your What-If analyses, TopRank adds new custom “Vary” functions to the spreadsheet function set. These functions specify how the values in your spreadsheet can be varied in a What-If analysis; for example, +10% and -10%, +1000 and -500, or according to a table of values you’ve entered.
TopRank can also run a fully automatic What-If analysis. It uses powerful auditing technology to find all possible values in your spreadsheet which could affect your results. It can then change all these possible values automatically and find out which is most significant in determining your results.
TopRank and What-If Analysis
ii
TopRank applications are the same as spreadsheet applications. If you can build your model in a spreadsheet, you can use TopRank to analyze it. Businesses use TopRank to identify the critical factors — price, up front investment amount, sales volume or overhead — that most affect the success of their new product. Engineers use TopRank to show them the individual product components whose quality most affects final product production rates. A loan officer can have
TopRank quickly run his model at all possible interest rate, loan principle amount, and down payment combinations and review results for each possible combination. Whether your application is in business, science, engineering, accounting or other field, TopRank can work for you to identify the critical variables which affect your results.
Modeling Features
As an add-in to Microsoft Excel, TopRank links directly to Excel to add What-If analysis capabilities. The TopRank system provides all the necessary tools for conducting a What-If analysis on any
spreadsheet model. And TopRank works in a style you are familiar with — Excel style menus and functions.
What-If analysis and Data Tables are functions that can be performed directly in your spreadsheet, but only in a manual, unstructured format. Simply changing a cell value in your spreadsheet and calculating a new result is a basic What-If analysis. And a Data Table which gives a result for each combination of two values can also be built in your spreadsheet. TopRank, however, performs these tasks automatically and analyzes their results for you. It instantly performs What-Ifs on all possible values in your spreadsheet which could affect your result, instead of requiring you to individually change values and recalculate. It then tells you what spreadsheet value is most significant in determining your result.
TopRank also runs data table combinations automatically, without requiring you to set up tables in your spreadsheet. Combine more than two variables in its Multi-Way What-If analysis — you can generate combinations of any number of variables — and rank your combinations by their affect on your results. You can perform these sophisticated and automated analyses quickly, as TopRank keeps track of all the values and combinations it tries, and their results, separate from your spreadsheet. By taking an automated approach, TopRank gives you What-If and Multi-Way What-If results almost instantly. Even the least experienced modeler can get powerful analysis results.
TopRank Applications
Multi-Way What-If Analysis
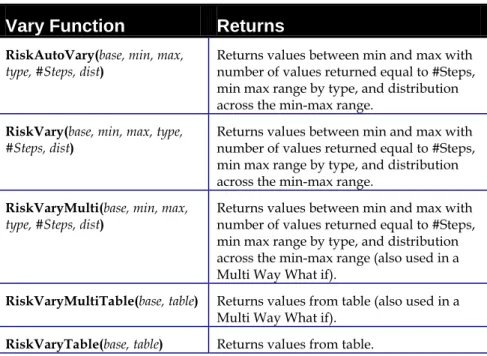
TopRank defines variations in spreadsheet values using functions. To do this, TopRank has added a set of new functions to the Excel function set, each of which specifies a type of variation for your values. These functions include:
• Vary and AutoVary functions which, during a What-If analysis, change a spreadsheet value across a + and - range you define.
• VaryTable functions which, during a What-If analysis, substitute each of a table of values for a spreadsheet value. TopRank uses functions to change spreadsheet values during a What-If analysis and keeps track of the results calculated for each value change. These results are then ranked by the amount of change from the original expected results. Then functions which caused the greatest change are identified as the most critical to the model. TopRank Industrial also includes 35 probability distribution functions found in @RISK. These functions can be used along with Vary functions to describe variation in spreadsheet values.
TopRank functions are entered wherever you want to try different values in a What-If analysis. The functions can be added to any number of cells in a spreadsheet and can include arguments which are cell references and expressions — providing extreme flexibility in defining variation in value in spreadsheet models.
In addition to adding Vary functions yourself, TopRank can
automatically enter Vary functions for you. Use this powerful feature to quickly analyze your spreadsheets without manually identifying values to vary and typing in functions.
When automatically entering Vary functions, TopRank traces back through your spreadsheet and finds all possible values which could affect the result cell you identify. As it finds a possible value, it substitutes in an “AutoVary” function with the default variation parameters (such as +10% and -10%) you’ve selected. With a set of AutoVary functions inserted, TopRank can then run its What-If analysis and rank the values which could affect your results by their importance.
With TopRank, you can step through your Vary and AutoVary functions and change the variation each function specifies. As a default you can use a -10% and +10% variation, but for a certain value you may feel that a -20% and +30% change is possible. You can also select to not have a value varied — as in some cases a spreadsheet value is fixed and could never be changed.
TopRank Functions How are TopRank Functions Entered? Automated What-Ifs
iv
During its analysis TopRank individually changes values for each Vary function and recalculates your spreadsheet using each new value. Each time it recalculates, it collects the new value calculated in each result cell. This process of changing values and recalculating is repeated for each Vary and VaryTable function. The number of recalculations performed depends on the number of Vary functions entered, the number of steps (i.e., values across the min-max range) you want TopRank to try for each function, the number of VaryTable functions entered, and the values in each table used.
TopRank ranks all varied values by their impact on each result cell or output you’ve selected. Impact is defined as the amount of change in the output value that was calculated when the input value was changed. If, for example, the result of your spreadsheet model was 100 prior to changing values, and the result was 150 when an input changed, there is a +50% change in results caused by changing the input.
TopRank results can be viewed graphically in a Tornado, Spider or Sensitivity graph. These graphs summarize your results to easily show the most important inputs for your results.
Running a What-If Analysis
TopRank Results
Table of Contents
Chapter 1: Getting Started 1
Introduction ...3
Installation Instructions ...7
Software Activation ...9
On-line Tutorial ...11
Using TopRank ...12
Chapter 2: Overview of What-If Analysis 13 Introduction ...15
Running a What-If Analysis ...17
Multi-Way What-If Analysis...21
What-If Analysis and Risk Analysis...25
Chapter 3: Overview of TopRank 31 Introduction ...33
What is What-If Analysis?...35
Running a What-If Analysis in TopRank ...41
What is Multi-Way What-If Analysis?...47
vi
Chapter 4: TopRank Modeling Techniques 53
Modeling Critical Factors in Profitability ... 55
Using the VaryTable Function ... 57
Multi-Way What-If Analysis ... 59
Modeling with @RISK Functions... 61
TopRank Reference Guide 63 Introduction ... 65
Reference: TopRank Icons... 67
Reference: TopRank Add-In Commands 69 Introduction ... 69
Model Menu... 71
What-If Analysis Menu ... 91
Report Settings Command... 109
Swap Functions Command ... 115
Utilities Commands... 121
Help Commands ... 123
Reference: TopRank Functions 125 Introduction to TopRank Functions ... 125
TopRank Function Reference ... 129
Listing of TopRank Functions ... 131
Listing: Property Functions ... 133
Listing: Output Function ... 135
Appendix A: Using TopRank With Other DecisionTools® 139
The DecisionTools Suite ...139
Palisade’s DecisionTools Case Study...142
Introduction to TopRank®...144
Using @RISK with TopRank...148
Introduction to PrecisionTree™...152
Using @RISK with PrecisionTree ...156
Appendix B: Recommended Readings 160
Appendix C: Glossary of Terms 162
Chapter 1: Getting Started
Introduction ...3
Checking Your Package ...3
About This Version ...3
Working with your Operating Environment...4
If You Need Help ...4
TopRank System Requirements ...6
Installation Instructions ...7
General Installation Instructions...7
The DecisionTools Suite ...7
Setting Up the TopRank Icons or Shortcuts ...8
Macro Security Warning Message on Startup ...8
Software Activation ...9
On-line Tutorial ...11
Using TopRank ...12
Introduction
This introduction describes the contents of the TopRank package and shows how to install TopRank and attach it to your copy of Microsoft Excel.
Checking Your Package
Your TopRank package should contain:• The TopRank User's Manual (this book) with: • Preface and Getting Started
• Overview of What-If Analysis • Overview of TopRank
• TopRank Modeling Techniques • TopRank Command Reference • TopRank Function Reference • Technical Appendices The TopRank CD including:
• TopRank System Files • TopRank Example Files • TopRank Tutorial
The TopRank Licensing Agreement and User Registration Card If your package is not complete, please call your dealer or supplier or contact Palisade Corporation directly at (607) 277-8000.
About This Version
This version of TopRank can be installed with Microsoft Excel 2000 or higher.
4 Introduction
Working with your Operating Environment
This User’s Guide assumes that you have a general knowledge of the Windows operating system and Excel. In particular:
• You are familiar with your computer and using the mouse. • You are familiar with terms such as icons, click, double-click,
menu, window, command and object.
• You understand basic concepts such as directory structures and file naming.
If You Need Help
Technical support is provided free of charge for all registered users of TopRank with a current maintenance plan, or is available on a per incident charge. To ensure that you are a registered user of TopRank, please register online at www.palisade.com/support/register.asp. If you contact us by telephone, please have your serial number and User’s Guide ready. We can offer better technical support if you are in front of your computer and ready to work.
Before contacting technical support, please review the following checklist:
• Have you referred to the on-line help?
• Have you checked this User's Guide and reviewed the on-line
multimedia tutorial?
• Have you read the README file? It contains current information on
TopRank that may not be included in the manual.
• Can you duplicate the problem consistently? Can you duplicate the
problem on a different computer or with a different model?
• Have you looked at our site on the World Wide Web? It can be found
at http://www.palisade.com. Our Web site also contains the latest FAQ (a searchable database of tech support questions and answers) and TopRank patches in our Technical Support section. We recommend visiting our Web site regularly for all the latest information on TopRank and other Palisade software. Before Calling
Palisade Corporation welcomes your questions, comments or suggestions regarding TopRank. Contact our technical support staff using any of the following methods:
• Email us at [email protected]
• Telephone us at (607) 277-8000 any weekday from 9:00 AM to 5:00
PM, EST. Follow the prompt to reach Technical Support
• Fax us at (607) 277-8001.
• Mail us a letter to:
Technical Support Palisade Corporation 798 Cascadilla St Ithaca, NY 14850 USA
If you want to contact Palisade Europe:
• Email us at [email protected]
• Telephone us at +44 1895 425050(UK).
• Fax us at +44 1895 425051 (UK).
• Mail us a letter to:
Palisade Europe 31 The Green West Drayton Middlesex UB7 7PN United Kingdom
If you want to contact Palisade Asia-Pacific:
• Email us at [email protected]
• Telephone us at + 61 2 9252 5922 (AU).
• Fax us at + 61 2 9252 2820 (AU).
• Mail us a letter to:
Palisade Asia-Pacific Pty Limited Suite 404, Level 4
20 Loftus Street Sydney NSW 2000 Australia
Regardless of how you contact us, please include the product name, exact version and serial number. The exact version can be found by selecting the Help About command on the TopRank menu in Excel. Contacting
6 Introduction Telephone support is not available with the student version of
TopRank. If you need help, we recommend the following alternatives:
• Consult with your professor or teaching assistant.
• Log-on to http://www.palisade.com for answers to frequently asked
questions.
• Contact our technical support department via e-mail or fax.
TopRank System Requirements
System requirements for TopRank 5.0 for Microsoft Excel for Windows include:
• Pentium PC or faster with a hard disk.
• Microsoft Windows 2000 SP4, Windows XP or higher.
• Microsoft Excel 2000 or higher.
Student Versions
Installation Instructions
General Installation Instructions
The Setup program copies the TopRank system files into a directory you specify on your hard disk. To run the Setup program in Windows 2000 or higher:
1) Insert the TopRank CD-ROM in your CD-ROM drive
2) Click the Start button, click Settings and then click Control Panel
3) Double-click the Add/Remove Programs icon
4) On the Install/Uninstall tab, click the Install button
5) Follow the Setup instructions on the screen
If you encounter problems while installing TopRank, verify that there is adequate space on the drive to which you’re trying to install. After you’ve freed up adequate space, try rerunning the installation. If you wish to remove TopRank from your computer, use the Control Panel’s Add/Remove Programs utility and select the entry for TopRank.
The DecisionTools Suite
TopRank for Excel is a member of the DecisionTools Suite, a set of products for risk and decision analysis described in Appendix A:
Using TopRank With Other DecisionTools. The default installation procedure of TopRank puts TopRank in a subdirectory of a main “Program Files\Palisade” directory. This is quite similar to how Excel is often installed into a subdirectory of a “Microsoft Office” directory. One subdirectory of the Program Files\Palisade directory will be the TopRank directory (by default called TOPRANK5). This directory contains the program files plus example models and other files necessary for TopRank to run. Another subdirectory of Program Files\Palisade is the SYSTEM directory which contains files which are needed by every program in the DecisionTools Suite, including common help files and program libraries.
Removing TopRank from Your Computer
8 Installation Instructions
Setting Up the TopRank Icons or Shortcuts
The TopRank setup program automatically creates a TopRank
command in the Programs menu of the Taskbar. However, if problems are encountered during Setup, or if you wish to do this manually another time, follow these directions.
1) Click the Start button, and then point to Settings.
2) Click Taskbar, and then click the Start Menu Programs tab.
3) Click Add, and then click Browse.
4) Locate the file TOPRANK.EXE and double click it.
5) Click Next, and then double-click the menu on which you want the
program to appear.
6) Type the name “TopRank”, and then click Finish.
Macro Security Warning Message on Startup
Microsoft Office provides several security settings (underTools>Macro>Security) to keep unwanted or malicious macros from being run in Office applications. A warning message appears each time you attempt to load a file with macros, unless you use the lowest security setting. To keep this message from appearing every time you run a Palisade add-in, Palisade digitally signs their add-in files. Thus, once you have specified Palisade Corporation as a trusted source, you can open any Palisade add-in without warning messages. To do this:
• Click Always trust macros from this source when a Security Warning dialog (such as the one below) is displayed when starting TopRank.
Software Activation
Activation is a one-time license verification process that is required in order for your TopRank software to run as a fully licensed product. An activation code is on your printed/emailed invoice and may resemble a dash separated sequence like "19a0-c7c1-15ef-1be0-4d7f-cd". If you enter your Activation code during installation, then your software is activated the first time the software is run and no further user action is required. If you wish to activate your software after installation, select the TopRank Help menu License Activation command and enter your activation code in the displayed Palisade License Activation dialog box.
1) What if my software is not activated?
If you do not enter an activation code during installation or you are installing a trial version, your software will run as a trial version with time and/or number of uses limitations and must be activated with an activation code in order to run as a fully licensed product.
2) How long can I use the product before I have to activate it? Software that is not activated may be run for fifteen days. All of the product's features are present, but the License Activation dialog will appear each time the program is launched to remind you to activate and to indicate the time remaining. If the 15 day trial period expires, the software will require activation in order to run.
Frequently Asked Questions
10 Software Activation
3) How do I check my activation status?
The License Activation dialog box is viewed through the TopRank Help menu License Activation command. Activated software shows a status of Activated and trial version software shows a status of Not Activated. If the software is not activated, the remaining time that the software is allowed to run is displayed.
4) How do I activate my software?
If you do not have an activation code you may obtain one by clicking the Puchase button in the License Activation dialog. An online purchase will be immediately given an activation code and an optional link to download the installer should reinstallation become necessary. To purchase by phone call the local Palisade office given in the
Contacting Palisade section of this chapter.
Activation may be done over the Internet or via email: • Activation if you have Internet Access
In the Palisade License Activation dialog box, type or paste the
activation code and press "Automatic via Internet". A success message should appear after a few seconds and the License Activation dialog box will reflect the software's activated status.
• Activation if you do not have Internet Access Automated activation by email requires a few steps:
1. Click "Manual via Email" to display the request.xml file which you may save to disk or copy to the Windows clipboard. (It is recommended you note the location on your computer of the request.xml file.)
2. Copy or attach the XML file to an email and send it to
[email protected]. You should receive an automatic
response to the return address in your email shortly. 3. Save the response.xml attachment in the response email to
your hard drive.
4. Click on the Process button that is now in the Palisade License Activation dialog box and navigate to the response.xml file. Select the file and click OK.
A success message should appear and the License Activation dialog will reflect the software's activated status.
5) How do I transfer my software license to another machine? Transfer of a license, or rehosting, may be peformed through the Palisade License Activation dialog box as a two step procedure:
deactivation on the first machine and activation on the second machine.
A typical use of rehosting is to transfer your copy of TopRank from your office PC to your laptop. To rehost a license from Machine1 to
Machine2, make sure both machines have the software installed and are
connected to the Internet during the deactivation/activation rehosting.
1. On Machine1, click deactivate Automatic via Internet in the
License Activation dialog. Wait for the success message.
2. On Machine2, click activate Automatic via Internet. Wait for
the success message.
If the machines do not have Internet access then you may follow the similar instructions above for rehosting by the automated email process. 6) I have Internet Access but I am still unable to Activate/Deactivate automatically.
Your firewall must be set to allow TCP access to the licensing server. For single user (non network installations) ths is
http://service.palisade.com:8888 (TCP port 8888 on http://service.palisade.com).
On-line Tutorial
In the on-line tutorial, TopRank experts guide you through sample models in movie format. This tutorial is a multi-media presentation on the main features of TopRank.
The tutorial can be run by selecting the TopRank Help Menu Getting Started Tutorial command.
12 Using TopRank
Using TopRank
To use TopRank in a normal Excel session:
1) Click the TopRank icon in the Windows Start Programs Palisade DecisionTools group.
2) Use the Excel Open command to open the example spreadsheet FACTORY.XLS. The default location for the examples is C:\PROGRAM
FILES\PALISADE\TOPRANK5\EXAMPLES.
3) Click the Add AutoVary Functions icon, the second one on the toolbar.
4) Click the Model Window icon on the TopRank Toolbar — the one on the Toolbar with the red and blue arrow. The Model Window list, listing the Vary functions in the FACTORY worksheet along with your output cells is displayed.
5) Click the Run What-if Analysis icon — the one with the red tornado graph. You've just started a what-if analysis for the FACTORYworksheet. The what-if analysis is underway. When it is complete, your what-if analysis results will be displayed.
Chapter 2: Overview of What-If
Analysis
Introduction ...15 What is What-If?...15 Better Decisions With What-If Analysis ...15 What-If Analysis and the Computer ...16 Running a What-If Analysis ...17 Results from What-If Analyses ...17 Graphs of What-If Results ...18 Multi-Way What-If Analysis...21 Multi-Way What-If Analysis Results...22 What-If Analysis and Risk Analysis...25 Sensitivity Analysis Using Risk Analysis...26 Sensitivity Analyses in @RISK vs. TopRank ...27 Why What-If First?...28 Conclusions...29
Introduction
Have you ever wondered which factors matter most in your decision? If so, you need What-If or sensitivity analysis, which measures the impact on results of changing an uncertain variable across its possible values. Change an assumption you’ve made in your model and see how it affects results. This is a simple What-If analysis, and it is a familiar activity to many.
What is What-If?
What-If analysis can be used for almost any type of model and is often done with a spreadsheet on a PC. A business person, for example, might use a spreadsheet to combine the uncertain variablessales price, sales volume, production costs and investment amount to calculate the results they’re interested in —profits. By individually varying each uncertain variable, they can see how changes affect profits. And by ranking the impacts of each variable on profits, the What-If analysis shows which is most important.
Better Decisions With What-If Analysis
By examining the impact of reasonable changes in base-caseassumptions, What-If analysis determines which variables have little impact on outcomes and which are significant. This perspective on what’s important can help structure the decision under consideration. You can concentrate your attention on those critical factors and how changes in them affects the results of your decision.
What-If analysis is a critical component of the decision modeling process. Typically, first, the spreadsheet model is built. Then, What-If analysis identifies the critical components of the model. Additional data is then gathered on these critical variables and the model is refined. Ultimately, a decision is made using a robust model in which all important issues are identified.
What-If analysis also aids in planning operations and contingencies. Once a decision has been made to “go” based on your model, your What-If analysis has already identified what affects outcomes the most and what’s insignificant. This helps you plan by showing where you should prepare the most to guard against changes, and where you don’t need to worry if changes occur.
What-If Analysis and Planning
16 Introduction Perhaps, for example, your What-If analysis identified labor costs as the critical factor affecting the profitability of a new assembly plant. Because of your What-If analysis results, you’ll spend more time insuring that there’s a solid, long-term labor contract in place.
What-If Analysis and the Computer
The spreadsheet was revolutionary in bringing the benefits of What-If modeling to a broad spectrum of users. A simple What-If analysis can be accomplished with any spreadsheet model by changing a value and recalculating. Instantly you see the effect of the change on your results — a single What-If calculation. Usually, a couple more What-Ifs are tried manually — maybe a best case and a worst case — and the results are noted and reported.
More ambitious spreadsheet users often run a set of What-Ifs, each on different input values, manually tracking their effects on results. They then compare the impacts on results from each change and identify the most critical variables in their model.
TopRank brings an automated and rigorous approach to What-If analysis on spreadsheets. Instead of requiring you to manually change a set of input values, TopRank automatically changes any or all inputs in you spreadsheet, tracks all results calculated, and ranks them according to their impacts. TopRank also graphs your results for easy presentation.
TopRank greatly speeds What-If modeling and provides a thorough analysis of a greater number of input values. Instead of being limited to a manual testing of five or ten What-If calculations, TopRank can quickly process hundreds or thousands of What-If calculations. Automated
What-Ifs with TopRank
Running a What-If Analysis
A What-If analysis in an iterative process. One by one, each
spreadsheet variable (in TopRank, called an input) is changed to a new possible value and the spreadsheet is recalculated. A new result is generated and recorded, the input is reset to its original value and the next input is changed. At the end of the analysis, a set of data is created, containing various possible input values and the results associated with each.
Results from What-If Analyses
The results of a What-If analysis include tables ranking inputs by their effects on results and graphs which summarize those rankings. A typical ranking as produced by TopRank shows the most important inputs at the top of the list, with the maximum and minimum output value caused by each input shown.
18 Running a What-If Analysis
Graphs of What-If Results
Graphs are also important for both displaying the relative ranking of one input versus another (using a tornado graph and a spider graph) or displaying the impact of an individual input on results ( a sensitivity graph).
A tornado graph compares the effects of all inputs on results. For each input (listed on the Y-Axis), the length of the bar drawn indicates the amount of change the input caused on results. As the input with largest effects (and longest bar) is shown at the top and those with less impact below, the graph often takes the shape of a tornado.
The tornado graph brings attention to the inputs that require further attention (those plotted on the top of the graph). The tornado summarizes the impact of an almost unlimited number of inputs in a neat, simple graph.
A spider graph also compares the effects of multiple inputs on results. For each input, the percentage change in its value from the base case is plotted on the X-Axis and the percentage change in results is plotted on the Y-Axis. As inputs have different impacts on results, the graph often resembles a spider.
20 Running a What-If Analysis The effects of an individual input on results can be plotted with a standard line graph. The value of the selected input is plotted on the X-Axis and the value of results is plotted on the Y-X-Axis. This simple X-Y plot clearly illustrates how results change in conjunction with changes in the underlying input. The graph also shows if changes are constant or linear, or if results start to change more dramatically with increases in input value.
Sensitivity Graphs
Multi-Way What-If Analysis
There are many cases when you may want to see the impacts of
combinations of changes in two or more inputs on results. This is called a Multi-Way What-If analysis. Multi-Way What-If analyses vary inputs at the same time and calculate the effect of each combination of input values on results.
Multi-Way What-If analyses deal with the problem that inputs, in real life, do not vary one at a time as is assumed by the standard one-way What-If. At the same time, one input can differ positively from what was expected, while a second can differ negatively. Inputs can also vary jointly, as a rise in one (such as rainfall) often is accompanied by a rise in a second (such as crop yield).
As with the standard one-way What-If analysis, spreadsheet users often conduct Multi-Way What-If analyses manually. Each of several inputs can be changed to their maximum possible value at the same time, calculating an optimistic scenario for results. Conversely, the inputs then can be changed to their minimum possible values, creating a pessimistic scenario.
Calculating more than a small number of Multi-Way combinations manually with a spreadsheet becomes very cumbersome. TopRank automates Multi-Way What-If analyses, trying all possible
combinations of inputs you select, tracking results calculated at each combination, and ranking them according to their impact on results. A Multi-Way What-If analysis can include 1)a varying number of total inputs and 2) a varying number inputs used in each combination. For example, you might have four inputs — price, sales volume, production costs, and investment — and you want to see the impacts of every combination of two inputs on your result,profit. Your analysis might tell you that price and sales volume varying together are the most significant combination affecting your result —profit.
Changing More Than One Input
Critical Combinations
22 Multi-Way What-If Analysis
Multi-Way What-If Analysis Results
As with one-way What-If analyses, Multi-Way What-If analysis results can be displayed in tables and graphs. A table lists the combinations of inputs that were tested and the corresponding result that was
The combinations that have the most impact on results can be displayed with a tornado graph, just as are one-way What-If analysis results. When a tornado graph is used with Multi-Way results, each bar represents the changes in results caused by a combination of two or more inputs.
Multi-Way Tornado Graph in TopRank
What-If Analysis and Risk Analysis
What-If analysis is often the first analysis performed on a spreadsheet. Its results then lead to a further refinement of the model, additional analyses and ultimately, a final decision based on the best model possible. Risk analysis, a powerful analytical technique available using TopRank’s companion product, @RISK, is often the next analysis performed on a spreadsheet after a What-If analysis.
What-If analyses initially identify what’s important in your model. You can then focus on these important components to better estimate what their values could be. Usually, however, there are several or more of these important uncertain components, and, in reality, they could all vary at the same time. To analyze an uncertain model such as this you need risk analysis or Monte Carlo simulation. Risk analysis varies all uncertain inputs simultaneously — just as they do in real life — and builds a range and distribution of the possible results that could occur. With risk analysis, inputs are described with a probability distribution — such as normal, lognormal, beta or binomial. This is a much more detailed description of the uncertainty present in an input’s value than a simple + or - percentage variation. A probability distribution shows both the range of values possible for an input and the likelihood of occurrence of any value in the range. Simulation combines these input distributions to generate both a range of possible results from your model and the likelihood of any result occurring.
The simple + and - change which defines the inputs to a What-If analysis can be refined to create the probability distributions needed in a risk analysis. TopRank's What-If inputs automatically can be directly used in a risk analysis using @RISK.
Moving from What-If to Simulation Using What-If Definitions in a Risk Analysis
26 What-If Analysis and Risk Analysis
Sensitivity Analysis Using Risk Analysis
Sensitivity analysis can be conducted on the data generated by a risk analysis to identify the most critical inputs which affect results. This is often accomplished using correlation and/or regression analysis of the data sets generated by the simulation. This is a robust and highly refined form of sensitivity analysis as it uses as its basis the simulation data where all inputs were changed simultaneously. In many cases it may just affirm the results of your initial What-If analysis, but there are times when there may be a difference in the results. Assuming the simulation model is properly specified, the sensitivity analysis results from the simulation are the ones you should use.
A What-If analysis can also be performed on the probabilities used in a risk analysis. In this form of What-If analysis, probabilities or input distribution parameters are changed by simulation. One simulation is executed with one set of probabilities, then a second is executed on the same model with different probabilities and so on. The results of each simulation are then compared to identify the impact of changing probabilities.
@RISK has the capability to run multiple simulations, one after another, and change values by simulation. It then automatically compares results from each of the multiple simulations. TopRank also can run multiple What-If analyses, one after another, and change input
variations by run. You can then compare the results from each What-If analysis and see how changes in assumptions affect your results. Sensitivities to
Probabilities in a Risk Analysis
Sensitivity Analyses in @RISK vs. TopRank
For a simple What-If calculation, TopRank determines how a single input affects the output by only changing the value of the input. The values of all other inputs in the model remain constant. This method is called single variable sensitivity analysis.The advantages of a TopRank sensitivity analysis is that it is quick and easy. TopRank can automate the whole process of finding and defining inputs, and it only needs to run a few iterations to get meaningful results. And, TopRank gives you answers in an easy to understand format. The spider graph tells exactly how much a given % change in an input affects the output.
The disadvantage of a TopRank sensitivity analysis is that is does not take the variability of other inputs into account. The Multi-Way sensitivity analysis can compensate for this weakness to an extent, but does not always find cross-correlation between input variables. In an @RISK simulation, the value of each input changes
simultaneously. Data is collected for both the inputs and the output, and the sensitivity is calculated using a rank order correlation coefficient or via linear regression.
The disadvantages of an @RISK sensitivity analysis is that it requires a large number of iterations and you must use uncertainty distributions in your model. And, while the results tell you which variables have the greatest effect, they do not tell you how much a given % change in an input affects the output.
The advantage of an @RISK sensitivity analysis is that it does not require an extra set of calculations if you are going to run an @RISK simulation anyway. And, any cross-correlation between inputs is always reported in the results.
We recommend using TopRank and @RISK in most instances. TopRank is quick and easy, and present results in an easy-to-interpret form. Use TopRank before using @RISK to save time and effort.
TopRank
28 What-If Analysis and Risk Analysis
Why What-If First?
Risk analysis is a more robust and comprehensive analytical technique when compared with What-If analysis as it varies all inputs
simultaneously. It also accounts more explicitly for interrelationships among inputs in the results it generates. And with its own form of sensitivity analysis, it identifies the most important inputs which affect your results. But, even with all this, why is What-If analysis so popular and why should it still be used in conjunction with risk analysis?
• It’s Easy. There’s no doubt about it — a What-If analysis is easy. From the simple, manual What-If performed by most every spreadsheet user to the automated, extensive What-If processing of TopRank, a What-If analysis can be performed quickly and easily. Describing your inputs in terms of a possible + and - change is easier and more understandable for many when compared with the probability distributions required by risk analysis
• It Saves Time for a Subsequent Risk Analysis. Quickly identifying the most critical inputs with What-If analysis saves time when developing a risk analysis model. You can then concentrate your efforts in defining probability distributions to those most important inputs. Describing the range and shape of a probability distribution can be time-consuming and it’s easier if you can focus on a more limited set of inputs. • Its Results Are Understandable and Accessible to All.
Decision makers are all comfortable with the concept of a What-If analysis. “What’s most important” and “what happens if this factor increases in value” are common questions asked during the decision making process. Some decision makers, however, have trouble with the concepts of probabilities, simulation and distributions of possible outcomes. They’re naively afraid of the “black box” that has executed their simulation and don’t trust the results of the more complex technique.
• For Some Analyses, There’s Just Not Enough Time for Risk Analysis. Many decision makers deal with reams and reams of models — some more critical, some less. They just don’t have the time to build a simulation model for all cases. A quick What-If, however, gives them needed information in little time for those less important decisions.
Conclusions
What-If analysis is a powerful technique that has gained great popularity with the advent of the spreadsheet and the personal
computer. Whether in its one-way or Multi-Way form, What-If analysis can provide important guidance for refining a model and implementing a decision. It shows you what’s important and where to focus — important guidance for any decision maker. And it also provides a stepping stone to the powerful technique of risk analysis or Monte Carlo simulation.
Chapter 3: Overview of TopRank
Introduction ...33 Definition of Terms...33 What is What-If Analysis?...35 Defining a What-If Input ...35 Letting TopRank Define What-If Variables...36 Steps and Distribution...38 Adding Inputs by Cell ...39 Looking at All Inputs and Outputs in Open Workbooks ...40 Running a What-If Analysis in TopRank ...41 Results from a What-If Analysis...42 Graphical Results from a One-Way What-If Analysis...43 Tornado Graphs ...43 Spider Graphs...44 Sensitivity Graphs ...45 What is Multi-Way What-If Analysis?...47 Defining Multi-Way What-If Inputs...48 Running a Multi-Way What-If Analysis in TopRank ...49 Results from a Multi-Way What-If Analysis ...50 Graphical Results from a Multi-Way What-If Analysis...52
Introduction
TopRank is a spreadsheet add-in for Microsoft Excel. It can be used for What-If analysis on any pre-existing or new spreadsheet. To set up your What-If analyses, TopRank adds new custom “Vary” functions to the spreadsheet function set. These functions specify how the values in your spreadsheet can be varied in a What-If analysis; for example, +10% and -10%, +1000 and -500, or according to a table of values you’ve entered.
TopRank can also run a fully automatic What-If analysis. It uses powerful auditing technology to find all possible values in your
spreadsheet which could affect your results. It can then change all these possible values automatically and find out which is most significant in determining your results.
Definition of Terms
Before getting into the details of What-If analysis with TopRank, you should understand some of the special terms used in this chapter:
• An input is a constant value used in a cell or formula in your spreadsheet model that affects your results
• An output is a cell on which you want to run a What-If analysis that contains the result of spreadsheet calculations
• The base case of an input is the number you entered in the spreadsheet when you first designed the model (usually the most likely value)
• The minimum change is the possible downside or negative change you think an input can reasonably have
• The maximum change is the possible upside or positive change you think an input can reasonably have
• Steps are the number of values across an input’s minimum-maximum range to be used in a What-If analysis
• Distribution is a probability distribution type which shows the likelihood of a value in an input’s minimum-maximum range occurring (e.g. a normal distribution)
• What-If Table is a table of values to be substituted for an input in a What-If analysis
34 Introduction • Vary and VaryTable are functions used by TopRank to describe
the base case, minimum change, maximum change, steps, distribution and What-If table for an input
• Multi-Way What-If analysis varies two or more inputs at the same time and reports results for all combinations of inputs • VaryMulti and VaryMultiTable are functions used by
TopRank to identify inputs which are to be included in a Multi-Way What-If analysis
What is What-If Analysis?
TopRank can conduct one-way and Multi-Way What-If analyses on any spreadsheet model. TopRank performs these analyses by 1) adding a new set of functions to the spreadsheet function set and 2) providing capabilities to conduct What-If analyses on spreadsheets and calculate and graph the results of these analyses.
One-Way What-If analysis studies the effect of changes in individual input variables on the output values of a spreadsheet. Each input is changed individually while holding all others at their base case value. In TopRank, a one-way What-If analysis is conducted on all input variables identified using Vary functions. A Vary function is a custom function added to the Excel spreadsheet function set by TopRank.
Defining a What-If Input
Inputs to be changed in a one-way What-If analysis can be identified individually by the user or automatically by TopRank. At a minimum, each variable is defined by three values — its base value (the one originally present in the spreadsheet), its possible downside (negative) change, and its possible upside (positive) change. Negative and positive change is typically entered as a percentage, such as -10% or +20%. As an option, you can also enter an actual change (such as -1000 or +950) or an actual minimum and maximum (such as 100 or 200). In TopRank, base, minimum change, and maximum change for an input are entered in Vary functions, such as:
• RiskVary(100,-10,+10), indicating a base case of 100 and a possible -10% and +10% change
• RiskVary(50,-45,+10), indicating an expected value of 50 and a possible -45% and +10% change
During a normal spreadsheet calculations, Vary functions return their base case or expected value. For the functions shown above, the values returned are 100 and 50. These are also the values entered in the cell before the Vary function was added. By returning their expected value, Vary functions do not affect the normal results of your spreadsheet (when TopRank is not in use).
As with standard spreadsheet functions, Vary functions can be used by themselves in a cell or as part of a formula. Multiple Vary functions can be present in a cell and Vary functions can be arguments to other functions.
One-Way What-If Analysis
36 What is What-If Analysis? If there is a table of possible values you want to try for an input, the VaryTable function is used. With VaryTable you simply enter a base value and a reference to the location in the spreadsheet that contains your table of values. Alternatively, you can also enter the table of values directly in the function itself. Typical VaryTable functions are:
• RiskVaryTable(100,G1:G50), where 50 values located in the range G1:G50 are successively returned by the VaryTable function during the What-If analysis and new output values calculated for each
• RiskVaryTable(50,{40,42.5,48,52,58}), where five different values — 40 through 58 — are successively returned by the VaryTable function during the What-If analysis and new output values calculated for each
Letting TopRank Define What-If Variables
Vary and VaryTable functions can be entered directly in your spreadsheet by you, just as are any standard spreadsheet functions. TopRank, however, also includes a powerful automatic mode where Vary functions are automatically inserted in your spreadsheet for all input variables which could affect each output you select.As an option, TopRank can automatically search your spreadsheet for all values in cells and formulas which could affect your output’s value. These values are numeric constants — such as 1000, 10.5 or 99 — entered in the spreadsheet cells and formulas that combine to calculate an output. TopRank identifies inputs either when you start an analysis or when you add an output.
Inputs can be found in the formulas and values which are entered into spreadsheet cells. Through the use of cell references, formulas use the results of calculations in other cells, with subsequent formulas
referencing those intermediate cells. Ultimately this chain of formulas leads to a result calculated in an output cell. Within this “tree” of formulas, any value — either alone in a cell, such as 100, or embedded in a formula, such as the 1.1 value in the formula = (1.1 * A2) +A3 — is a possible input variable which could affect the output. This is because only values — not cell references — can be changed in a TopRank What-If analysis (i.e., you can't change cell references without changing the structure of the model).
When TopRank automatically identifies inputs for you, it finds all possible values in cells and formulas which could be changed to affect the output selected. To do this, TopRank searches through the formulas in the spreadsheet, tracing back from the output cell through the
dependent cells and formulas. In each identified formula, it finds input VaryTable
Functions
Identifying Inputs in Formulas
values based on identification criteria you specify. For example, you can have TopRank find any possible input value, anywhere in a cell's formula or functions, or cause it to restrict its search to only values which are by themselves in a cell's formula. This keeps the list of identified inputs more manageable when desired.
After TopRank has identified inputs you, of course, can remove them from your inputs list or lock them, so they won't be changed in an analysis. You can do this if a value was identified by TopRank as a possible input, but, given your knowledge of the model, it could never be changed — it's a fixed value and changing it is nonsensical.
When TopRank defines inputs for you, it automatically inserts an AutoVary function for each constant it finds that could affect your output. These AutoVary functions use a default +/- variation that you select — such as -20% and +20%. For example, TopRank can enter:
• AutoVary(50,-10,+10), indicating an expected value of 50 and a possible -10% and +10% change. This is the equivalent to the function Vary(50,-10,+10); the “Auto” just identifies it as a function automatically entered by TopRank
By using this automatic mode you can quickly analyze a spreadsheet prior to making more detailed Vary function entries. In as little as two mouse clicks you’ve generated valuable What-If results. In addition, with the automatic mode important What-If results can be gathered by users who have little or no training in analytical techniques.
At any time, AutoVary functions can be removed from your spreadsheet by TopRank, restoring it to its original condition. Note: An AutoVary function is simply a Vary function that was automatically added to your spreadsheet by TopRank.
AutoVary Functions
38 What is What-If Analysis?
Steps and Distribution
The number of values tried for each input and their magnitude is given by the #Steps and distribution setting for each Vary function. These entries further customize the values used for each input during your What-If analyses.
A differing number of possible values can be returned for each Vary function. For each value returned, TopRank recalculates the worksheet and stores a new possible result. The number of values returned is given by the #Steps argument to the Vary function or a default number of steps.
In the function’s simplest form — such as Vary(100,-10,+10) — there is no entry in the function for the #Steps. In this case TopRank uses the default #Steps. A typical default is four or five steps. With four steps TopRank calculates the spreadsheet at the minimum possible value for the Vary function, the maximum possible value, and two values equally spaced in between. If you enter a #Steps value in the Vary function, such as Vary(100,-10,+10,,8), TopRank overrides the default #Steps and, in this case, returns eight different values for the Vary function. If a table of values is entered using the VaryTable function, such as VaryTable(100,G1:G100), TopRank calculates spreadsheet results for each of the values entered in the table, whether ten, one hundred or thousands of values.
The actual values returned by TopRank for each step for each Vary function depend on the Distribution argument to the Vary function or the default distribution setting. The distribution selected describes how values are distributed across the minimum-maximum range of the function. For example, if the Uniform distribution is selected — such as Vary(100,-10,+10,,,“Uniform”) — any value in the minimum-maximum range described by the Vary function is equally likely to occur.
Four distribution types are available with TopRank. They are:
• Uniform
• Triangular
• Tri1090
• Normal
Number of Steps for Vary Functions
Distribution Across a Vary Function’s Range
TopRank steps across the min-max range defined by the Vary function by using a distribution’s percentiles. Any probability distribution can be divided into 100 segments of equal probability. At the 20th segment or percentile there is a 20% chance of a lower value and a 80% chance of a higher value occurring. TopRank always returns the 0% percentile (minimum) and the 100% percentile (maximum) — a minimum of two steps for each Vary function (except for unbounded distributions such as the Normal, where TopRank returns the 5% and 95% percentile instead). Additional steps are spread equally on a percentile basis across the min-max range. If you ask for five steps, for example, TopRank returns values for the minimum and maximum, plus the 25%, 50% and 75% percentiles — a total of five values returned, 5
recalculations and 5 new results generated.
Adding Inputs by Cell
TopRank makes it easy to look at values in your spreadsheet and add, change, update or remove Vary and VaryTable functions associated with your inputs.
When the Add Input window is displayed, you can move to different cells in your worksheet and view their formulas. By clicking on values and functions in the formula displayed in the Add Input window (turning them "red"), you can add, edit or remove Vary functions by either:
• Typing directly in the formula, or
• Using the Min-Base-Max table below the formula to change parameters for a Vary function.
Percentile Values
40 What is What-If Analysis? When adding inputs, TopRank generates and inserts in the spreadsheet formula the necessary Vary function to go with the parameters you’ve selected for an input. You can also easily remove those Vary functions you don’t want.
Looking at All Inputs and Outputs in Open
Workbooks
The Modelwindow lists all selected output cells and all identified input Vary functions in your workbook(s). This table is displayed when Model Window icon (the icon with a red and blue arrow) is clicked.
The possible variation in value described by a Vary function can also be changed in the Model Window, just as in the Add Input window. Simply type in the new Min or Max value you want, or use the drop-downs to select a value from the list.
Running a What-If Analysis in
TopRank
Clicking the Run What-If icon starts a what-if analysis. When starting, TopRank first locates all Vary functions in your spreadsheet. If you have selected to add AutoVary functions by automatically identifying inputs, TopRank will add them. Then, it displays a status screen describing the analysis you are about to run:
Following the Status dialog, TopRank runs the analysis. During the analysis, one by one, TopRank changes the values returned by each Vary function, recalculates the spreadsheet, and collects and stores the new output value. The values returned by each Vary function depend on the minimum/ maximum range you entered for the function, the number of steps and the distribution selected.
During What-If calculations, a new value is returned for each step of each Vary function. For each new value, a new result is calculated and collected from each selected output cell. Once all steps have been calculated, TopRank then returns the Vary function to its base value and begins changing the next entered Vary function. Once all Vary function have been changed, all are returned to their original base value and the ranking of results is performed.
What-If Calculations
42 Running a What-If Analysis in TopRank
Results from a What-If Analysis
The standard results of a one-way What-If analysis are a ranking of input variables by their impact on your outputs. Input variables are all Vary and VaryTable function that were changed by TopRank during the What-If analysis. Outputs are output cells identified by you prior to the analysis.
A different ranking is made for each output cell selected (since inputs have different effects on each of your output cells). A Vary function used for Labor Cost for Factory 1, for example, can have a major effect on an output Profit for Factory 1 but no effect on an output Profit for Factory 2.
Ranking is done based on the amount of change from the output’s base value that was caused by changing the input Vary function to a new value. The amount of change is measured as a percentage change. This is calculated using the formula:
(New Calculated Output Value - Output Base Value) / Output Base Value.
What-If Analysis Results for Two Outputs
Graphical Results from a One-Way What-If Analysis
Three different types of graphs can be used to describe What-If analysis results. These are:• Tornado graphs
• Spider graphs
• Sensitivity graphs
Each graph provides an easily accessible method to view different aspects of What-If analysis results.
Tornado Graphs
A tornado graph compares the effects of all input variables on a given output. The X-Axis is drawn in the units of % change in output value. For each variable (listed on the Y-Axis), a bar is drawn between the extreme values of the output as calculated using the lower and upper input values. The variable with the greatest range or longest bar (the difference between the maximum and minimum value) is plotted on the top of the graph, and the variables proceed down the Y-Axis with decreasing range.
44 Running a What-If Analysis in TopRank The tornado graph brings attention to the variables that have the
greatest effects on your output’s value (those plotted on the top of the graph). The tornado graph can summarize the impact of an almost unlimited number of variables in a neat, simple graph.
Spider Graphs
A spider graph also compares the results for a single output as generated by multiple input variables. For each input variable, the percentage of the base case is plotted on the X-Axis and the percent change in output value calculated is plotted on the Y-Axis. The slope of each line depicts the relative change in the output per unit change in the input variable. The shape of the curve shows whether a linear or non-linear relationship exists between the input and the output.
Spider graphs provide more information about the variables than tornado diagrams. For example, spider graphs show the reasonable limits of change caused by each input variable and the unit impact of these changes on the outcome. While tornado graphs may lead the decision maker to think that risk is proportional, the slope of spider graphs demonstrates any unproportional changes in outcomes. The number of variables used in a spider graph should not exceed seven, but a limit of five is recommended to avoid clutter. If your What-If analysis contains a large number of input variables, it is a good
idea to plot them on a tornado graph first to determine which variables have the greatest impact. Then, use only these variables on your spider graph.
Sensitivity Graphs
The sensitivity or What-If graph is a simple diagram plotting input value used vs. output value calculated. The value of the selected input variable is plotted on the X-Axis and the calculated output value is plotted on the Y-Axis.
What is Multi-Way What-If Analysis?
A Multi-Way What-If analysis studies the impact of combinations of several inputs in a spreadsheet on results. In a Multi-Way What-If analysis, combinations of inputs are varied at the same time and the results calculated by each combination is tracked. Combinations are then ranked by their impact on each selected output.
Multi-Way What-If analysis is accomplished in TopRank using the “Multi” form of the Vary and VaryTable functions. VaryMulti and VaryMultiTable functions identify those inputs to be included in a Multi-Way What-If analysis. These functions are identical in form and arguments to standard Vary and VaryTable functions. They are included in the one-way What-If analysis that runs first in a TopRank analysis, prior to any Multi-Way What-If that is selected.
All VaryMulti and VaryMultiTable functionsare included in a Multi-Way What-If analysis. The number of these functions to be included in each combination tested is determined by the Group Size setting. For example, you might have four inputs defined using VaryMulti and VaryMultiTable functions — price, sales volume, production costs, and investment — and you want to see the impacts of every combination of two inputs on your result, profit. In this case, the Group Size is two. Your analysis might tell you that price and sales volume varying together are the most significant combination affecting your result — profit. Setting the Group Size to three might identify the combination of price, sales volume and investment as the most important three-way combination of inputs on results.
TopRank Functions for Multi-Way What-If Analysis
48 What is Multi-Way What-If Analysis?
Defining Multi-Way What-If Inputs
Inputs for a Multi-Way What-If analysis can be defined by:
• Directly changing the selected Vary and VaryTable functions in your spreadsheet to their equivalent VaryMulti and
VaryMultiTable forms, or,
• Highlighting the input Vary and VaryTable functions in the Model Window list, right-clicking and selecting ‘Multi-Way’.
VaryMulti and VaryMultiTable functions take the same arguments as do Vary and VaryTable functions. The Multi option just instructs TopRank to run a second analysis (following the one-way What-If analysis) that tries all Multi-Way combinations using "Multi" functions in your model. VaryMulti and VaryMultiTable functions are also evaluated as standard Vary and VaryTable functions during the one-way What-If analysis. This provides both one-one-way and Multi-Way What-If results on the same inputs in a single run.
Running a Multi-Way What-If Analysis in
TopRank
Multi-Way What-If analyses are executed by TopRank automatically once all one-way What-Ifs are completed. When executing a Multi-Way What-If, TopRank first identifies all VaryMulti and VaryMultiTable functions in your spreadsheet. Then, using the Group Size you’ve selected, TopRank tries all combinations of input values possible. As with a one-way What-If, TopRank recalculates your spreadsheet for each combination and collects the new output values generated. Once the Multi-Way What-If is completed, TopRank ranks all calculated combinations according to their impact on each output you’ve selected. The number of iterations or recalculations required during a Multi-Way What-If depends on:
• The number of VaryMulti andVaryMultiTable functions in your spreadsheet
• The #Steps entered in VaryMulti functions or number of values in the table for each VaryMultiTable function. If no #Steps is entered in a VaryMulti function, the default Multi-Way What-If # of Steps entered in the Other tab of the Analysis Settings dialog is used.
• The Group Size selected. In the Professional version, Group Size is limited to 2 or 3, and there is no Group Size limit in the Industrial version.
The selections for Group Size and default # of Steps used in a Multi-Way analysis are made in the TopRank Analysis Settings Dialog: How Many
Multi-Way
Calculations Are Made?