Resource
Multiplatform Analysis of 12 Cancer Types
Reveals Molecular Classification
within and across Tissues of Origin
Katherine A. Hoadley,1,20Christina Yau,2,20Denise M. Wolf,3,20Andrew D. Cherniack,4,20David Tamborero,5Sam Ng,6 Max D.M. Leiserson,7Beifang Niu,8Michael D. McLellan,8Vladislav Uzunangelov,6Jiashan Zhang,9Cyriac Kandoth,8 Rehan Akbani,10Hui Shen,11,22Larsson Omberg,12Andy Chu,13Adam A. Margolin,12,21Laura J. van’t Veer,3
Nuria Lopez-Bigas,5,14Peter W. Laird,11,22Benjamin J. Raphael,7Li Ding,8A. Gordon Robertson,13Lauren A. Byers,10 Gordon B. Mills,10John N. Weinstein,10Carter Van Waes,18Zhong Chen,19Eric A. Collisson,15The Cancer Genome Atlas Research Network, Christopher C. Benz,2,*Charles M. Perou,1,16,17,*and Joshua M. Stuart6,*
1Lineberger Comprehensive Cancer Center, University of North Carolina at Chapel Hill, Chapel Hill, NC 27599 USA 2Buck Institute for Research on Aging, Novato, CA 94945, USA
3Department of Laboratory Medicine, University of California San Francisco, 2340 Sutter St, San Francisco, CA, 94115, USA 4The Eli and Edythe Broad Institute of Harvard and MIT, Cambridge, MA 02142, USA
5Research Unit on Biomedical Informatics, Department of Experimental and Health Sciences, Universitat Pompeu Fabra, Dr. Aiguader 88, Barcelona 08003, Spain
6Department of Biomolecular Engineering, Center for Biomolecular Sciences and Engineering, University of California, Santa Cruz, 1156 High St., Santa Cruz, CA 95064, USA
7Department of Computer Science and Center for Computational Molecular Biology, Brown University, 115 Waterman St, Providence RI 02912, USA
8The Genome Institute, Washington University, St Louis, MO 63108, USA 9National Cancer Institute, NIH, Bethesda, MD 20892, USA
10UT MD Anderson Cancer Center, Bioinformatics and Computational Biology, 1400 Pressler Street, Unit 1410, Houston, TX 77030, USA 11USC Epigenome Center, University of Southern California Keck School of Medicine, 1450 Biggy Street, Los Angeles, CA 90033, USA 12Sage Bionetworks 1100 Fairview Avenue North, M1-C108, Seattle, WA 98109-1024, USA
13Canada’s Michael Smith Genome Sciences Centre, BC Cancer Agency, Vancouver, BC V5Z 4S6, Canada
14Catalan Institution for Research and Advanced Studies (ICREA), Passeig Lluı´s Companys, 23, Barcelona 08010, Spain 15Department of Medicine, University of California San Francisco, 450 35d St, San Francisco, CA, 94148, USA
16Department of Genetics, University of North Carolina at Chapel Hill, Chapel Hill, NC 27599 USA
17Department of Pathology and Laboratory Medicine, University of North Carolina at Chapel Hill, Chapel Hill, NC 27599 USA 18Building 10, Room 4-2732, NIDCD/NIH, 10 Center Drive, Bethesda, MD 20892
19Head and Neck Surgery Branch, NIDCD/NIH, 10 Center Drive, Room 5D55, Bethesda, MD 20892 20Co-first author
21Present address: Oregon Health Sciences University, 3181 S.W. Sam Jackson Park Road, Portland, Oregon 97239-3098, USA 22Present address: Van Andel Research Institute, 333 Bostwick Avenue, Northeast, Grand Rapids, Michigan 49503, USA *Correspondence:[email protected](C.C.B.),[email protected](C.M.P.),[email protected](J.M.S.)
http://dx.doi.org/10.1016/j.cell.2014.06.049
SUMMARY
Recent genomic analyses of pathologically defined
tumor types identify ‘‘within-a-tissue’’ disease
sub-types. However, the extent to which genomic
sig-natures are shared across tissues is still unclear.
We performed an integrative analysis using five
genome-wide platforms and one proteomic platform
on 3,527 specimens from 12 cancer types, revealing a
unified classification into 11 major subtypes. Five
subtypes were nearly identical to their
tissue-of-origin counterparts, but several distinct cancer types
were found to converge into common subtypes.
Lung squamous, head and neck, and a subset of
bladder cancers coalesced into one subtype typified
by TP53 alterations, TP63 amplifications, and high
expression of immune and proliferation pathway
genes. Of note, bladder cancers split into three
pan-cancer subtypes. The multiplatform classification,
while correlated with tissue-of-origin, provides
inde-pendent information for predicting clinical outcomes.
All data sets are available for data-mining from a
uni-fied resource to support further biological
discov-eries and insights into novel therapeutic strategies.
INTRODUCTION
Cancer Genome Atlas (TCGA) Research Network has reported integrated genome-wide studies of ten distinct malignancies: glioblastoma multiforme (GBM) (Cancer Genome Atlas Research
Network, 2008), serous ovarian carcinoma (OV) (Cancer Genome
Atlas Research Network, 2011), colon (COAD) and rectal (READ)
adenocarcinomas (Cancer Genome Atlas Research Network,
2012b), lung squamous cell carcinoma (LUSC) (Cancer Genome
Atlas Research Network, 2012a), breast cancer (BRCA) (Cancer
Genome Atlas Research Network, 2012c), acute myelogenous
leukemia (AML) (Cancer Genome Atlas Research Network,
2013b), endometrial cancer (UCEC) (Kandoth et al., 2013b),
renal cell carcinoma (KIRC) (Cancer Genome Atlas Research
Network, 2013a), and bladder urothelial adenocarcinoma (
Can-cer Genome Atlas Research Network, 2014). Those studies
have shown that each single-tissue cancer type can be further divided into three to four molecular subtypes. The subclassifi-cation is based on recurrent genetic and epigenetic alterations that converge on common pathways (e.g., p53 and/or Rb checkpoint loss; RTK/RAS/MEK or RTK/PI3K/AKT activation). Meaningful differences in clinical behavior are often correlated with the single-tissue tumor types and, in a few cases, single-tis-sue subtype identification has led to therapies that target the driving subtype-specific molecular alteration(s).EGFR mutant lung adenocarcinomas and ERBB2-amplified breast cancer are two well-established examples.
To move toward a molecular taxonomy, we investigated whether tissue-of-origin categories split into subtypes based upon multiplatform genomic analyses and also extend the analysis in the other direction to look for possible convergence. We looked to see what molecular alterations are shared across cancers arising from different tissues and if previously recog-nized disease subtypes in fact span multiple tissues of origin. With those questions in mind, we performed a multiplatform integrative analysis of thousands of cancers from 12 tumor types in The Cancer Genome Atlas (TCGA) project. Using data from multiple assay platforms, we tested the hypothesis that mole-cular signatures provide a distinct taxonomy relative to the currently used tissue-of-origin-based classification. At the cen-ter of our results is the identification of 11 ‘‘integrated subtypes.’’ Consistent with the histological classification, tissue-of-origin features provided the dominant signal(s) for identification of most subtypes, irrespective of genomic analysis platform or combination thereof. However, approximately 10% of cases were reclassified by the molecular taxonomy, with the newly defined integrated subtypes providing a significant increase in the accuracy for the prediction of clinical outcomes.
RESULTS
Samples, Data Types, and Genomic Platforms
To identify a multitissue, molecular signature-based classifi-cation of cancer objectively, we first characterized each of the individual tumor types using six different ‘‘omic’’ platforms. The diverse tumor set called ‘‘Pan-Cancer-12,’’ is composed of 12 different malignancies. It comprises 3,527 cases assayed by at least four of the six possible data types routinely generated by TCGA: whole-exome DNA sequence (Illumina HiSeq and GAII), DNA copy-number variation (Affymetrix 6.0 microarrays), DNA
methylation (Illumina 450,000-feature microarrays), genome-wide mRNA levels (Illumina mRNA-seq), microRNA levels (Illumina microRNA-seq), and protein levels for 131 proteins and/or phosphorylated proteins (Reverse Phase Protein Arrays; RPPA). The 12 tumor types include the ten TCGA Network pub-lished data sets listed above and two additional tumor types for which manuscripts have been submitted: lung adenocarcinoma (LUAD) and head and neck squamous cell carcinoma (HNSC). This is the most comprehensive and diverse collection of tumors analyzed by systematic genomic methods to date.
We performed sample-wise clustering to derive subtypes based on six different data types separately: DNA copy number, DNA methylation, mRNA expression, microRNA expression, protein expression, and somatic point mutation (seeExtended
Experimental Procedures, Section 1). The classification results
from each single-platform analysis produced sets of 8 to 20 groups of samples that each showed high correlation with tissue of origin (Figures S1A–S1F available online) and were highly comparable with each other (Figure S2A). For example, patterns of copy-number change varied across tissue types, and sub-typing of the tumors based on copy-number alterations revealed a significant correlation with tissue (p < 6x10 6, Chi-square test).
Integrated Platform Analysis—Cluster-of-Cluster Assignments
To identify disease subtypes on a more comprehensive basis than could be done using any single type of data, we developed an integrated subtype classification for all of the tumor samples in the Pan-Cancer-12 collection based on five of the data types, excluding somatic mutations. To do so, the results of the single-platform analyses were provided as input to a second-level cluster analysis using a method we refer to ascluster-of-cluster assignments (COCA), which was originally developed to define subclasses in the TCGA breast cancer cohort (Cancer Genome
Atlas Research Network, 2012c). The algorithm takes as input
the binary vectors that represent each of the platform-specific cluster groups and reclusters the samples according to those vectors (see Extended Experimental Procedures, Section 2). One advantage of the method is that data across platforms are combined without the need for normalization steps prior to clustering. In addition, each platform influences the final inte-grated result with weight proportional to the number of distinct subtypes reproducibly found by consensus clustering. Thus, ‘‘large’’ platforms (e.g., 450,000 DNA methylation probes) with orders of magnitude more features than ‘‘small’’ platforms (e.g., 131 RPPA antibodies) do not dominate the solution.
In addition to the COCA classification, we used two additional, independent methods to derive Pan-Cancer-12 subtypes based on integrated data: (1) an algorithm called SuperCluster
(Kandoth et al., 2013b) (Figure S2B) and (2) clustering based
populated single-mutation space) to cluster samples based on somatic DNA variants (Hofree et al., 2013), we calculated a mutation-based clustering after first associating genes with pathways and then identifying clusters based on mutated pathways(Figure S1F andData S1). Including those clusters in the identification of COCA subtypes produced highly similar results to COCA subtypes that did not use the mutation-based clusters (Figure S2D). Thus, we focus here on the COCA results obtained without the mutations, as those five other platform-based classifications required no prior biological knowledge.
The COCA algorithm identified thirteen clusters of samples, 11 of which included more than ten samples (Table S1). The two small clusters (n = 3 and 6) are noted (Table 1) but were excluded from further analyses. We refer to the remaining sample groups by cluster number and a short descriptive mnemonic (Table 1). Of the 11 COCA-integrated subtypes, five show simple, near one-to-one relationships with tissue site of origin: C5-KIRC, C6-UCEC, C9-OV, C10-GBM, and C13-LAML
(Figure 1A). A sixth COCA type, C1-LUAD-enriched, is
predom-inantly composed (258/306) of non-small cell lung (NSCLC) adenocarcinoma samples (LUAD). The second major constituent of the C1-LUAD-enriched group is a set of NSCLC squamous samples (28/306). Upon re-review of the frozen or formalin fixed sections, 11/28 lung squamous samples that cluster with the C1-LUAD-enriched group did not have squamous features and were reclassified as lung adenocarcinoma (Travis et al., 2011). NSCLCs are often difficult to classify based on histology alone
(Grilley-Olson et al., 2013). That difficulty poses an important
clinical challenge since histology is used to guide the selection of chemotherapy (Scagliotti et al., 2008) and to select patients for further mutational analysis (e.g.,EGFR mutation andALK fusion testing in nonsquamous NSCLC). However, the challenge
can be addressed by genomic analysis based on distinct differ-ences in mutation spectrum (Table S2A) and distinct gene expression patterns (Figure S1A). Two clear subtypes of NSCLC (C1-LUAD-enriched and C2-squamous-like, see discussion below) are identified by COCA.
For the other five tissue types, the patterns are more complex. Either a given tissue splits into multiple COCA groups (diver-gence) or multiple tissue types coalesce into a single COCA group (convergence). A simple example of convergence previ-ously described for TCGA data are the merging of colon (COAD) and rectal (READ) tumors into a single COCA group
(Cancer Genome Atlas Research Network, 2012b). The
expres-sion features shared by colon and rectal samples were noted in the TCGA Network paper on the two cancer types, but we extend those findings through use of the multiplatform clustering approach (Figure 1A andTable 1).
Breast cancers (BRCA) exhibit a pattern of divergence in which two main groups of samples are distinctly identifiable. One group (C3-BRCA/Luminal) contains essentially all of the luminal (estrogen receptor-positive) (594/597) and HER2-posi-tive tumors (66/66), whereas the other (C4-BRCA/basal) contains 131/139 of the breast basal-like tumors. Although it has previ-ously been appreciated that basal-like breast cancers (the majority subset of triple-negative breast cancers) form a distinct subtype (Prat et al., 2013; Cancer Genome Atlas Research
Network, 2012c), the findings here provide a more refined,
quantitative picture of the extent of difference from luminal and basal-like breast cancers. Whereas tissue of origin is the domi-nant signal for combined data on almost all of the other cancer types in the Pan-Cancer-12 collection, breast basal-like cancers are as different from luminal/ER+ breast cancers as they are from cancers of the lung (Figure 1A). The data from the present study Table 1. The 12 Pathological Disease Types, Rows, and Their Relationship to the 13 Integrated Subtypes Defined by the Cluster-of-Cluster-Assignments Method
Handle
C1-LUAD-Enriched
C2-Squamous-like
C3-BRCA/ Luminal
C4-BRCA/ Basal
C5-KIRC
C6-UCEC
C7-COAD/ READ
C8-BLCA C9-OV C10-GBM
C11- Small-Various
C12- Small-Various
C13-AML Total
BLCA 10 31 0 0 1 0 0 74 0 1 1 2 0 120
BRCA 2 1 688 135 5 0 0 2 0 0 0 0 1 834
COAD 0 0 0 0 0 0 182 0 0 0 0 0 0 182
GBM 3 0 0 0 2 0 0 0 0 190 0 0 0 195
HNSC 1 302 0 0 0 0 0 1 0 1 0 0 0 305
KIRC 1 0 0 0 470 0 0 0 0 2 0 2 0 475
LAML 0 0 0 0 0 0 0 0 0 0 0 0 161 161
LUAD 258 6 0 1 0 1 0 1 0 1 0 2 0 270
LUSC 28 206 0 1 0 0 0 1 0 2 0 0 0 238
OV 1 0 0 0 1 0 0 0 327 0 0 0 0 329
READ 0 0 0 0 0 0 73 0 0 0 0 0 0 73
UCEC 2 0 0 0 0 340 1 0 0 0 2 0 0 345
Totals 306 546 688 137 479 341 256 79 327 197 3 6 162 3527
The name of each COCA subtype (top row) includes a cluster number (1 to 13) and a text designation for mnemonic purposes. Two of the subtypes (numbers 11 and 12) were eliminated from further analysis because they included < 10 samples (3 and 6 samples, respectively). Hence, the text focuses on 11 subtypes, not 13.
strongly reinforce the idea that basal-like breast cancers consti-tute a unique disease entity.
The remaining three tissue types (HNSC, LUSC, and BLCA) provide examples of both divergence and convergence in COCA subtyping (Figure 1A andTable 1). The strongest pattern of convergence is observed for the vast majority of HNSC (301/ 304), LUSC (206/238), and some of the BLCA (31/120) tumors; they cluster together in a large COCA group (C2-squa-mous-like), perhaps reflecting similar cell type of origin or smoking as an etiologic factor. BLCA tumors also exhibit a divergence pattern, distributing predominantly into three distinct groups: 31 BLCA in the C2-squamous-like group, 10 in the C1-LUAD-enriched group, and 74 in the bladder-only group, C8-BLCA. Five other BLCA samples cluster in four different COCA groups.
Clinical Importance of the COCA Subtypes
To investigate the clinical relevance of the COCA subtypes, we performed Kaplan-Meier Survival analysis on the Pan-Cancer-12 data set. The results indicate that tissue-of-origin (Figure S3A) and COCA subtype (Figure 1D) are both prognostic, and each provides independent information (Figure 1E). Additionally, the two most commonly mutated genes in the overall data set, TP53 (41%) and PIK3CA(20%), are prognostic, even across different tumor types, as are previously defined genomic signa-tures of cell proliferation rate (Nielsen et al., 2010) and mutated TP53 gene-expression-based signature (Troester et al., 2006)
(Figures S3B–S3F).
We next asked whether prognostic information is provided by the COCA subtypes after accounting for known clinical and tissue-of-origin features. We performed a multivariate Cox proportional hazards analysis to predict outcomes across the data set. The analysis was limited to the COCA subtypes that did not have a one-to-one relationship with tissue-of-origin tumor type (COCA1-LUAD enriched, COCA2-squamous, COCA3-Breast/luminal, COCA4-breast/basal, COCA7-COAD/ READ, and COCA8-BLCA). In the model we included clinical features such as tumor size, node status, metastasis status, and age at diagnosis, as well as tissue of origin. We performed a likelihood ratio test conditioning first on the clinical variables; when either tissue-of-origin or COCA subtype was added to
the model, a large increase in the predictive fit of the model was observed, beyond what one would get with the clinical infor-mation alone (Figure 1E). That observation supports the classical model in which tissues of origin provides strong predictions of outcome. Next, we asked whether the COCA subtypes add additional independent information for predicting survival beyond the combination of tissue-of-origin and clinical features. Indeed, we observed a significant increase in statistical likeli-hood when COCA is added to a multivariate model that already includes the clinical and tissue-based information (p < 0.0002; Chi-square test;Figure 1E). Thus, while the COCA classification differs from tissue-of-origin-based classification in only10% of all samples, the difference does provide important molecular information that reflects tumor biology and is associated with clinical outcome.
Genomic Determinants of the Integrated COCA Subtypes
We next identified the major genomic determinants of the COCA subtypes, including somatic mutations and DNA copy-number changes (Figures 1B and 1C). For single-nucleotide variants, we analyzed a Pan-Cancer-12 list of 127 significantly mutated genes (SMGs) obtained by MuSiC analysis (Kandoth
et al., 2013a). Only three of the genes are mutated at a
fre-quency R10% (TP53, PIK3CAand PTEN), and 11 additional are mutated atR5% frequency (Table S2A). We also include a list of 291 high-confidence cancer drivers (HCDs) from Pan-Cancer-12 analysis (Tamborero et al., 2013) and identified by a combination of five complementary methods to identify signals of positive selection in the mutational pattern of genes across tumors.
A large number of correlations between COCA subtypes and somatic mutations were found (Figure 2A, Figure S4D, Data S2). Somatic mutations clearly distinguish the C1-LUAD-enriched group from the C2-squamous-like group. KEAP1 andSTK11are preferentially mutated in C1-LUAD-enriched tu-mors, whereasCDKN2A,NOTCH1,MLL2, andNFE2L2, among others, are preferentially mutated in C2-squamous-like (
Fig-ure 2A). A similarly distinct set of SMGs was seen for the
C3-BRCA/luminal and C4-BRCA/basal groups; only two genes are shared (TP53 and PIK3CA), and they show different
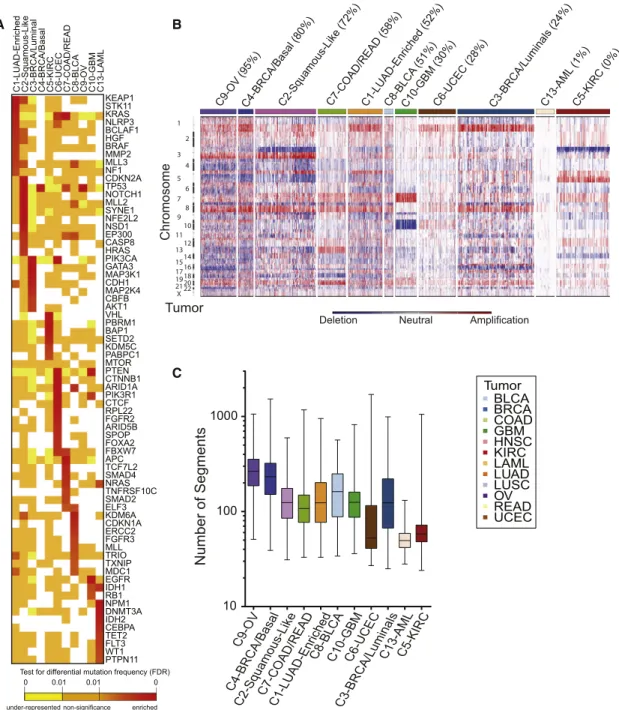
Figure 1. Integrated Cluster-Of-Cluster Assignments Analysis Reveals 11 Major Subtypes
(A) Integration of subtype classifications from 5 ‘‘omic’’ platforms resulted in the identification of 11 major groups/subtypes from 12 pathologically defined cancer types. The groups are identified by number and color in the second bar, with the tissue of origin specified in the top bar. The matrix of individual ‘‘omic’’ platform type classification/subtype schemes was clustered, and each data type is represented by a different color: copy number, black; DNA methylation, purple; miRNA, blue; mRNA, red; and RPPA, green.
(B) Mutation status for each of ten significantly mutated genes coded as: wild-type, white; mutant, red; missing data, gray.
(C) Copy-number status for each of nine important genes: amplified, red; deleted, blue; copy-number neutral, white; and missing data, gray. The color-coding schema is shown to the right.
(D) Overall survival (OS) of COCA subtypes by Kaplan-Meier plot. COCA subtypes are highly correlated with overall survival outcomes.
(E) The log-likelihood ratio (LR) statistic was estimated as we added clinical variables, COCA subtype, or tissue-type information to a cox proportional hazards model. Clinical variables included age at diagnosis, tumor size, node status, and metastasis status. The change in LR statistic as features were added to the model was assessed for significance by chi-square analysis. The set of samples was limited to the set of tumor types that did not have a one-to-one relationship with a COCA subtype: BLCA, BRCA, COAD, HNSC, LUAD, LUSC, and READ in COCA clusters COCA1-LUAD-enriched, COCA2-squamous, COCA3-BRCA/ luminal, COCA4-BRCA/basal-like, COCA7-COAD/READ, and COCA8-BLCA. Left bar shows results of adding tissue-of-origin to clinical variables already part of the model, followed by a variable representing the COCA subtyping; right bar shows results when COCA is first added on to clinical variables, and then tissue-type is added. In each case the increase in the ability to predict OS was in terms of the LR.
mutation frequencies (Table S2A). Since the somatic mutation results were not used in any way to determine the COCA sub-types, they provide independent evidence that distinctly
different genetic events underlie the subtypes. A protein-protein interaction network analysis of mutations associated with the COCA subtypes obtained using a new version of
A B
C
Figure 2. Genomic Determinants of the Integrative COCA Subtypes
(A) Genes from the high-confidence list of drivers (Tamborero et al., 2013) found to be mutated at a different rate within one COCA subtype compared outside it based on a two-tailed Fisher’s exact test. Mutation frequency enrichment, red to orange; genes with mutations equaling the background rate, yellow; genes with no observed mutations in a subtype, white. Displayed are top-ranked genes in terms of significant mutation enrichment (FDR < 1%) in at least one COCA subtype. (B) Somatic copy-number alterations (SCNAs) in integrative clusters. SCNAs in tumors (horizontal axis) are plotted along chromosomal locations (vertical axis). The heatmap shows the presence of amplifications (red) and deletions (blue) throughout the genome. The color strip along the top indicates integrative COCA cluster membership; the number in parentheses indicates percentage of samples in a COCA subtype with TP53 mutation. COCA subtypes are ordered from highest TP53 mutant percentage to lowest.
(C) Range of copy-number segments in tumors within each integrative cluster. The box and whisker plots show the middle quartiles and the minimum and maximum number of segments in each cluster group.
the HotNet algorithm (Vandin et al., 2012) provides an overview of the genomic determinants of the COCA subtypes
(Figure S4E).
The degree of genomic instability was a major determinant of subtype, as revealed in copy-number variation (CNV) data (
Fig-ure 2B). The C9-OV, C4-BRCA/basal, and C1-LUAD-enriched
subtypes showed the most marked genomic instability, as assessed by average number of copy-number segments per subtype (Figure 2C), whereas AML and UCEC showed the least. Numerous COCA subtype-associated alterations implicated specific regions, arm-level copy-number changes (Figure S4A) and/or focal regions of copy-number alteration (Figure S4B). Of note were a number of previously described tissue-type-spe-cific and subtype-spetissue-type-spe-cific alterations, including Chr7 gain and Chr10 loss in GBM (Cancer Genome Atlas Research Network, 2008), 3p loss and 5q gain in kidney (Cancer Genome Atlas
Research Network, 2013a), 4q and 5q loss in breast basal-like
cancers (Cancer Genome Atlas Research Network, 2012c), and 3p loss and 3q gain in lung squamous tumors (Cancer
Genome Atlas Research Network, 2012a). Of note, the latter
were seen in most C2-squamous-like tumors, regardless of tis-sue of origin.
C1−LU
AD−enr
iched
C2−Squamous−lik
e
C3−BRCA/Luminal C4−BRCA/Basal C5−KIRC C6−UCEC C7−CO
A D/READ C8−BLCA C9−O V C10−GBM C13−AML GP4_MES/ECM GP13_Neural signaling
GP3_Tumor suppressing miRNA targets GP8_FOXO/stemness/ALK GP7_Estrogen signaling GP19_1Q amplicon
GP14_Plasma membrane cell−cell signaling GP21_Anti−apoptosis/DNA stability GP1_Proliferation/DNA repair GP5_Myc targets/TERT GP9_Cell−cell adhesion GP18_Vesicle/EPR membrane coat GP2_Immune−T cell/B cell GP11_Immune−IFN GP15_EGF signaling
GP16_Protein kinase signaling (MAPKs) GP6_Squamous differentiation/development GP17_Basal signaling
GP10_Fatty acid oxidation GP12_Hypoxia/Glycolosis GP20_TAL1−leukemia/erythropoiesis GP22_16Q22−24 amplicon HER2_AMPLIFIED MYC_AMPLIFIED CASPASE_CASCADE (APOPTOSIS) P53_MUTATED PROLIFERATION/CELL CYCLE RB_PATHWAY BRCA1/2_ATR_PATHWAY VEGF_PATHWAY MTOR_PATHWAY RAS_PATHWAY RESPONSE_TO_ANDROGEN ALK_PATHWAY PI3K_CASCADE AKT_PATHWAY IGF1R_PATHWAY PTEN_PATHWAY RETINOL_METABOLISM HDAC_TARGETS_DN CTLA4_PATHWAY PD1_SIGNALING Gene Programs Selected Pathways Integrated Subtypes
−1.5 0 1.5
Expression value Color Key
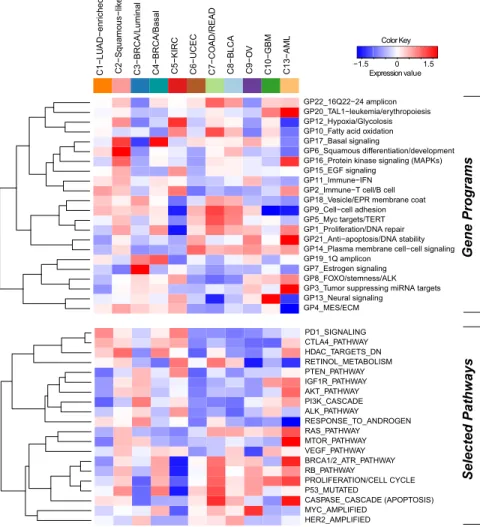
Figure 3. Subtype-Specific Patterns of Gene-Program and Selected Pathway Ex-pression Characterizing Each Pan-Cancer-12 COCA Subtype
The heat map shows integrative subtypes in nu-merical order. Gene programs (top) and pathway signatures from a compendium (Table S4) con-taining signatures for drug targets and canonical pathways (bottom) were clustered separately from each other. Red-blue intensities reflect the means of the scores (red = high, white = average, blue = low). See alsoFigures S5andS6, andData S5.
Expression-Based Determinants of the Integrated Subtypes
We next sought to identify gene ex-pression modules characteristic of each COCA subtype. First, we started with 6,898 sets of gene signatures docu-mented to be coexpressed, coamplified, or to function together. From these, we identifiedgene programsas those whose genes have mRNA-seq signatures of high mutual correlation across the Pan-Cancer-12 data set. After applying a bimodality filter and weighted gene cor-relation network-based clustering, 22 nonredundant gene programs were iden-tified (Table S4A,Figure S5A, Extended
Experimental Procedures, Section 5, and
Data S5). Linear classification with the
22 gene programs reconstituted the 11 integrated subtypes with 90% accuracy
(Figure S5A and Table S4B). To view
the expression-based determinants of the integrated subtypes, we plotted the average expression level of each gene program within each COCA cluster (Figure 3). As expected, the gene programs GP6-squamous differentiation/development, GP13-neural sig-nalingandGP20-TAL-1-leukemia/erythropoiesiswere the most highly expressed in the C2-squamous-like, C10-GBM, and C13-LAML subtypes, respectively. As well, GP7_Estrogen signalingwas highest in the C3-BRCA/luminal cases, whereas GP17_basal signaling had its highest levels in the C4-BRCA/ basal cases. Activated pathway characteristics found by enrich-ment and subnetwork analyses based on PARADIGM infer-ences, many of which were consistent with the gene program analysis, are summarized inTable S4A (seeExtended
Experi-mental Procedures).
patient outcome in kidney cancer using a Cox proportional hazards survival analysis (Figure S5D andTable S4F). In com-mon with the C3-BRCA/luminal subtype cases, higher levels of estrogen signaling (GP7) were also associated with better prognosis for C5-KIRC cancers. Consistent with the higher frequency of elevated HER2 protein levels in bladder, colorectal, and serous endometrial cancers (Akbani et al., 2014), the HER2-amplifiedgene signature appeared elevated in the C8-BLCA, C7-COAD/READ, and C6-UCEC subtypes, as well as the C3-BRCA/luminal subtype which contains all HER2-positive breast cancers. Predictors independent of disease stage included basal signaling (GP17), associated with decreased overall survival, and the immune-related PARADIGM pathways PD1_ signaling and CTLA4_pathway, both of which were associated with increased overall survival. These immune-related signa-tures may reflect varying amounts of lymphocyte infiltrate in the tumors as has been estimated by DNA methylation-based analysis of the Pan-Cancer-12 data set (Figure S5E). In any case, these immune cell-associated gene programs may be pertinent to emerging treatment strategies based on immune modulation. Overall, despite uneven clinical information and follow-up across the many different Pan-Cancer types, ex-pression-based determinants of the integrated subtypes were sufficiently informative to identify pathway-based features of prognostic value that transcend tissue-of-origin cancer types.
Multiple-Platform Determinants of the Integrated Subtypes
To gain insight into the genetic and epigenetic determinants that characterize each of the COCA subtypes, we calculated differential gene scores derived from each of the separate six platforms (seeExtended Experimental Procedures, Section 4) as well as PARADIGM pathway features. All differential activities were mapped to individual genes so that thematic pathways could be identified (seeData S2). Copy-number data were sum-marized at the gene level using GISTIC 2.0 and t tests for every gene were performed for each COCA subtype. DNA Methylation probes were associated with any gene that fell in the±1,500 bp region surrounding gene transcriptional start sites. Genes with differential mRNA expression were identified using a SAM anal-ysis on the RSEM values. Genes with differentially expressed protein products were determined by running a t test on the 131 protein forms represented on the RPPA data. For mutations, a Fisher’s exact test on the frequency within a COCA subtype compared to outside the subtype was performed for all of a set of 291 high-confidence driver genes (Tamborero et al., 2013). Differentially expressed miRNAs for each COCA subtype were identified using a Wilcoxon rank-sum test based on the miRNA-Seq data. Genes were then identified as those predicted to be targeted by a differentially expressed miRNA that was also anticorrelated across the Pan-Cancer-12 data set.
Three approaches were used to summarize the unique fea-tures of the COCA subtypes. First, gene set enrichment analysis (GSEA) was run on the single-platform gene-based results and then clustered for visual inspection to elucidate distinctive pathways (Figure S6A). Second, a supervised Elastic Net approach was used to classify the COCA subtypes with 95% accuracy in cross-validation and the predictive features were
collected (Figure S6B;Data S3). Third, ‘‘regulatory hubs’’ from PARADIGM with more than 15 downstream targets and found to be differentially activated within a COCA subtype relative to other subtypes were collected (Table S5A). All three approaches revealed that each platform detects different pathways and features with respect to both COCA subtypes and data plat-forms. The identified discriminating features of the COCA subtypes confirm several expectations: (1) C3-BRCA/luminal was defined by protein and gene signatures for ER and GATA3 determined by the Elastic Net model as well as by PIK3CA-related signaling revealed by copy-number variation-based and mutation-based GSEA, (2) C5-KIRC was defined by multiple features of hypoxia found by mutation- and mRNA-Seq-based GSEA as well as predictive Elastic Net features, and (3) C7-COAD/READ was in part defined by APC mutations.
Convergence of the Squamous-like Subtype
A striking finding of the integrative subtype analysis was the coalescence of four distinct tumor types (LUSC, HNSC, some BLCA, and a very few LUAD) into the single C2-squamous-like subtype. We investigated the genomic- and pathway-based de-terminants of the subtype. The three main tumor types included shared loss of 3p and increasedTP63, PIK3CA, andSOX2gene copies within a characteristic 3q amplicon (Figure 4A). Those re-gions are well known in LUSC (Cancer Genome Atlas Research
Network, 2012a) and HNSC (Bhattacharya et al., 2011; Walter
et al., 2013), and the results here extend that observation to
include a subgroup of BLCA cases. In addition, the C2-squa-mous-like subtype tends to show amplification of MYC and loss of CDKN2A,RB1, andTP53.TP53 mutation is frequent (72%), followed by a dramatic drop-off in mutation frequency to MLL2 (20%), PIK3CA (19%), CDKN2A (18%), NOTCH1 (16%),NFE2L2(10%), andMALAT1(6%), the only other genes mutated atR10% frequency (Table S2A). Of potential interest in the C2-squamous-like group, tumors withoutTP53mutations show a higher density ofPIK3CAmutations (Figure 1), consistent with recent evidence linkingPI3Kactivation and wild-typeTP53 inactivation in HNSC (Herzog et al., 2013). Putative driver analysis identified several genes (PIK3CA,MLL3, andKEAP1) frequently mutated in the C2-squamous-like group but also in other COCA subtypes (Figure 4B). Of these, FRG1B and CASP8 were found to be significantly more associated with HNSC by Fisher’s exact test. Putative driver analysis also re-vealed a number of genes with higher mutation frequencies in the C2-squamous-like subtype than in any other subtype: TP53,SYNE1,MLL2,CDKN2A,NOTCH1,NFE2L2, andEP300, among others (Figure 4C;Figure S7A).
NFE2L2,CUL3, andKEAP1are well-known regulators of oxida-tive stress. The third most mutated subnetwork (37.1% of squa-mous samples) includes the ASCOM complex (MLL2 and MLL3) and the putative ASCOM-interacting protein KDM6A. These pro-teins are involved in histone modifications that promote tran-scription. In addition, consistent with previous reports on collec-tive motility in squamous cell carcinomas (Friedl and Gilmour, 2009), RAC and RHO signaling are also elevated in the
C2-squa-mous-like subtype based on PARADIGM analysis (Table S4Aand
Figure S7B).
Molecular Features Common to the Squamous, Breast Basal, and Ovarian Subtypes
Past work highlighted transcriptional similarities between the breast basal-like subtype and LUSC (Chung et al., 2002), as well as breast basal-like and serous ovarian cancers (Cancer
Figure 4. Genomic Determinants of the C2-Squamous-like COCA Subtype
(A) SCNAs for the C2-squamous-like subtype are shown, highlighting the importance of 3q26 gains across the different tissue-of-origin samples.
(B) Selected genes from 291 high-confidence driver (HCD) genes (Tamborero et al., 2013) mutated in >5% of C2-squamous-like samples and comparable in frequency in other subtypes. Samples with protein-affecting mutations in those genes are shown in green.
(C) HCD genes (as in B) with mutation frequency significantly higher in C2-squamous-like tumors relative to others (stated at p < 0.01 according to Fisher’s exact test with FDR correction). The method used corrections for imbalance in the number of samples from different tissues (seeExtended Experimental Procedures, section 8).
(D) Two subnetworks of mutated pathways identified by an updated HotNet algorithm analysis using HINT interactions (seeExtended Experimental Procedures) as mutated in at least 20% of the samples of the C2-squamous-like subtype. Links between pie charts indicate interactions among the proteins in each sub-network. Each gene (node) is colored by wedges whose size indicates the relative proportion of the gene’s mutations that are in samples from each integrated subtype. To the right of the pie charts is a gene-by-sample mutation matrix representing the mutation status of each gene across all squamous-like samples. Full ticks represent SNVs, lower ticks represent deletions and upper ticks represent amplifications. The color of each tick indicates tissue-of-origin type, with gray indicating no mutation in the corresponding sample.
COCA Subtype p53 Mutation TP63 dNp63 TAp63 TP73 dNp73 TAp73 C2-Squamous-like C4-BRCA/Basal C9-OV Integrative Subtype Wild Type Missense Truncating p53 Mutation
<−2 −1 0 1 >2
Intensity Scale
I
II
III 1st Ring: COCA Subtype
Outer Ring: P-Shift
6th Ring: PARADIGM Downstream Signal 5th Ring: PARADIGM Upstream Signal
2nd Ring: Mutation Type 3rd Ring: Copy Number 4th Ring: Expression
TP53
Mean P-Shift: -0.94 Mean P-Shift: -0.34Mean P-Shift: 0.87
C2-Squamous-like C4-BRCA/Basal C9-OV COCA Subtype Wild Type Missense Truncating
p53 Mutation Type
S100A2 TP53I3 FDXR SERPINB5 DST-3 ITGB4 MIR130B_(miRNA) CLCA2 TFAP2C SHH EGR2 YWHAQ
GPX2 PML MFGE8
IKBKB DHRS3 ITGA3 CDKN1A NQO1 JAG1 TAp63g_ (tetramer)_ (complex) FLOT2 VDR PERP AEN DICER1OGG1 TRAF4 CHUK SMARCD3 EVPL degradation _(abstract) POU2F2 RRAD DNA_damage _(abstract) FOSL2 ATM STXBP4 TCF7L1 BRCA2 SEC14L2 AXL RAB38 IL1A HES1 ITCH dNp63a_ (tetramer) _(complex) SFN ADA NRG1 ADRM1 IGFBP3 GADD45A MRE11A KRT14 Q8N726 KRT5 YAP1 COL5A1 RUNX1 MDM2 CDKN2A CCNB2 TP63 HELLS
FASN DLX5 T
DLX6 TOP2A CEBPD BDKRB2 keratinocyte_ differentiation _(abstract)
Activated in both subtypes Repressed in both subtypes Activated in C2-Squamous-like Repressed in C4-BRCA/Basal Activated in one subtype Repressed in one subtype Color Key
More significant in C2-Squamous-like More significant in C4-BRCA/Basal Shape Key 0 10 20 30 40 50 60 C2−Squamous-like C4−BRCA/Basal C9−OV RSEM V alues TAp63 C2 C4 C9
dNp63 C2 C4 C9
TAp73 C2 C4 C9
dNp73 C2 C4 C9
A B
C D
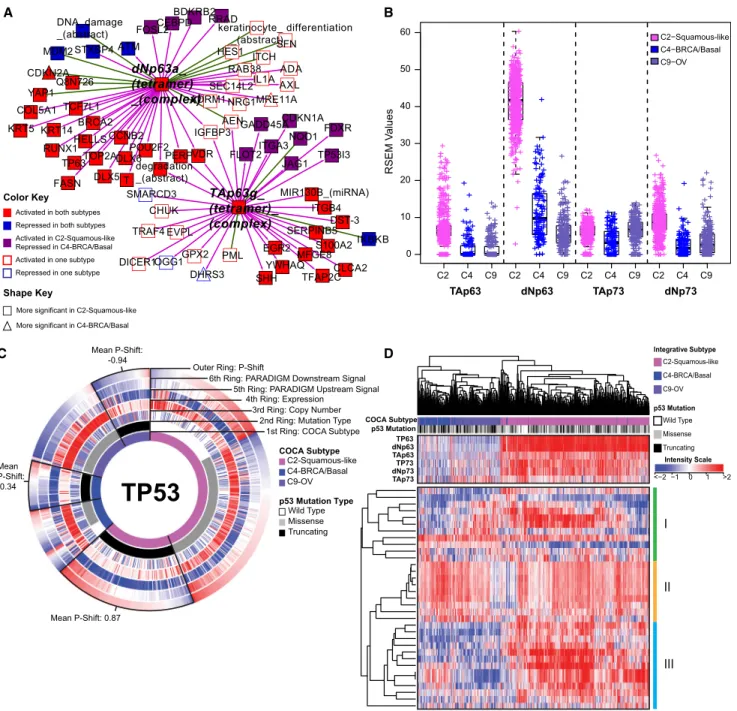
Figure 5. Comparison of Molecular Characteristics of C2-Squamous-like, C4-BRCA/Basal, and C9-OV Subtypes Reveals Differences in TP63 and TP53 Signaling
(A) Relative significance of TP63 network activation within the C2-squamous-like and C4-BRCA/basal subtypes. The network neighbors surrounding the TAp63g
andDNp63atetramer complexes that show significant activation (or inactivation) within the C2-squamous-like and/or C4-BRCA/basal subtypes relative to all other cases were visualized using Cytoscape (Shannon et al., 2003). Node shape reflects relative significance in the one-versus-all comparison (square: more significant in C2-squamous-like, triangle: more significant in C4-BRCA/basal). Node color indicates relative activity (red: activated in C2 and C4, blue: inactivated in C2 and C4, purple: activated in C2 but inactivated in C4, white: activated or inactivated in only one subtype).
(B) Box plot of isoform-specific levels of TP63 and TP73 within three of the TP53-frequently mutated COCA subtypes (C2-squamous-like, C4-BRCA/basal, and C9-OV).
(C) CircleMap of PARADIGM-Shift differences associated with TP53 mutations within the C2, C4, and C9 COCA subtypes. Samples were ordered first by integrative subtype membership (innermost ring), then by TP53 mutation status (second ring), and finally by P-Shift (outer ring, indicating TP53 activity). The GISTIC score (indicating CNV), mRNA expression level, PARADIGM upstream and downstream activities are shown in the third, fourth, fifth and sixth rings, respectively. Red-blue color intensity reflects magnitude (red: positive, blue: negative). TP53-truncating mutants are highlighted (black outlined wedge), and the mean P-shift scores of the truncating mutants are shown. Negative P-Shift scores (outer ring blue) predict loss of function (LOF).
Genome Atlas Research Network, 2012c). We therefore asked if those subtypes share additional characteristics. The C9-OV (94%), C4-BRCA/basal (80%) and C2-squamous-like (72%) subtypes have the highest frequencies of TP53 mutation. All three show a very high frequency of copy-number changes (
Fig-ure 2C), and all are significantly enriched with amplifications of
3q26 and 8q24/cMYC and losses of chromosomes 4q, 5q, 8p, and 18q (Figure 2B). The COCA subtypes share features com-mon to a pan-cancer cluster identified by a parallel analysis of the transcriptional profiles of these same tumors (Martinez
et al., 2014), which was found to be associated with genomic
loss of CDKN2A (p16ARF), increased numbers of DNA double-strand breaks, high expression of cyclin B1, and upregulation of proliferation genes.
Consistent with our previous TCGA report noting the similar-ities between breast basal-like and serous ovarian cancers
(Cancer Genome Atlas Research Network, 2012c), the
copy-number profiles of the integrative subtypes place the C4-BRCA/basal subtype closest to the C9-OV subtype (Figure S4C); both are also near a cluster tree branch that contains C2-squamous-like and C8-BLCA. All six of those subtypes show TP53 mutation and large-scale copy-number changes.
Pathway commonalities between the C4-BRCA/basal and C9-OV subtypes (Table S5B) largely recapitulate previous find-ing usfind-ing PARADIGM analysis that both subtypes show acti-vation of cMYC and FOXM1/proliferation signaling (Cancer
Genome Atlas Research Network, 2012c). However, HIF1A
signaling in those subtypes, despite previously being reported as high, appears less active in this pan-cancer context, probably due to the presence of other cancer types with clearly elevated HIF1A signaling (e.g., C5-KIRC). In terms of gene programs, C2-squamous-like tumors show high expression of the basal signalinggene program (GP17), at levels comparable with those in the C4-BRCA/basal tumors (Figure 3). In addition, both sub-types show upregulation of the proliferation/DNA synthesis gene program (GP1), as well as signatures of TP53 mutation, MYC targets/TERT, VEGF signaling, and activation of the PD1 and CTLA4 immune costimulatory pathways (Table S4A,
Fig-ure 3). Indeed, principal components analysis showed that
C2-squamous-like and C4-BRCA/basal tumors are the most similar COCA subtypes with regard to gene program/drug path-way expression (Figure S5B).
In line with those findings, a systematic search for PARADIGM pathway commonalities between the C2-squamous-like and C4-BRCA/basal tumors through the definition of a ‘‘basalness score’’ (Cancer Genome Atlas Research Network, 2012c) re-veals shared activation of proliferation- and immune-related pathways. TP63 network dysregulation is apparent in HNSC and LUSC (Figure S7C,Table S5), as found previously (Cancer
Genome Atlas Research Network, 2012a;Walter et al., 2013).
It has also been associated with normal basal stem/progenitor cell function in other organs (e.g., breast, urogenital tract)
(Crum and McKeon, 2010). However, closer scrutiny of the
network neighborhood surrounding the TAp63 g and dNp63a complexes reveals that TP63 activation is more significant in the C2-squamous-like tumors than it is in the C4-BRCA/basals, and it involves a larger number of TP63 network targets (
Fig-ure 5A). Indeed, TP63 expression levels, in particular expression
of the oncogenicDNp63 isoform, are significantly higher in the C2-squamous-like subtype than in the C4-BRCA/basal tumors
(Figure 5B). Notably, we did not see TP63 network activity or
increased expression in the C9-OV subtype (Table S4A and
Figure 6B).
High TP53mutation rates characterize several tumor types including those represented by the COCA subtypes C4-BRCA/ basal, C9-OV, and C2-squamous-like (Table S2A). Surprisingly, our pathway and gene program analysis reveal a pattern of TP53 compensation in the C2-squamous-like tumors that distinguishes them from these other subtypes with highTP53 mutation rates. First, the C2-squamous-like tumors do not exhibit significant loss of PARADIGM-inferred TP53 activity
(Table S4A) and PARADIGM-SHIFT analysis (Ng et al., 2012)
pre-dicts loss-of-function ofTP53-truncating mutations (observed in 43% of C4-BRCA/basal, 38% of C9-OV, and 30% of C2-squamous-like cases) at a significantly higher degree in the C4-BRCA/basal and C9-OV subtypes compared to the C2-squamous-like subtype (Figure 5C). Second, the copy-number data when aligned with TP53 missense and truncating mutations reveals more loss of heterozygosity (LOH) in the C9-OV and C4-BRCA/basal than in the C2-squamous-like samples. The apparent higher TP53-pathway activity in C2-squamous-like tumors may be related to the expression of isoforms of related family members TP63 and/or TP73 (Figure 5B), which may compensate for TP53 mutation in the C2-squamous-like tumors as revealed by PARADIGM-Shift analysis (Figure 5C), and as supported by functional experimental data in HNSC lines and tumors (Lu et al., 2011). In HNSC, the function of TP63/73 in growth of HNSC is modulated in the presence of inflammatory factor TNF-aand cREL. Third, the transcriptional targets of TP53 shared with TP63/73 appear to be more highly expressed in the C2-squamous-like subtype than in the C9-OV or C4-BRCA/ basal subtype (Figure S7D). Indeed, hierarchical clustering of 33 TP53-related gene signatures subsets the C2-squamous-like, C4-BRCA/basal and C9-OV tumors predominantly by sub-type (left side dendrogram subtree: 99% C4-BRCA/basal/ C9-OV; right-side dendrogram subtree: 98% C2-squamous-like) (Figure 5D). However, with the exception of the C4-BRCA/ basal-like subtype, the levels of TP53 activity were not predictive of overall survival when restricted to the analysis within a subtype. For the C4-BRCA/basal case, the PARADIGM-Shift scores do provide a moderate predictive degree when only the TP53 truncating mutants are considered (p < 0.05). Interestingly, TP63/73 compensatory function has been linked to cisplatin chemo-sensitivity and survival in BRCA1-related triple-negative
breast cancers (Leong et al., 2007). These studies show the potential for p63/73 compensatory function for mutated or sup-pressed p53 in HNSCC and breast cancer, which has potential implications for targeted and standard therapy across these
malignancies. These data indicate that TP53/63/73 downstream activities are of potentially broader significance among the C2-squamous-like, C9-OV and C4-BRCA/basal subtypes, with similarly high TP53 mutation rates.
B A
C
D E
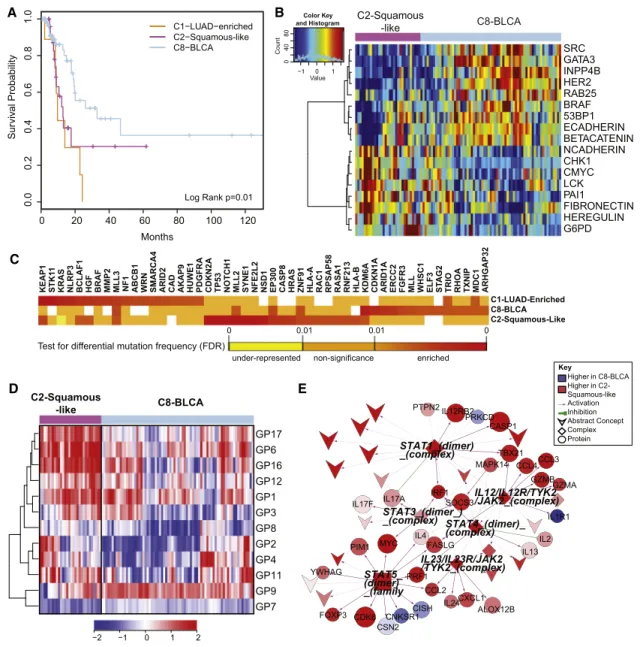
Figure 6. Divergence of the Bladder Cancer Samples across Multiple COCA Subtypes
(A) Kaplan-Meier survival analysis of bladder cancers within the C1-LUAD-enriched, C2-squamous-like, and C8-BLCA subtypes.
(B) Heatmap of 17 proteins expressed at significantly different levels within the C2-squamous-like relative to the C8-BLCA bladder cancer samples. Samples are arranged along the column by subtype (pink, C2; light blue, C8); and protein data are ordered along the rows by clustering. Rainbow color scale reflects magnitude (red, high; green, average; blue, low).
(C) HCD genes with differential mutation frequencies among the bladder samples clustered in COCA subtypes C1, C2, and C8. Differential frequencies reflect frequencies within, relative to frequencies outside of, the COCA subtype.
(D) Heatmap of 11 gene programs showing significant differential expression between the C2 and C8 bladder cancers. Samples are arranged along the column by subtype (pink, C2; light blue, C8), and gene programs are ordered along the rows by clustering. Red-blue color scale reflects magnitude (red, high; blue, low). (E) PARADIGM subnetwork of immune-related pathway biomarkers activated in C2 bladder cancers relative to the C8 subtype. Red-blue color scale represents relative activation (red, higher in C2; blue, higher in C8). Node size reflects relative significance, and node shape denotes feature type (diamond, multiprotein complex; v-shaped, cellular process; circle, genes; square, gene family). Color of an edge reflects type of interaction within the PARADIGM SuperPathway (purple arrows, activation; green T, inhibition).
Divergence of Bladder Cancer Subtypes
Despite a relatively small sample size (n = 120), bladder cancer was one of the most diverse of the tumor types, with samples clustering into 7 of the 11 major COCA subtypes (Table S6). The majority of the samples fell into three main COCA groups: 10 in C1–LUAD-enriched, 31 in C2-squamous-like, and 74 in C8–BLCA. Correlation with histology showed that the bladder samples in the C2-squamous-like group did, indeed, have evi-dence of squamous features, although most in that subtype had less than 50% squamous differentiation upon review by a team of five urological pathologists. The genomic classifications are consistent with evidence for diverse squamous, adenocarci-noma and other variant histologies in bladder carciadenocarci-noma (Willis
et al., 2013). Because it is one of the most diverse tissue-of-origin
tumor types in the Pan-Cancer-12 set, we looked at survival differences among the three main COCA groups of bladder can-cers. Samples in the C2-squamous-like and C1-LUAD-enriched groups showed significantly worse overall survival than those in the C8-BLCA group (Figure 6A;Figure S8B). The same distinc-tion held in proteomics-only analyses (Akbani et al., 2014), consistent with the worse overall survival of the other tumor types (LUAD, LUSC, and HNSC) that predominate in the C1-LUAD-enriched and C2-squamous-like subtypes.
We focused on the two larger subsets (C2-squamous-like and C8-BLCA) of bladder cancers, performing single-platform and integrated-platform comparisons. There are significant differ-ences in copy number (Figure S4A), protein expression (
Fig-ure 6B), mutations (Figure 6C), gene programs (Figure 6D), and
PARADIGM pathway networks (Figure 6E; Figure S8A). There is also a significant difference in 3p arm-level events; the C2-squamous-like subset shows the characteristic C2-squamous-like pattern of 3p loss, whereas the C8-BLCA subtype does not
(Figure 2B). Consistent with findings from the Pan-Cancer
prote-omics analysis (Akbani et al., 2014), higher HER2 and Rab25 protein levels are observed in the majority of the C8-BLCA cases relative to the C2-squamous-like bladder cases (Figure 6B). Conversely, markers of epithelial-to-mesenchymal transition (EMT) such as low E-cadherin, high fibronectin, and high N-cad-herin expression are apparent in the C2-squamous-like bladder cancers (Figure 6B). Both gene program and PARADIGM ana-lyses reveal differences in immune cell signatures; the bladder C2-squamous-like samples show higher levels of immune cell-associated signatures (Figure 6D and 6E). That difference, which has also been noted for lung squamous (Cancer Genome Atlas
Research Network, 2012a) and breast basal-like cancers (Prat
et al., 2010), could contribute to differences in outcome and
suggest therapeutic targets.
DISCUSSION
This integrated multiplatform analysis of 12 cancer types pro-vides independent and clinically relevant prognostic information above and beyond tumor stage and primary tissue-of-origin. Based on this study, one in ten cancer patients would be classified differently by this new molecular taxonomy versus our current tissue-of-origin tumor classification system. With respect to its therapeutic relevance, this proportion of poten-tially misclassified tumors is comparable to the rate ofEGFR
mutations in unselected non-small cell lung cancers (Lynch
et al., 2004; Paez et al., 2004) and ERBB2 amplifications among
all breast cancers (Cancer Genome Atlas Research Network,
2012c). If used to guide therapeutic decisions, this
reclassifi-cation would affect a significant number of patients to be con-sidered for nonstandard treatment regimens. In addition to identifying several new genomic and pathway insights between and within tissue-of-origin tumor types, this TCGA study pro-vides a public resource compendium of individual and integrated data sets from six different ‘‘omic’’ platforms, comprehensively characterizing >3,500 tumors and enabling researchers to explore new questions and analytical approaches that will perpetuate this discovery process.
It is possible that each COCA subtype reflects tumors arising from distinct cell types. In this new taxonomy, cancers of none-pithelial origin (e.g., neural, muscle, connective tissue) appear most different from epithelial tumors based on virtually all molec-ular platforms. The next most marked difference is apparent between epithelial cancers arising from basal layer-like cells (C2-squamous-like and C4-BRCA/basal) and those with secre-tory functions (C1-LUAD-enriched and C3-BRCA/Luminal). Molecular commonalities within a COCA subtype suggest com-mon oncogenic pathways. The C2-squamous-like cancers likely arise from a cellular subtype shared between environmentally exposed epithelial surfaces (e.g., oral cavity, lungs, and bladder); and malignancies from this cellular subtype possess a charac-teristic set of dysregulated genomic features, includingSOX2 and DNp63 high expression (by 3q26-29 amplification) with TP53mutation. Although some of these pathway features have previously been reported for normal squamous tissue develop-ment and homeostasis (Crum and McKeon, 2010) and in squamous cell carcinomas of specific organ sites (Maier et al.,
2011; Yang et al., 2011), they have not previously emerged
collectively as a broad subtype-defining phenotype from an integrated genomic analysis of thousands of different tumors. Cancers in the C2-squamous-like subtype appear most similar to those in the C4-BRCA/basal subtype, which in turn show pathway similarities to those in the C9-ovarian. While all three COCA subtypes exhibit comparably high TP53 mutation fre-quencies and expression of the GP17_Basal signaling gene program, the C2-squamous-like cancers are distinguished from all others by their significantly higher TP63 and TP73 ex-pression, both short (DNp63,DNp73) and long (TAp63, TAp73) isoforms, which may partially compensate TP53 mutation in this COCA subtype.
chronic cystitis and recurrent bladder inflections (or other phys-ical irritants) capable of inducing squamous metaplasia can predispose to squamous cancer of the bladder; and (2) the observation that early-stage bladder cancers are often respon-sive to intravesicular T cell induction by Bacillus-Calmette-Gue-rin (BCG) anti-TB vaccination. These findings strongly support a COCA subtype specific approach to postresection surveillance, adjuvant therapy and management of metastatic disease for bladder cancer patients.
Our results suggest that ‘‘cell-of-origin’’ rather than pathway-based features dominate the molecular taxonomy of diverse tumor types. There are several possible explanations for this observation. First and foremost, there are hundreds to thou-sands of features (mRNAs, proteins, microRNAs) with cell-type specific expression patterns, whereas pathways tend to regulate a much smaller subset of components—tens to hundreds of genes and their products. Second, pathways are often used in a cell-type-specific manner (e.g., APC-pathway in colon/ rectum); therefore, pathway-based features are likely subsumed by a cell-of-origin-based classification. Further research is needed to uncover pathway dependencies within a cell-of-origin context, of which many such relationships already exist (i.e., EGFR in LUAD, BRAF in Melanoma, etc.).
In closing, the refined molecular taxonomy we describe builds on centuries of pathology and genetic research. The data sets and results have been collected into a unified resource on Synapse to support integrative bioinformatics analysis. To sup-port navigation through these findings, the results have been made available through several portals including the UCSC Genome Browser, Gitools, and MD Anderson’s Next Generation Heatmaps (see theExtended Experimental Procedures). New methods to mine these data will enable ‘‘subtracting away’’ the dominant cell-of-origin signals to reveal information about pathway signaling and tumor microenvironments (e.g., stromal and immune components). This new taxonomy provides inde-pendent prognostic information above and beyond stage and tissue of origin, and further investigations may provide novel pathway-based insights with clues for personalizing therapy. Follow-up studies are needed to validate the findings reported here, and additional samples and tumor types will extend the integrated analysis. However, this initial PanCancer-12 analysis lays the groundwork for a richer classification of tumors into molecularly defined subtypes unlike all prior cancer classifica-tion systems.
EXPERIMENTAL PROCEDURES
Data for the complete set of 5,074 TCGA samples were obtained for the December 22, 2012 Pan-Cancer-12 data freeze from the Sage Bionetworks repository, Synapse. All data are made available through the Synapse website (https://www.synapse.org) and referenced with Synapse identifiers denoted as synN, where N provides a unique identifier within the Synapse system. All result files relevant for subtyping and downstream analyses are available from syn2468297.
Mutation Data and Predicted Driver Genes
Single-nucleotide variant calls for all samples in each of the 12 different tumor types were obtained from the official data freeze for each individual data type. Briefly, mutation calls were obtained from the separate TCGA working groups and processed to de-duplicate and re-annotate them using the ENSEMBLE
version 69 transcript database. The combined mutation annotation format (MAF) file is available from the Synapse resource.
One hundred and twenty-seven significantly mutated genes (SMGs) were identified in the entire sample set as those mutated more frequently than the background model according to MuSiC analysis as described in (Kandoth et al., 2013a). The SMG analysis was also performed by running MuSiC restricted to each COCA subtype. Lastly, genes whose mutations predomi-nantly occur within a given COCA subtype were identified by using the list of high-confidence drivers retrieved by the combined analysis of several signals of positive selection, as described in (Tamborero et al., 2013).
Cluster-of-Cluster Assignments
Subtypes derived from each of the six platforms—mRNA-Seq, miRNA-Seq, reverse-phase protein arrays (RPPA), structural copy-number alterations (SCNA), DNA methylation, and somatic mutations—were calculated as described in theExtended Experimental Proceduressection. Subtype calls for each of the six platforms were used to identify relationships among the different COCA subtypes and coded into a series of indicator variables for each subtype. The binary matrix was then used in the ConsensusClusterPlus R-package (Wilkerson and Hayes, 2010) to identify patterns of relationship among the samples. ConsensusClusterPlus was run with 80% sample resam-pling and 1,000 iterations of hierarchical clustering based on a Pearson correlation distance metric. More information on integrative subtyping analysis can be found inExtended Experimental Procedures, Section 2. The integrated COCA subtypes are available on the Synapse resource.
Survival Analysis for Pan-Cancer-12 and Squamous Bladder Samples
Overall survival was calculated for samples using information from the enroll-ment and follow-up forms available at the DCC and downloaded on June 17, 2013. Kaplan-Meier survival plots were generated with the package Survival in R. A log-rank test was used to assess significance.
SUPPLEMENTAL INFORMATION
Supplemental Information includes Extended Experimental Procedures, eight figures, seven tables, and five data files and can be found with this article online athttp://dx.doi.org/10.1016/j.cell.2014.06.049.
CONSORTIA
Jones, Steven J.M. Jones, Zhenlin Ju, Joonil Jung, Andre Kahles, Ari Kahn, Joelle Kalicki-Veizer, Divya Kalra, Krishna-Latha Kanchi, David W. Kane, Hoon Kim, Jaegil Kim, Theo Knijnenburg, Daniel C. Koboldt, Christie Kovar, Roger Kramer, Richard Kreisberg, Raju Kucherlapati, Marc Ladanyi, Eric S. Lander, David E. Larson, Michael S. Lawrence, Darlene Lee, Eunjung Lee, Semin Lee, William Lee, Kjong-Van Lehmann, Kalle Leinonen, Kristen M. Ler-aas, Seth Lerner, Douglas A. Levine, Lora Lewis, Timothy J. Ley, Haiyan I. Li, Jun Li, Wei Li, Han Liang, Tara M. Lichtenberg, Jake Lin, Ling Lin, Pei Lin, Wen-bin Liu, Yingchun Liu, Yuexin Liu, Philip L. Lorenzi, Charles Lu, Yiling Lu, Love-lace J. Luquette, Singer Ma, Vincent J. Magrini, Harshad S. Mahadeshwar, Elaine R. Mardis, Adam Margolin, Marco A. Marra, Michael Mayo, Cynthia McAllister, Sean E. McGuire, Joshua F. McMichael, James Melott, Shaowu Meng, Matthew Meyerson, Piotr A. Mieczkowski, Christopher A. Miller, Martin L. Miller, Michael Miller, Richard A. Moore, Margaret Morgan, Donna Morton, Lisle E. Mose, Andrew J. Mungall, Donna Muzny, Lam Nguyen, Michael S. Noble, Houtan Noushmehr, Michelle O’Laughlin, Akinyemi I. Ojesina, Tai-Hsien Ou Yang, Brad Ozenberger, Angeliki Pantazi, Michael Parfenov, Peter J. Park, Joel S. Parker, Evan Paull, Chandra Sekhar Pedamallu, Todd Pihl, Craig Pohl, David Pot, Alexei Protopopov, Teresa Przytycka, Amie Raden-baugh, Nilsa C. Ramirez, Ricardo Ramirez, Gunnar Ra¨tsch, Jeffrey Reid, Xiao-jia Ren, Boris Reva, Sheila M. Reynolds, Suhn K. Rhie, Jeffrey Roach, Hector Rovira, Michael Ryan, Gordon Saksena, Sofie Salama, Chris Sander, Netty Santoso, Jacqueline E. Schein, Heather Schmidt, Nikolaus Schultz, Steven E. Schumacher, Jonathan Seidman, Yasin Senbabaoglu, Sahil Seth, Saman-tha Sharpe, Ronglai Shen, Margi Sheth, Yan Shi, Ilya Shmulevich, Grace O. Silva, Janae V. Simons, Rileen Sinha, Payal Sipahimalani, Scott M. Smith, Heidi J. Sofia, Artem Sokolov, Mathew G. Soloway, Xingzhi Song, Carrie Soug-nez, Paul Spellman, Louis Staudt, Chip Stewart, Petar Stojanov, Xiaoping Su, S. Onur Sumer, Yichao Sun, Teresa Swatloski, Barbara Tabak, Angela Tam, Donghui Tan, Jiabin Tang, Roy Tarnuzzer, Barry S. Taylor, Nina Thiessen, Ves-teinn Thorsson, Timothy Triche Jr., David J. Van Den Berg, Fabio Vandin, Ri-chard J. Varhol, Charles J. Vaske, Umadevi Veluvolu, Roeland Verhaak, Doug Voet, Jason Walker, John W. Wallis, Peter Waltman, Yunhu Wan, Min Wang, Wenyi Wang, Zhining Wang, Scot Waring, Nils Weinhold, Daniel J. Wei-senberger, Michael C. Wendl, David Wheeler, Matthew D. Wilkerson, Richard K. Wilson, Lisa Wise, Andrew Wong, Chang-Jiun Wu, Chia-Chin Wu, Hsin-Ta Wu, Junyuan Wu, Todd Wylie, Liu Xi, Ruibin Xi, Zheng Xia, Andrew W. Xu, Da Yang, Liming Yang, Lixing Yang, Yang Yang, Jun Yao, Rong Yao, Kai Ye, Ko-suke Yoshihara, Yuan Yuan, Alfred K. Yung, Travis Zack, Dong Zeng, Jean Claude Zenklusen, Hailei Zhang, Jianhua Zhang, Nianxiang Zhang, Qunyuan Zhang, Wei Zhang, Wei Zhao, Siyuan Zheng, Jing Zhu, Erik Zmuda, Lihua Zou
AUTHOR CONTRIBUTIONS
K.A.H., C.Y., D.M.W., A.D.C., L.J.V.V., N.L.-B., P.W.L., L.D., G.B.M., C.C.B., C.M.P., and J.M.S. conceived and designed the experiments. K.A.H., C.Y., D.M.W., A.D.C., D.T., M.D.M.L., B.N., V.U., R.A., H.S., and B.J.R. developed key methodology. R.A., P.W.L., L.A.B., and G.B.M. acquired data sets. K.A.H., C.Y., D.M.W., A.D.C., D.T., A.C., S.N., M.D.L., B.N., M.D.M., V.U., C.K., R.A., H.S., N.L.-B., P.W.L., B.J.R., L.D., A.G.R., L.A.B., G.B.M., J.N.W., C.V.W., Z.C., E.A.C., C.C.B., C.M.P., and J.M.S. analyzed and interpreted data. J.Z., L.O., A.A.M., N.L.-B., R.A., J.N.W., and J.M.S. created data re-sources. K.A.H., C.Y., D.M.W., A.D.C., D.T., S.N., M.D.M.L., B.N., V.U., R.A., B.J.R., L.A.B., G.B.M., J.N.W., C.V.W., Z.C., E.A.C., C.C.B., C.M.P., J.M.S. drafted the manuscript or provided critical revisions. J.Z., C.C.B., C.M.P., and J.M.S. led and coordinated the project.
ACKNOWLEDGMENTS
We thank the thousands of patients and their loved ones who contributed materially, emotionally, and intellectually to this study. We thank D.A. Wheeler and M.L. Meyerson for scientific review of the work and M.P. Schroeder for help setting up Gitools. We thank K.R. Shaw, B.A. Ozenberger, H.J. Sofia, C.M. Hutter, and J.C. Zenklusen for administrative support. This work was supported by grants from the Chapman Foundation and Dell Foundation to J.N.W., a MD Anderson Physician Scientist Award to L.A.B., a Burroughs Welcome Career Award at the Scientific Interface to B.J.R., and support from
the following grants from the United States National Institutes of Health: K08 CA137153, K08 CA176561, P50 CA083639, R01 CA071468, R01 HG005690, R01 HG007069, R01CA180006, R21 CA155679, U01 CA168394, U24 CA143858, U24 CA143867-05, U24 CA143883, U24 CA143848, U24 CA143858, U24 CA143866, U54 CA112970, U24 CA143799, U24 CA143835, U24 CA143840, U24 CA143843, U24 CA143845, U24 CA143848, U24 CA143858, U24 CA143866, U24 CA143867, U24 CA143882, U24 CA143883, U24 CA144025, U54 HG003273, U54 HG003067, U54 HG003079, ZIA-DC-000073, ZIA-DC-000074, and P30 CA016672 for the MD Anderson CCSG Functional Proteomics Core.
Received: December 23, 2013 Revised: April 4, 2014 Accepted: June 23, 2014 Published: August 7, 2014
REFERENCES
Akbani, R., Ng, P.K., Werner, H.M., Shahmoradgoli, M., Zhang, F., Ju, Z., Liu, W., Yang, J.Y., Yoshihara, K., Li, J., et al. (2014). A pan-cancer proteomic perspective on The Cancer Genome Atlas. Nat Commun5, 3887.
Bhattacharya, A., Roy, R., Snijders, A.M., Hamilton, G., Paquette, J., To-kuyasu, T., Bengtsson, H., Jordan, R.C., Olshen, A.B., Pinkel, D., et al. (2011). Two distinct routes to oral cancer differing in genome instability and risk for cervical node metastasis. Clin. Cancer Res.17, 7024–7034.
Cancer Genome Atlas Research Network (2008). Comprehensive genomic characterization defines human glioblastoma genes and core pathways. Na-ture455, 1061–1068.
Cancer Genome Atlas Research Network (2011). Integrated genomic analyses of ovarian carcinoma. Nature474, 609–615.
Cancer Genome Atlas Research Network (2012a). Comprehensive genomic characterization of squamous cell lung cancers. Nature489, 519–525.
Cancer Genome Atlas Research Network (2012b). Comprehensive molecular characterization of human colon and rectal cancer. Nature487, 330–337.
Cancer Genome Atlas Research Network (2012c). Comprehensive molecular portraits of human breast tumours. Nature490, 61–70.
Cancer Genome Atlas Research Network (2013a). Comprehensive molecular characterization of clear cell renal cell carcinoma. Nature499, 43–49.
Cancer Genome Atlas Research Network (2013b). Genomic and epigenomic landscapes of adult de novo acute myeloid leukemia. N. Engl. J. Med.368, 2059–2074.
Cancer Genome Atlas Research Network (2014). Comprehensive molecular characterization of urothelial bladder carcinoma. Nature507, 315–322.
Chung, C.H., Bernard, P.S., and Perou, C.M. (2002). Molecular portraits and the family tree of cancer. Nat. Genet. Suppl.32, 533–540.
Crum, C.P., and McKeon, F.D. (2010). p63 in epithelial survival, germ cell sur-veillance, and neoplasia. Annu. Rev. Pathol.5, 349–371.
Friedl, P., and Gilmour, D. (2009). Collective cell migration in morphogenesis, regeneration and cancer. Nat. Rev. Mol. Cell Biol.10, 445–457.
Grilley-Olson, J.E., Hayes, D.N., Moore, D.T., Leslie, K.O., Wilkerson, M.D., Qaqish, B.F., Hayward, M.C., Cabanski, C.R., Yin, X., Socinski, M.A., et al. (2013). Validation of interobserver agreement in lung cancer assessment: he-matoxylin-eosin diagnostic reproducibility for non-small cell lung cancer: the 2004 World Health Organization classification and therapeutically relevant subsets. Arch. Pathol. Lab. Med.137, 32–40.
Herzog, A., Bian, Y., Vander Broek, R., Hall, B., Coupar, J., Cheng, H., Sowers, A.L., Cook, J.D., Mitchell, J.B., Chen, Z., et al. (2013). PI3K/mTOR inhibitor PF-04691502 antitumor activity is enhanced with induction of wild-type TP53 in human xenograft and murine knockout models of head and neck cancer. Clin. Cancer Res.19, 3808–3819.