TABLE OF CONTENTS
INTRODUCTION
2
THE IMPORTANCE OF COMMUNITY ENGAGEMENT IN PUBLIC HEALTH AND PLANNING
2
P
UBLICH
EALTH2
P
LANNING4
EVALUATING COMMUNITY ENGAGEMENT: A PUBLIC HEALTH STRENGTH, A PLANNING
WEAKNESS
7
EVALUATION OF COMMUNITY ENGAGEMENT
10
B
ACKGROUND10
COMMUNITY ENGAGEMENT ACTIVITY DESCRIPTIONS
10
P
URPOSE10
A
CTIVITY1
11
A
CTIVITY2
11
A
CTIVITY3
12
EVALUATION FOCUS
12
S
ELECTION OFE
VALUATIONC
OMPONENTS12
E
VALUATIONQ
UESTIONS,
B
YE
VALUATIONC
OMPONENT ANDE
NGAGMENTA
CTIVITY12
S
ELECTEDD
ATAS
OURCES ANDA
NALYSISM
ETHODS16
RESULTS AND INTERPRETATION
23
A
CTIVITY1:
E
NVIRONMENTALS
CANT
RAINING28
A
CTIVITY2:
I
NTERACTIVEE
NVIRONMENTALS
CAN29
A
CTIVITY3:
S
OCIOECONOMIC ANDL
OCALP
OLICYC
ONTEXTT
RAINING30
RECOMMENDATIONS
31
I
MPLEMENTATIONR
ECOMMENDATIONS32
E
VALUATIONR
ECOMMENDATIONS32
FUTURE ACTIONS WITH THIS YOUTH ORGANIZATION
32
DISCUSSION AND LIMITATIONS
33
REFERENCE LIST
34
2
INTRODUCTION
This report provides a unique perspective on the idea of measuring community engagement, explores the gaps in evaluation and the absence of indicators in the planning field, and applies a public health evaluation framework to a planning process. The purpose of this project is to apply a standardized method to evaluate community engagement and assess pros and cons of using this method as opposed to other current methods of evaluating engagement.
THE IMPORTANCE OF COMMUNITY ENGAGEMENT IN PUBLIC HEALTH AND PLANNING
This section serves to justify the use of public health frameworks in the planning field because of the commonality in goals around community engagement in research and practice.
PUBLIC HEALTH
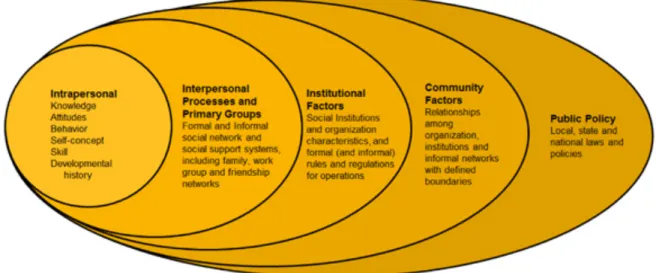
In public health, there are two ideologies in particular that emphasize the importance of community engagement: the Social Cognitive Theory and the Health Impact Pyramid.
FIGURE 1 THE SOCIAL ECOLOGICAL FRAMWORK FROM ACHA.ORG, ADAPTED FROM MCEROY, KR., STECKLER, A., AND BIBEADU, D. (1988)
The Health Impact Pyramid model (Figure 2) illustrates how public health extends beyond traditional health care, and that health is determined by “the fundamental composition organization, and operation of society” (Frieden, 2010). This model indicates that most effective health interventions reach the most number of people involve changing socioeconomic determinants such as poverty, sexism, racism, or educational attainment. The second most effect health intervention involves changing the environmental context such as providing more physical access to a service or removing or limiting a healthy service or product from the environment. Less effective health interventions involve more direct services; although they have greater personal, individual benefit, they reach the least number of people and thus do not have extensive population shifts in behavior (Frieden, 2010). Interventions that target the social, political, and economic systems and structures involving public action or policy could involve planning processes, as described above. For example, housing policies that work to mitigate segregation or perpetuate racist and classist social structures can eventually lead to more equitable health outcomes. Interventions that change the environmental context could look like providing more bikeways and walkways in a neighborhood or building homes away from floodplains. Whatever the specific intervention is, public health theory indicates that advocacy and social change is a crucial step in changing the context of lives to impact health.
FIGURE 2 HEALTH IMPACT PYRAMID FROM FRIEDEN (2010)
4
PLANNINGThe planning field also values community engagement; however, there is a complexity in the definition of engagement and a lack of evaluation that make it difficult to fully understand its role in planning (Kinzer, 2016). This void in research is due to multiple reasons, including the nuances of what participation involves, varied timelines of participation, and variety of different evaluations of engagement.
Planners tend to agree that public participation is a crucial step in planning; however, there are different definitions and understandings of what public participation includes and looks like. Specific types of public participation are long recognized as more equitable in the field of planning (Arnstein, 1969). Moving towards a model of engagement that empowers citizens and equalizes power, gives them decision-making authority, and involves cross learning and exchanging information, is encouraged (Moote, 1997). Although this idea has limitations such as how to realistically balance citizen control with knowledge from experts in the field, the idea of citizen engagement in planning has carried through to ensure that planning takes into account local knowledge, needs, and assets. A popular method of evaluating engagement involves quantifying the number of meetings held and the number of attendees at these meetings; however, this fails to capture the nuances of engagement (Kinzer, 2016; Alfasi, 2003). This method fails to evaluate if participants feel like they can express themselves freely or if they are truly part of the decision-making processes (Alfasi, 2003). Without a clear definition of participation, planners can ‘count’ various types of activities as engagement despite understanding how engaged attendees were at these meetings; while some planner may note attending meetings as participation, others might note speaking at these meetings as participation (Alfasi, 2003). Relying on quantifying number of meetings also fails to evaluate the composition of who attends the meetings. Groups underrepresented, or specific interest groups may take over the meetings and push their vision and values over the voice of others. (Alfasi, 2003). Participants should include a representative sample of the community to avoid domination by one interest group; failing to do this leads to biases goals that may not encompass the vision of values of the larger community (Loh, 2012; Moote, 1997).
Some planners use community-based participatory planning techniques (similar to CBPR, presented above) which involves engagement with citizens as early as possible to build plans that help their community recover equitably and meet local needs, and some note the necessity of incorporating citizen participation in pre-planning stages because plans that lack ownership and may actually create opposition even though it may be in the best interest of the community to enact suggestions from the plans (Berke et al., 2014; Berke and Campanella, 2016). However, there is uncertainty of the exact timeline of participation (how long to involve the community) and how to evaluate this participation over time. There is inconsistency of participation practices and evaluation across different planning projects and research (Moote, 1997). It is generally encouraged that participation and evaluation of that participation should span over a long period of time and include pre-planning, planning, and implementation; evaluation should consider this continuity of participation in addition to the other factors that define engagement presented above (Kinzer, 2016; Moote, 1997). Effective community engagement that starts early could lead to more room for evaluation in the implementation stage; indicators could include assessing if goals in plans align with community vision, if the community is invested in land use changes, and if the community is involved in the actual implementation and action steps goals (Loh, 2012; Kinzer, 2016).
statistical or spatial analysis to quantify participation; however, these methods fail to address the various nuances mentioned above (Kinzer, 2016; Alfasi, 2013). On the other hand, some studies use pure qualitiatve methods such as ethnographic observations over a ten year period; although this method allows for assessing relationships, power dynamics, and shifts in priorities over time, it takes an extensive amount of time and resources to conduct (Tauxe, 1995). A mixed-methods approach is ideal for evaluating engagement.
Researchers have used mixed-method assessments to look at the development of a hazard mitigation plan, which is created to mitigate negative impacts on a community after a disaster to aid recovery and ideally involves combining knowledge from scientific researchers and community residents. A study by Horney et al. identified indicators and evaluated how truly engaged the community was in the creation of a plan (2015). Researchers assessed community engagement in Bertie County, North Carolina through a mixed methods study involving qualitative interview methods and quantitative demographic analysis. First, the study identified who among their population was the most socially vulnerable categorizing demographic statistics including those living in poverty, people of color, children, elderly, and disabled or those with other special needs (Horney et al., 2015). Next, researchers assessed how vulnerable these groups were hazards by interviewing participants about disasters they had experienced within their lifetime and about financial assistance and damages (Horney et al., 2015). Finally, to assess engagement in the development of the hazard mitigation plan, community members were asked if they knew about the plan, if they had participated in any meetings or events regarding plan development, whether they were aware about town investments outlined in the plan, and if they were aware of any policies that Bertie County had implemented since 2004 to improve disaster resilience (Horney et al., 2015). The results indicated that those who were identified as socially vulnerable either had low participation in and awareness of the planning process or they had low awareness of policies outlined in or any outcomes from the hazard mitigation plan. Although this study does show how indicators can be used to qualitatively and quantitatively measure community participation, there is an absence of indicators related to meeting the needs of the local community. This is an example of how mixed methods can be applied to assess the process of community participation; however, a process of engagement should reach farther than awareness and education. To ensure a truly equitable process and that local communities’ needs are met, it is imperative to include indicators that assess empowerment and partnership to avoid tokenism and surface-level participation. For example, indicators around self-efficacy could look like a number of individuals feeling empowered to advocate for change, or a number of individuals feeling invested in changes that occur in their communities. It should be acknowledged that community needs may or may not align with expert knowledge of long-term safety practices around recovery; however, a true partnership can create the space for this conversation to take place.
6
There have been attempts to create a standard for evaluating planning techniques and implementation, that include participation; however, this idea is novel in the United States. A review of standards for evaluating community engagement turns out sparse results for process conducted in the US; however, there is a detailed community planning toolkit for use in Scotland that details standards for engagement, designing an optimal engagement process, and tools to evaluate various methods of engagement (Community Places, 2014). This toolkit was created through a collaboration of various stakeholders including government workers and community members (Community Places, 2014). Similarly, the Australian government also has a community engagement evaluation guide, specific to use of involving locals in land use planning around natural resource management (Australian Government Land and Coasts, n.d.) Disaster recovery is one subset of planning in the US where indicators are slowly being used to measure outcomes and processes. A paper by Horney et al. describes one checklist of disaster recovery indicators that the research team designed due to a lack of existing checklists; this list was inspired by an initial list of indicators categorized according to FEMA’s Recovery Support Functions and Recovery Mission Area Core Capabilities (2016). Although the study cited that the validation process to determine indicators had some limitations, it still was a successful attempt at creating a Community Recovery Checklist in the hopes that it can be used by other scientists, practitioners, and policy-makers. This list includes four themes of indicators to measure outcomes: financial, process, social, and public sector (Horney and Dwyer et al., 2016). The financial theme covers topics relating to recovery fund management and economic restoration. Indicators include number of total businesses, number of closed businesses, total taxable income generated by businesses, and amount of insurance payments received. The process theme covers topics relating to what the disaster recovery planning process looked like, and involved measures of community engagement. Such of examples of indicators include number of public meetings held, number of attendees at these meetings, number of plans that address vulnerable populations, and types of outreach methods used to engage the public in these discussions. The social theme contains topics related to assessing recovery at the individual and community levels around housing, services, cultural resources, and demographics and included indicators such as number of physicians available to the public, percentage of the population still living in temporary housing, and number of reconstructed cultural and heritage sites. Finally, the public sector theme covers topics related to civic engagement, public infrastructure, and government processes. Indicators include number of registered voters, number of students enrolled in community schools, and number of reestablished transit systems and infrastructure. The checklist does include some process indicators to quantify how many meetings were held and how many people attended; however, there are no indicators to assess how community members actually felt about the meetings and overall engagement level. These indicators assume that just because an activity was completed, that it was effective – a major gap in the field. Similarly, just because different outreach methods were used does not mean that they covered multiple types of populations or that they were well received by or accessible to community members. Additionally, because this checklist was designed only recently, there are no examples of it being tested in the field.EVALUATING COMMUNITY ENGAGEMENT: A PUBLIC HEALTH STRENGTH, A
PLANNING WEAKNESS
The public health field provides established tools and indicators to address the gaps listed above. There are many different types of evaluations, and one might opt to use one or multiple types when evaluating health programs, or this case, plans and their outcomes. An impact evaluation is conducted at the very end and long after the project is completed because it assesses the extent to which the project fulfilled its goals in leading to an overall long-term change in the population or environment; these lead to powerful statistics that can support policy and funding decisions (“CDC3,” n.d). A process evaluation examines the stages involved in creating a project; it shows how efficiently and successfully the program is working, the degree to which the project is being implemented as written, and how acceptable and accessible the project is to its intended audience (“CDC3,” n.d). This type of evaluation is used to assess community participation. An outcome evaluation measures effects on the intended population and environment during and shortly after the project, both negative and positive (“CDC3 n.d). Outcome and impact evaluations are similar and the names are often interchanged in the field, but they serve two different purposes. Outcome evaluations can measure if there are unexpected outcomes, if the project’s outcomes are linked with other projects happening at the same time or for the same people, or even if the project’s outcomes are tied to the timing it was implemented; the next step would be to conduct an impact assessment to see if the outcomes occurring can be attributed to the project itself (UNDP, 2011).
According to public health literature, there are key steps involved in developing an effective evaluation report that presents findings, analysis, and recommendations for a project moving forward. This differs from evaluation reports in the planning literature in that they all follow a similar format and includes organizational tools that help researchers and implementers think through the nuances, purposes, complexities of their activities presented to the public. In addition, this framework allows researchers and planners to define their evaluation focus and main evaluation questions. This standard format, as described above, is useful to compare across projects, geographic location, and time. The Center for Disease Control shares a framework that can be tailored and applied to community engagement activities for planning (“CDC,” 2011). There are main elements that should be included in an evaluation report, including a program description, a logic model, and evaluation focus, data sources and methods, results and interpretation, and dissemination and sharing (Table 1). A logic model facilitates the development of evaluation procedure and report; it aids in identifying what kinds of indicators should be designed and what outcomes should be measured because it includes (CDC, 2011):
• inputs: resources required for program implementation
• activities: specific strategies or sub-parts of a program or project • outputs: direct and immediate products of project’s activities
8
Elements of an evaluation reportProgram Description Presents the theories and rationale behind a project; includes the logic model and a narrative of the project
Logic Model A visual representation of the projects inputs, activities, outputs, and outcomes
Evaluation Focus Justifies how the evaluation focus was selected and presents criteria for prioritizing evaluation questions
Data Sources and Methods Includes indicators, where they are collected from, and how they will be analyzed
Results, Conclusions, and Interpretation Describes how data was interpreted and the interpretation of the data Use, Dissemination, and Sharing Describes a plan for sharing the results with various stakeholders, how
the results will be used and by whom, and how the project will continued to be monitored and updated if needed
Table 1 describes the various elements of an effective evaluation report (“CDC,” 2011)
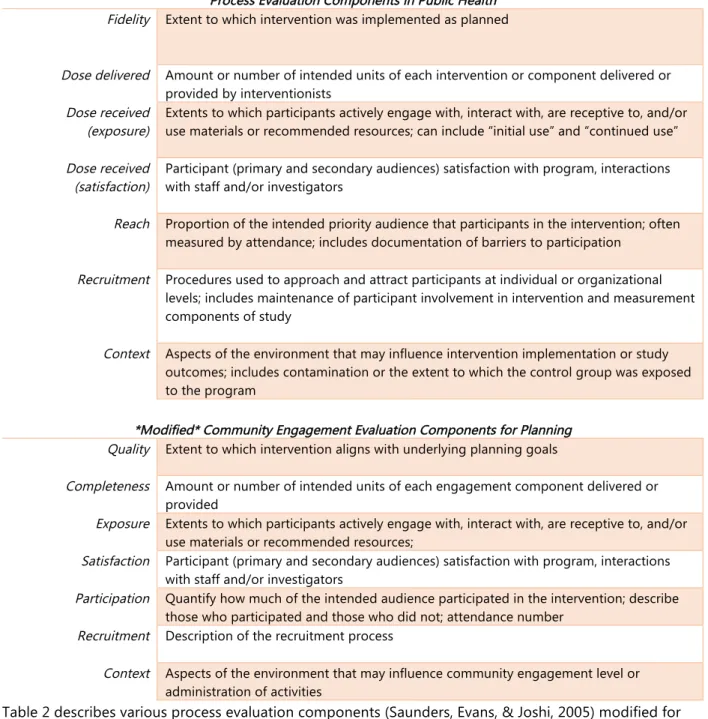
Process Evaluation Components in Public Health Fidelity Extent to which intervention was implemented as planned
Dose delivered Amount or number of intended units of each intervention or component delivered or provided by interventionists
Dose received (exposure)
Extents to which participants actively engage with, interact with, are receptive to, and/or use materials or recommended resources; can include “initial use” and “continued use”
Dose received (satisfaction)
Participant (primary and secondary audiences) satisfaction with program, interactions with staff and/or investigators
Reach Proportion of the intended priority audience that participants in the intervention; often measured by attendance; includes documentation of barriers to participation
Recruitment Procedures used to approach and attract participants at individual or organizational levels; includes maintenance of participant involvement in intervention and measurement components of study
Context Aspects of the environment that may influence intervention implementation or study outcomes; includes contamination or the extent to which the control group was exposed to the program
*Modified* Community Engagement Evaluation Components for Planning Quality Extent to which intervention aligns with underlying planning goals
Completeness Amount or number of intended units of each engagement component delivered or provided
Exposure Extents to which participants actively engage with, interact with, are receptive to, and/or use materials or recommended resources;
Satisfaction Participant (primary and secondary audiences) satisfaction with program, interactions with staff and/or investigators
Participation Quantify how much of the intended audience participated in the intervention; describe those who participated and those who did not; attendance number
Recruitment Description of the recruitment process
Context Aspects of the environment that may influence community engagement level or administration of activities
Table 2 describes various process evaluation components (Saunders, Evans, & Joshi, 2005) modified for evaluating community engagement in planning. These modifications are based off consideration of what ideal community engagement should look like (Alfasi, 2003; Moote, 1997)
10
EVALUATION OF COMMUNITY ENGAGEMENTBACKGROUND
The Geographic Health Equity Alliance (GHEA), through CADCA (Community Anti-Drug Coalitions of America) partners with Counter Tools and other stakeholders to address geographic health inequities around tobacco use all over the country. A current goal of GHEA is to assess the problem of tobacco retailers being located in or near areas that have high concentration of youth and to utilize the power an existing youth coalition in Casey County to see how they could get involved with local land use policy conversations. Ultimately, this report will apply a public health evaluation framework to assess: What are the processes and outcomes associated with community engagement activities directed at expanding knowledge and skills around identifying tobacco retailers and understanding the larger socioeconomic and political context of Casey County, Kentucky?
This assessment will examine how engaged the youth actually feel in the process of getting to know their community, if they feel empowered to make changes, if they feel like stakeholders in place-related issues in their community, and if their attitudes and knowledge around tobacco retailers changed. The final results will be disseminated to GHEA in the form of a guidance document. This guidance document will include an analysis of various indicators around community engagement, the activities, the questionnaires, the methodology, and the evaluation results and analysis. The document will also provide recommendations and best practices to GHEA on how to proceed working in Casey County and with the youth organization to address land use issues relating to large-scale tobacco policy.
COMMUNITY ENGAGEMENT ACTIVITY DESCRIPTIONS
PURPOSE
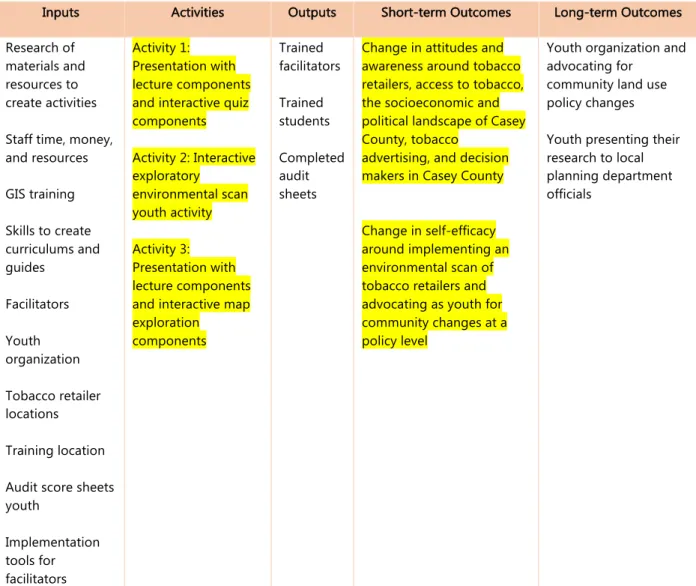
Inputs Activities Outputs Short-term Outcomes Long-term Outcomes
Research of materials and resources to create activities
Staff time, money, and resources
GIS training
Skills to create curriculums and guides Facilitators Youth organization Tobacco retailer locations Training location
Audit score sheets youth Implementation tools for facilitators Activity 1: Presentation with lecture components and interactive quiz components
Activity 2: Interactive exploratory environmental scan youth activity Activity 3: Presentation with lecture components and interactive map exploration components Trained facilitators Trained students Completed audit sheets
Change in attitudes and awareness around tobacco retailers, access to tobacco, the socioeconomic and political landscape of Casey County, tobacco
advertising, and decision makers in Casey County
Change in self-efficacy around implementing an environmental scan of tobacco retailers and advocating as youth for community changes at a policy level
Youth organization and advocating for
community land use policy changes
Youth presenting their research to local planning department officials
Table 3. A logic Model for the Community Engagement Activities, highlighted sections will be evaluated*
ACTIVITY 1
First, youth advocates must be trained in environmental scan techniques (for Activity 2) using the resources available via Counter Tobacco, specifically the Standardized Tobacco Assessment for Retail Settings (STARS) survey and surveillance tools and training materials (Counter Tobacco, 2016). These powerpoints have been pre-made and are publicly available by Counter Tobacco but tailored to meet the needs of the youth (ie. Remove materials they have already covered to avoid redundancy). The purpose of this training is to provide educational information about recognizing advertising patterns on the outside of tobacco retailers and interactive activities for youth to practice skills. This activity will be administered by GHEA on-the-ground staff.
ACTIVITY 2
12
to school and count tobacco advertisements (“Youth and Community Engagement,” 2016). Youth tally tobacco products names, brands, prices, and other relevant information that is visible to them from outside the store. This activity helps youth learn more about what is available and visible to them in their environment and to provide them with more context of what ‘access’ to tobacco looks like. This activity will be administered by GHEA on-the-ground staff.ACTIVITY 3
The existing political, social, and economic landscape of Casey County will be examined via ArcMap Desktop 10.3 and CartoDb. This will involve identifying census information (at the block group level) of race and income demographic information and spatially mapping it. Next, tobacco use within the selected city and state will be identified. This information will be available via Youth Tobacco Surveys administered by the state’s public health department’s tobacco use-related division. Finally, the youth advocacy organization will be identified. I will also provide an assessment of who is/are the designated enforcement agent(s) of the campus wide smoke free ordinance in the Casey County school and coalition of interest. This information will be presented to youth via an interactive powerpoint presentation with discussion. The purpose of this presentation is to provide more context of the youth’s environment. Youth will also learn about local ordinances in their areas to see what they look like and what they include. Youth will also learn about the leadership structure to see where the decision-making powers lie. This presentation will be administered by GHEA staff on-the-ground.
EVALUATION FOCUS
SELECTION OF EVALUATION COMPONENTS
The first step in selecting evaluation components is to review the project description and logic model to determine which components of the community engagement activities are most essential to its short- and long-term goals and how each of these could be most thoroughly evaluated. For each program component, evaluation measures were selected based on what can reasonably be assessed based on available data sources and the time limit. The program was implement in December, surveys were sent in January, and the analysis is to be completed in February.
To assess the functionality of program components that hinged purely on completion, rather than quality (administering all parts of an activity), dose delivered is measured. To assess the functionality of other program components that were more quality-dependent (such as the presentations and walking tour content and interactive elements), dose received (satisfaction) is measured. In addition, the facilitators can comment on more process components such as their satisfaction with the training guide and materials pre-prepared for them (satisfaction), and how many attended (reach), and contextual factors like barriers and facilitators to administering the activities.
EVALUATION QUESTIONS, BY EVALUATION COMPONENT AND ENGAGMENT ACTIVITY
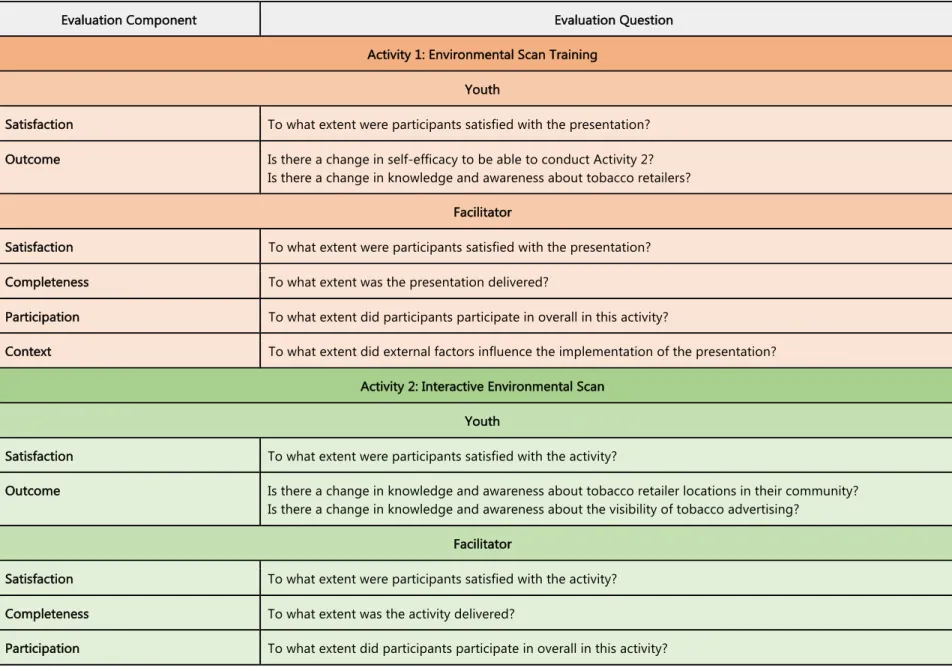
Table 4: Initial Evaluation Questions
Evaluation Component Evaluation Question
Activity 1: Environmental Scan Training
Youth
Satisfaction To what extent were participants satisfied with the presentation?
Outcome Is there a change in self-efficacy to be able to conduct Activity 2?
Is there a change in knowledge and awareness about tobacco retailers?
Facilitator
Satisfaction To what extent were participants satisfied with the presentation?
Completeness To what extent was the presentation delivered?
Participation To what extent did participants participate in overall in this activity?
Context To what extent did external factors influence the implementation of the presentation?
Activity 2: Interactive Environmental Scan
Youth
Satisfaction To what extent were participants satisfied with the activity?
Outcome Is there a change in knowledge and awareness about tobacco retailer locations in their community?
Is there a change in knowledge and awareness about the visibility of tobacco advertising?
Facilitator
Satisfaction To what extent were participants satisfied with the activity?
Completeness To what extent was the activity delivered?
Context To what extent did external factors influence the implementation of the presentation?
Activity 3: Socioeconomic and Local Policy Context Training
Youth
Satisfaction To what extent were participants satisfied with the presentation?
Quality To what extent was the training implemented as planned, in terms of avoiding tokenism and approaching
partnership and empowerment?
Outcome Is there a change in knowledge and awareness about the political, social, and economic landscape of Casey County?
Is there a change in knowledge and awareness about the decision-making structure of the school system?
Is there a change in knowledge and awareness about planning-related tools that be utilized for community change? Is there a change in self-efficacy around being able to advocate for community change as youth?
Facilitator
Satisfaction To what extent were participants satisfied with the presentation?
Completeness To what extent was the presentation delivered?
Participation To what extent did participants participate in overall in this activity?
SELECTED DATA SOURCES AND ANALYSIS METHODS
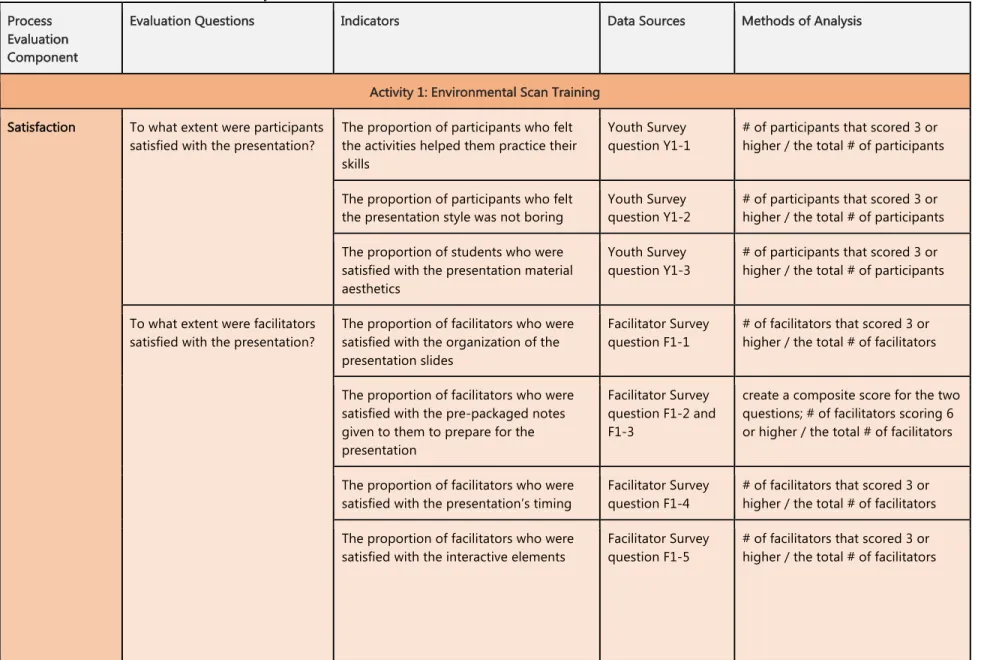
To answer the above evaluation questions, specific indicators and surveys were designed. The indicators for this analysis are included in an appendix. Table 5 describes the methodology for analysis. Some evaluation questions were excluded due to a lack of data sources; this process is discussed further in Recommendations.
Table 5. Selected Data Sources and Analysis Methods Process
Evaluation Component
Evaluation Questions Indicators Data Sources Methods of Analysis
Activity 1: Environmental Scan Training
Satisfaction To what extent were participants satisfied with the presentation?
The proportion of participants who felt the activities helped them practice their skills
Youth Survey question Y1-1
# of participants that scored 3 or higher / the total # of participants
The proportion of participants who felt the presentation style was not boring
Youth Survey question Y1-2
# of participants that scored 3 or higher / the total # of participants
The proportion of students who were satisfied with the presentation material aesthetics
Youth Survey question Y1-3
# of participants that scored 3 or higher / the total # of participants
To what extent were facilitators satisfied with the presentation?
The proportion of facilitators who were satisfied with the organization of the presentation slides
Facilitator Survey question F1-1
# of facilitators that scored 3 or higher / the total # of facilitators
The proportion of facilitators who were satisfied with the pre-packaged notes given to them to prepare for the presentation
Facilitator Survey question F1-2 and F1-3
create a composite score for the two questions; # of facilitators scoring 6 or higher / the total # of facilitators
The proportion of facilitators who were satisfied with the presentation’s timing
Facilitator Survey question F1-4
# of facilitators that scored 3 or higher / the total # of facilitators
The proportion of facilitators who were satisfied with the interactive elements
Facilitator Survey question F1-5
18
ProcessEvaluation Component
Evaluation Questions Indicators Data Sources Methods of Analysis
Completeness To what extent was the presentation delivered?
Proportion of participants who received all Activity 1 components
Facilitator Survey question F1-6
Match participants to facilitator; # of participants received ALL
components / the total # of participants; per facilitator
Participation To what extent did participants participate in overall in this activity?
Proportion of participants whose received Activity 1
Facilitator Survey question F1-7 and F1-8
Match participants to facilitator; # of youth present for activity/# of total youth; per facilitator
Context To what extent did external factors influence the implementation of the presentation?
Proportion of facilitators that indicated specific challenges during the
implementation of Activity 1
Facilitator Survey question F1-9
Qualitative analysis of open-answer question
Proportion of facilitators that indicated proposed changes to Activity 1
Facilitator Survey question F1-10
Qualitative analysis of open-answer question
Outcome Evaluation Questions Indicators Data Sources Methods of Analysis
Self-efficacy Is there a change in self-efficacy to be able to conduct Activity 2?
Proportion of participants that indicated an improvement in self-efficacy
Youth Survey question 4, Y1-5, and Y1-6
create a composite score for the three questions; # of participants scoring 24 or higher/ the total # of participants
Knowledge and awareness
Is there a change in knowledge and awareness about tobacco retailers?
Proportion of participants that indicated an improvement in knowledge and awareness
Youth Survey question 7, Y1-8, Y1-9, and Y1-10
Process Evaluation Component
Evaluation Questions Indicators Data Sources Methods of Analysis
Activity 2: Interactive Environmental Scan
Satisfaction To what extent were participants satisfied with the activity?
The proportion of participants who felt the presentation style was not boring
Youth Survey question Y2-1
# of participants that scored 3 or higher / the total # of participants
The proportion of participants who enjoyed the interactivity
Youth Survey question Y2-2 and Y2-3
create a composite score for the two questions; # of participants scoring 6 or higher/ the total # of participants
To what extent were facilitators satisfied with the activity?
The proportion of facilitators who were satisfied with the activity instructions
Facilitator Survey question F2-1
# of facilitators that scored 3 or higher / the total # of participants
The proportion of facilitators who felt the pre-activity logistics were easy to carry out
Facilitator Survey question F2-2, F2-3, and F2-4
create a composite score for the three questions; # of participants scoring 9 or higher/ the total # of participants
The proportion of facilitators who enjoyed the interactivity
Facilitator Survey question F2-5
# of facilitators that scored 3 or higher / the total # of participants
Completeness To what extent was the presentation delivered?
Proportion of participants who received all Activity 2 components
Facilitator Survey question F2-6
Match participants to facilitator; # of participants received ALL
components / the total # of participants; per facilitator
Participation To what extent did participants participate in overall in this activity?
Proportion of participants whose received Activity 2
Facilitator Survey question F2-7 and F2-8
Match participants to facilitator; # of youth present for activity/# of total youth; per facilitator
Context To what extent did external factors influence the
Proportion of facilitators that indicated specific challenges during the
implementation of Activity 2
Facilitator Survey question F2-9
20
implementation of thepresentation?
Proportion of facilitators that indicated proposed changes to Activity 2
Facilitator Survey question F2-10
Qualitative analysis of open-answer question
Outcome Evaluation Questions Indicators Data Sources Methods of Analysis
Knowledge and awareness
Is there a change in knowledge and awareness about tobacco retailers?
Proportion of participants that indicated an improvement in knowledge and awareness
Youth Survey question 4, Y2-5, and Y2-6
create a composite score for the three questions; # of participants scoring 24 or higher/ the total # of participants
Is there a change in knowledge and awareness about tobacco advertising?
Proportion of participants that indicated an improvement in knowledge and awareness
Youth Survey question 7, Y2-8, and Y2-9
create a composite score for the three questions; # of participants scoring 24 or higher/ the total # of participants
Process Evaluation Component
Evaluation Questions Indicators Data Sources Methods of Analysis
Activity 3: Socioeconomic and Local Policy Context Training
Satisfaction To what extent were participants satisfied with the presentation?
The proportion of participants who felt the presentation style was not boring
Youth Survey question Y3-1
# of participants that scored 3 or higher / the total # of participants
The proportion of students who were satisfied with the presentation material aesthetics
Youth Survey question Y3-2
# of participants that scored 3 or higher / the total # of participants
To what extent were facilitators satisfied with the presentation?
The proportion of facilitators who were satisfied with the organization of the presentation slides
Facilitator Survey question F3-1
# of facilitators that scored 3 or higher / the total # of facilitators
The proportion of facilitators who were satisfied with the pre-packaged notes given to them to prepare for the presentation
Facilitator Survey question F3-2 and F3-3
The proportion of facilitators who were satisfied with the presentation’s timing
Facilitator Survey question F3-4
# of facilitators that scored 3 or higher / the total # of facilitators
Process Evaluation Component
Evaluation Questions Indicators Data Sources Methods of Analysis
Quality To what extent was the training implemented as planned, in terms of avoiding tokenism and approaching partnership and
empowerment?
The proportion of participants who felt like respected partners in the process
Youth Survey question Y3-3
# of participants that scored 3 or higher / the total # of participants
The proportion of participants who feel empowered
Youth Survey questions Y3-4 and Y3-5
create a composite score for the two questions; # of facilitators scoring 6 or higher / the total # of facilitators
Completeness To what extent was the presentation delivered?
Proportion of participants who received all Activity 3 components
Facilitator Survey question F3-5
Match participants to facilitator; # of participants received ALL
components / the total # of participants; per facilitator
Participation To what extent did participants participate in overall in this activity?
Proportion of participants whose received Activity 3
Facilitator Survey question F3-6 and F3-7
Match participants to facilitator; # of youth present for activity/# of total youth; per facilitator
Context To what extent did external factors influence the implementation of the presentation?
Proportion of facilitators that indicated specific challenges during the
implementation of Activity 3
Facilitator Survey question F3-8
Qualitative analysis of open-answer question
Proportion of facilitators that indicated proposed changes to Activity 3
Facilitator Survey question F3-9
22
Outcome Evaluation Questions Indicators Data Sources Methods of AnalysisKnowledge and awareness
Is there a change in knowledge and awareness about the decision-making structure of the school system?
Proportion of participants that indicated an improvement in knowledge and awareness
Youth Survey question Y3-6
# of participants scoring 3 or higher/ the total # of participants
Is there a change in knowledge and awareness about the political, social, and economic landscape of Casey County?
Proportion of participants that indicated an improvement in knowledge and awareness
Youth Survey question Y3-7 and Y3-8
create a composite score for the two questions; # of participants scoring 6 or higher/ the total # of participants
Is there a change in knowledge and awareness about planning-related tools that be utilized for community change?
Proportion of participants that indicated an improvement in knowledge and awareness
Youth Survey question 9, 10, 11, and Y3-12
create a composite score for the four questions; # of participants scoring 12 or higher/ the total # of participants
Self-efficacy Is there a change in self-efficacy around being able to advocate for community change as youth?
Proportion of participants that indicated an improvement in self-efficacy
Youth Survey question 13, Y3-14, Y3-5, and Y3-15
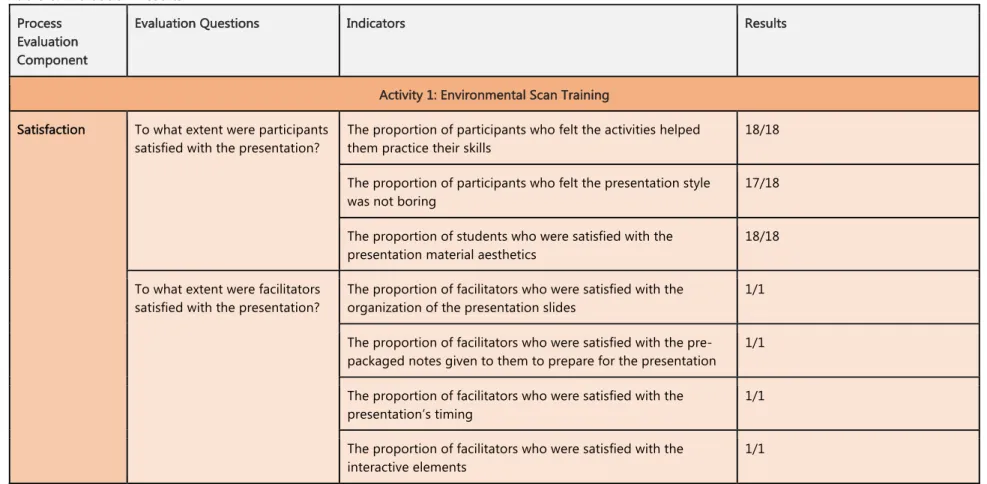
RESULTS AND INTERPRETATION
Based on data from the participant and facilitator surveys, a process and outcome evaluation of the community engagement activities was conducted. Some data sources were not returned; thus, some evaluation questions could not be analyzed due to the absence of indicators. Youth surveys for all activities were returned, the facilitator survey for activity 1 was returned, no facilitator for activity 2 was returned, and a youth survey was returned for activity 3 but completed as a facilitator survey. This will be discussed further in the interpretation and the Recommendations section. The full data analysis table can be found below in Table 6 with an analysis report below.
Table 6. Evaluation Results Process
Evaluation Component
Evaluation Questions Indicators Results
Activity 1: Environmental Scan Training
Satisfaction To what extent were participants satisfied with the presentation?
The proportion of participants who felt the activities helped them practice their skills
18/18
The proportion of participants who felt the presentation style was not boring
17/18
The proportion of students who were satisfied with the presentation material aesthetics
18/18
To what extent were facilitators satisfied with the presentation?
The proportion of facilitators who were satisfied with the organization of the presentation slides
1/1
The proportion of facilitators who were satisfied with the pre-packaged notes given to them to prepare for the presentation
1/1
The proportion of facilitators who were satisfied with the presentation’s timing
1/1
The proportion of facilitators who were satisfied with the interactive elements
24
ProcessEvaluation Component
Evaluation Questions Indicators Results
Completeness To what extent was the presentation delivered?
Proportion of participants who received all Activity 1 components
18/18 for Facilitator 1’s participants
Participation To what extent did participants participate in overall in this activity?
Proportion of participants whose received Activity 1 18/18 for Facilitator 1’s participants
Context To what extent did external factors influence the implementation of the presentation?
Proportion of facilitators that indicated specific challenges during the implementation of Activity 1
The presentation was shortened to match the intelligence in the room; there was also more youth interest in the interactive activity.
Proportion of facilitators that indicated proposed changes to Activity 1
The interactive question sections were very well received, and students wanted to spend more time doing that. They did not spend too much time on the basics as youth were already familiar with the 101 facts presented in the beginning.
Outcome Evaluation Questions Indicators Results
Self-efficacy Is there a change in self-efficacy to be able to conduct Activity 2?
Proportion of participants that indicated an improvement in self-efficacy
17/18
Knowledge and awareness
Is there a change in knowledge and awareness about tobacco retailers?
Proportion of participants that indicated an improvement in knowledge and awareness
Process Evaluation Component
Evaluation Questions Indicators Results
Activity 2: Interactive Environmental Scan
Satisfaction To what extent were participants satisfied with the activity?
The proportion of participants who felt the presentation style was not boring
17/18
The proportion of participants who enjoyed the interactivity 17/18
To what extent were facilitators satisfied with the activity?
The proportion of facilitators who were satisfied with the activity instructions
Not available
The proportion of facilitators who felt the pre-activity logistics were easy to carry out
Not available
The proportion of facilitators who enjoyed the interactivity Not available
Completeness To what extent was the presentation delivered?
Proportion of participants who received all Activity 2 components
Not available
Participation To what extent did participants participate in overall in this activity?
Proportion of participants whose received Activity 2 (18/18 for Facilitator 1’s participants)
Context To what extent did external factors influence the implementation of the presentation?
Proportion of facilitators that indicated specific challenges during the implementation of Activity 2
Not available
Proportion of facilitators that indicated proposed changes to Activity 2
Not available
Knowledge and awareness
Is there a change in knowledge and awareness about tobacco retailers?
Proportion of participants that indicated an improvement in knowledge and awareness
26
Is there a change in knowledgeand awareness about tobacco advertising?
Proportion of participants that indicated an improvement in knowledge and awareness
16/18
Process Evaluation Component
Evaluation Questions Indicators Results
Activity 3: Socioeconomic and Local Policy Context Training
Satisfaction To what extent were participants satisfied with the presentation?
The proportion of participants who felt the presentation style was not boring
18/18
The proportion of students who were satisfied with the map elements
18/18
To what extent were facilitators satisfied with the presentation?
The proportion of facilitators who were satisfied with the organization of the presentation slides
Not available
The proportion of facilitators who were satisfied with the pre-packaged notes given to them to prepare for the presentation
Not available
The proportion of facilitators who were satisfied with the presentation’s timing
Not available
Quality To what extent was the training implemented as planned, in terms of avoiding tokenism and approaching partnership and
empowerment?
The proportion of participants who felt like respected partners in the process
18/18
The proportion of participants who feel empowered 18/18
Completeness To what extent was the presentation delivered?
Proportion of participants who received all Activity 3 components
Outcome Evaluation Questions Indicators Results
Participation To what extent did participants participate in overall in this activity?
Proportion of participants whose received Activity 3 (18/18 for Facilitator 1’s participants)
Context To what extent did external factors influence the implementation of the presentation?
Proportion of facilitators that indicated specific challenges during the implementation of Activity 3
Not available
Proportion of facilitators that indicated proposed changes to Activity 3
Not available
Knowledge and awareness
Is there a change in knowledge and awareness about the decision-making structure of the school system?
Proportion of participants that indicated an improvement in knowledge and awareness
18/18
Is there a change in knowledge and awareness about the political, social, and economic landscape of Casey County?
Proportion of participants that indicated an improvement in knowledge and awareness
17/18
Is there a change in knowledge and awareness about planning-related tools that be utilized for community change?
Proportion of participants that indicated an improvement in knowledge and awareness
17/18
Self-efficacy Is there a change in self-efficacy around being able to advocate for community change as youth?
Proportion of participants that indicated an improvement in self-efficacy
ACTIVITY 1: ENVIRONMENTAL SCAN TRAINING
This workshop was administered in one session on one day and involved only one facilitator for the 18 participants. Thus, all reported facilitator information is for just one individual.
SATISFACTION
Activity 1 was overall received very well by the youth participants. 18/18 participants felt the activities helped them practice their skills and felt satisfied with the presentation material aesthetics. 17/18 participants felt the presentation style was not boring. The facilitator was satisfied with the organization of the presentation slides, the pre-packaged notes given to them ahead of time, the timing of the presentation, and interactive quiz section of the presentation. The facilitator felt that the notes were both easy to follow and had helpful content.
COMPLETENESS
The facilitator administered all components of activity 1 to all participants in one session. This component would be more important to analyze had there been multiple sessions offered to the youth and by different facilitators to measure discrepancies across days and facilitator. Luckily, this was not a problem in this instance.
PARTICIPATION
Similarly, all youth participated in activity 1 when the facilitator administered the training. This can be cross-checked because the attendance value on the facilitator survey was 18/18 and there were 18 youth surveys returned for activity 1.
CONTEXT
The facilitator described that the activity’s implementation ran smoothly; however, they did not that the youth did have prior knowledge of some of the basic tobacco information. Therefore, youth were less interested in listening to this lecture portion. However, they were very interested in the section about recognizing tobacco advertisements. Because of this, the timing was adjusted to match knowledge and interests of the youth. They also spent more time on practicing their skills to prepare for Activity 2.
OUTCOMES
questions does not indicate that students disagreed with any of questions. Even though questions were phrased to attribute any knowledge gain to the activity, it is possible that youth overlooked this or disregarded it in their answer. They survey question also could be changed to better account for this. This is discussed further in the Recommendations section.
ACTIVITY 2: INTERACTIVE ENVIRONMENTAL SCAN
The logistics of this activity are currently unknown. It is possible that all 18 participants went together to each location (they chose four different tobacco retailers) with one chaperone; however, facilitator surveys were not returned for this activity. Perhaps because the activity was highly interactive and involved commuting around town that the survey could not be easily administered to the facilitator(s). This
information was attempted to be collected after surveys had been originally returned; however, it seemed to be difficult to retroactively track down facilitators or remember details to record. All youth surveys were returned. Because of the lack of information, some evaluation components are intentionally excluded below.
SATISFACTION
17/18 participants felt satisfied presentation style, and 17/18 enjoyed the interactive element of the activity, including moving around outside to explore areas of their community.
COMPLETENESS
Although this information is not available through the survey, some of it can be assumed from the returned materials. The components on the checklist are: Hand out ‘data collection’ sheet to youth; Go on a walking tour of different tobacco retailers; Encourage youth to take photographs; Collect addresses of retailers visited; Administered youth surveys. It is evident that sheets were handed out, the walking tour was completed, and that youth surveys were administered because four completed audit sheets and all 18 youth surveys were returned. It is unknown as to whether or not the addresses align with the suggested locations or if youth took photographs. Therefore, it is unknown how many participants actually received all Activity 2 components; however, it can be inferred that all 18 received the same three activities described above.
PARTICIPATION
Similarly, although this information is not available through the facilitator survey, it can be assumed that 18/18 received the activity because 18 youth surveys were returned. This operates under the understanding that the group of 18 students is one cohort that experiences all activities together as a group and that there change in group makeup.
OUTCOMES
30
peers or people my age.” This could be attributed to the wording of the question in that youth might have already had a strong understanding about how advertisements appeal to their peers. This will be discussed more in the Recommendations section.
ACTIVITY 3: SOCIOECONOMIC AND LOCAL POLICY CONTEXT TRAINING
For this activity, no facilitator surveys were returned for this activity, and all youth surveys were returned. However, two additional youth surveys were returned and had the word “adult” written on the top. This was inferred to mean that two facilitators filled out a youth survey as replacement for a facilitator survey. Although this was not intended during the data collection process, this is an interesting turn of events which led to some outcome information being collected for facilitators. This will be discussed further in the Recommendations section. Similar to above, some evaluation components are intentionally excluded below based on available data.
SATISFACTION
18/18 participants were satisfied with both the presentation style and interactive mapping exploration component. Because facilitators filled out the youth survey, some satisfaction data could be collected. 2/2 facilitators were satisfied with both the presentation style and interactive mapping exploration component.
QUALITY
18/18 participants felt like respected partners in the process of learning about the community. 18/18 participants also felt like they had been given power throughout the whole process and feel empowered to make changes in their community moving forward. This construct is very important in terms of avoiding tokenizing community members. Especially considering the participants are youth, it is imperative that they feel like respected partners whose voices are heard rather than traditionally silenced and diminished because of lack of life experience, maturity, and education. Because this project was intentionally designed to focus on engagement with youth specifically, the survey results for the facilitators who answered these questions are disregarded. However, if the scope of this project included prioritizing partnering with adult community members, their answers would add to the larger analysis. This will be discussed further in the Recommendation sections.
COMPLETENESS
Although this information is not available through the survey, some of it can be assumed from the returned materials. The components on the checklist are: PowerPoint presentation knowledge slides, PowerPoint presentation interactive activity slides, and Youth surveys administered. It is evident that knowledge slides and activity slides of the presentation and youth surveys were administered because all 18 youth surveys were returned. They youth survey included items that assessed knowledge gained and satisfaction of activity slides. Therefore, it can be inferred that all 18 received the three activities described above.
PARTICIPATION
OUTCOMES
There were changes in both outcome goals of this activity, which was essentially the culmination of the previous two activities. 18/18 participants indicated an improvement in knowledge and awareness about the decision-making structures of the school system. 17/18 students indicated an improvement in knowledge and awareness about the political, social, and economic landscape of Casey County. Specifically, participants recorded that they know more about both the racial and income makeup of their community. However, more students indicated a change in knowledge about the racial makeup of the community. This could be attributed to the fact that they were already aware of the general racial makeup of their county. If the participants who noted this are People of Color, it could lead to them being more racially conscious and aware even at a young age. 17/18 participants indicated an improvement in knowledge and awareness about planning-related tools that can be utilized for community change. Specifically, they know more about what zoning and licensing tools are and how they can be used to regulate tobacco in a community. Although both tools scored highly, more students disagreed with the knowing more about zoning after the activity. This could be attributed to more confusion about this topic; however, without contextual or qualitative information, it is impossible to know exactly why the scores are slightly lower for zoning than licensing.
The ultimate goal of this activity (and all of the community engagement activities) was to create a sense of ‘change-agent’ in the youths’ minds. The survey results indicate that 18/18 participants indicated an improvement in self-efficacy around being able to advocate for community change as a young person. This includes feeling more invested in the changes that happen in their community, feeling like they can play a role in the changes that happen, feeling empowered to make change in the community moving forward, and feeling like the knowledge they gained through the activities will empower them to advocate for policy changes in their communities. This surveys serve to assess shorter-term outcomes; however, the results of this survey indicate that the youth may move forward with organizing and taking action – which is the ultimate long-term goal of involving youth in the process to drive change in communities.
As previously mentioned, this project was intentionally designed to focus on engagement with youth specifically. However, outcome data was collected for the two facilitators who completed a survey that was intended for youth-use only. Although this data was not intended to be collected, it does shed light on an interesting aspect of facilitation and training educators. Not only did both facilitators note that they feel more invested in community change and feel empowered to advocate for policy change, but both also learned more about the socioeconomic and political landscape of Casey County and the use of land-use tools for restricting tobacco retailers in communities. Although not intentionally measured and the sample size is small, it is interesting to consider that all of the facilitators may have experienced improvements in knowledge and self-efficacy. Although the adult facilitators are not in the target youth audience, it is still noteworthy as the adults are also part of the larger community impacted by tobacco retailers; they can form one large alliance of community members who can advocate together for change.
RECOMMENDATIONS
32
IMPLEMENTATION RECOMMENDATIONS
Activity 1: Environmental Scan Training
v Identify number of facilitators ahead of time
v Participants might have a prior knowledge of tobacco basics, so this activity should focus more on the skills training and less on providing information about tobacco.
Activity 2: Interactive Environmental Scan
v Identify number of facilitators ahead of time and number of youth per group
v Facilitator surveys should be taken in-hand during the activity to make it easier to fill out
Activity 3: Socioeconomic and Local Policy Context Training v Identify number of facilitators ahead of time v Spend more time on map exploration v Leave more time for questions
v Provide more time on zoning and licensing and take questions from the audience to share with the expert to get clarifying answers
EVALUATION RECOMMENDATIONS
v Rather than phrasing questions with “After this training…”, collect pre-activity data to assess knowledge indicators
v Provide a pre-test before Activity 1 to assess what information participants already know about tobacco as to not repeat this information during the training; this can also be used to identify points that need to be clarified or corrected
v Add more questions to assess qualitative data from youth participants about knowledge and self-efficacy gains; questions can include describing why they ‘disagree’ with a statement or describing an action they plan to take in the next week, month, year, etc.
v Collect race, gender, and age demographic information of participants
v Ensure pre-packaged toolkit information and instructions are passed downstream so that facilitators also receive all instructions, especially regarding completing their surveys
v Collect outcome data for all facilitators around investment in community changes, knowledge gains per activity, self-efficacy around identifying tobacco retailers and advertising, and self-efficacy in facilitating a workshop for youth about a topic they’re previously unfamiliar with
FUTURE ACTIONS WITH THIS YOUTH ORGANIZATION
DISCUSSION AND LIMITATIONS
The above analysis of community engagement was conducted using a public health process and outcome evaluation framework. There are many pros of applying this framework. At first glance, the completed evaluation ended with both implementation and evaluation recommendations, indicative that it is possible to use this tailored framework to assess community engagement in the pre-planning stages. The method also approached a mixed-methods approach involving the use of spatial analysis tools, quantitative measures, and qualitative measures. The majority of the survey included quantitative indicators; however, there were indicators that assessed challenges and barriers for both participants and the facilitators. The results do assess the nuances of participation, including efficacy, information exchange and learning, and decision-making authority (Moote, 1997). The results showed that the community participation activities did accomplish their goals of increasing knowledge, awareness, and investment in the community. There are plans to continue to assess participation in future stages (ie. continuity of participation) (Moote, 1997). The next stages of community participation now would involve connecting to local officials and relaying the information they learned. A similar evaluation process can be conducted for the next stages. In addition, once new plans or policies are recommended for the county, a final participation evaluation can be conducted. This series of evaluations would be extremely novel in the field of planning, especially with the use of a standardized tool for evaluation. Further research also involves more format interviews and focus groups with the participants.
This framework did fail to account for one nuance of participation – representation and access. In this scenario, the group was comprised of individuals from one organization who expressed interest in wanting to participate in pre-planning conversations. However, this results in a biased conversation that allows this group to elevate their voice and interests and ignores the other opinions in the community. This study did not consider capturing information about who is not participating in these engagement activities. However, that does not mean that this framework fails to address this idea generally. In this example, the client specifically chose to work with this group. However, if this conversation was opened up to the larger community, there are process indicators, such as “reach,” that evaluation the proportion of the intended audience that participates in a program, measured my attendance and recruitment practices (see Table 2), and includes any barriers for specific people or populations to participate (Saunders, Evans, & Joshi, 2005).
34
to generalize results, they would need to submit an IRB application. One possible solution would be to hire a planning intern to carry out the engagement evaluation for the lifetime of the project; however, that would take time and funding.
Ultimately, this entire paper does illustrate that it is possible, with time and resources, to utilize existing evaluation tools from the public health field and apply them to planning to assess community engagement. In comparison to other techniques, the framework can be used at various time points of participation, can address the nuances of participation, and provides a standard framework that be used to define focused evaluation questions and goals to interpret results across time and space.
REFERENCE LIST
Alfasi, N. (2003) Is public participation making urban planning more democratic? The Israeli experience. Planning Theory & Practice, 4:2, 185–202.
Arnstein, Sherry R. (1969) A ladder of citizen participation. Journal of the American Planning Association, 35:4, 216-22.
Australian Government Land and Coasts Communication Team. (n.d.) Community engagement in natural resource management. Accessed online via
http://www.ghd.com/pdf/23.%20Community%20Engagement%20in%20NRM.pdf
Berke, P. R. & Campanella, T. J. (2006) Planning for postdisaster resiliency. The Annals of the American Academy of Political and Social Science, 604:1, 192–207.
Berke, P. R., Cooper, J., Aminto, M., Grabich, S. & Horney, J. A. (2014) Adaptive planning for disaster recovery and resiliency: An evaluation of 87 local recovery plans in eight states. Journal of the American Planning Association, 80:4, 310–23.
Blumenthal, D. S. (2011) Is community-based participatory research possible? American Journal of Preventive Medicine, 40:3, 386–389.
Center for Disease Control and Prevention (“CDC”) National Center Chronic Disease Prevention and Health Promotion. (2011) Developing an effective evaluation report: Setting the course for effective program evaluation. Accessed online via https://www.cdc.gov/eval/materials/Developing-An-Effective-Evaluation-Report_TAG508.pdf
Center for Disease Control and Prevention (“CDC2”) National Center for HIV/AIDS, Viral Hepatitis, STD, and TB Prevention. (n.d.) Developing evaluation indicators. Accessed online via
https://www.cdc.gov/std/Program/pupestd/Types%20of%20Evaluation.pdf
Center for Disease Control and Prevention (“CDC3”) National Center for HIV/AIDS, Viral Hepatitis, STD, and TB Prevention. (n.d.) Types of evaluation. Accessed online via
Center for Disease Control and Prevention (“CDC4") National Center for HIV/AIDS, Viral Hepatitis, STD, and TB Prevention. (n.d) Developing evaluation questions. Accessed online via
https://www.cdc.gov/std/Program/pupestd/Types%20of%20Evaluation.pdf
Community Places. (2014) Community planning toolkit. Accessed online via http://www.communityplanningtoolkit.org/sites/default/files/Engagement.pdf
Counter Tobacco. (2016) STARS. University of North Carolina. Accessed online September 10, 2016 via http://countertobacco.org/resources-tools/store-assessment-tools/stars/
Counter Tobacco. (2016) Youth and community engagement. University of North Carolina. Accessed online September 10, 2016 via http://countertobacco.org/resources-tools/youth-and-community-engagement/.
Frieden, T. R. (2010) A framework for public health action: the health Impact pyramid. American Journal of Public Health, 100:4, 590–595.
Golden S.D & Earp J.A. (2012) Social ecological approaches to individuals and their contexts: Twenty years of health education behavior health promotion interventions. Health Educ Behav, 39:3, :364-372.
Horney, J., Dwyer, C., Aminto, M., Berke, P., and Smith, G. (2010) Developing indicators to measure post-disaster community recovery in the United States. Disasters.
Horney, J., Simon, M., Grabich, S., and Berke, P. (2015) Measuring participation by socially vulnerable groups in hazard mitigation planning, Bertie County, North Carolina. Environmental Planning and Management, 58:5.
Horney, J., Spurlock, D., Grabich, S. & Berke, P. (2016) Capacity for Stakeholder Participation in Recovery Planning. Planning Practice & Research, 31:1, 65-79.
Kinzer, Kirsten. (2016) Missed connections a critical analysis of interconnections between public participation and plan implementation literature. Journal of Planning Literature 31:3, 299–316.
Loh, Carolyn G. (2012) Four potential disconnects in the community planning process. Journal of Planning Education and Research, 32:1, 33–47.
Moote, Margaret A., and Mitchel P. McClaran. (1997) Viewpoint: implications of participatory democracy for public land planning. Journal of Range Management, 50:5, 473–81.
Saunders, R.P., Evans, M.H, & Joshi, P. (2005) Developing a process-evaluation plan for assessing health promotion program implementation: a how-to guide. Journal of Health Promotion Practice, 6:2, 34-147.
Tauxe, Caroline. (1995) Marginalizing public participation in local planning: an ethnographic account. Journal of the American Planning Association, 61:4, 471–81.