Parents with Low Literacy Report Higher Quality of Well-Child Care
By
Marjorie S. Rosenthal, MD
A Master's Paper submitted to the faculty of the University of North Carolina at Chapel Hill
In partial fulfillment of the requirements for the degree of Master in Public Health in
the Public Health Leadership Program.
Chapel Hill
Abstract
Introduction
The growing literature on improving pediatric quality of care has
highlighted the gaps in quality by socioeconomic status. Literacy may
be an important factor within the relationship between socioeconomic
status and quality healthcare. As young children depend on their
parents for healthcare services, we hypothesized that low parental
literacy would be associated with poor well-child healthcare.
Methods
Our design was a cross-sectional survey using face-to-face interviews
of caregivers of 1-4 year old children in a pediatric resident clinic in the
Southeast. We used the Rapid Estimate of Adult Literacy in Medicine
to assess parental literacy and four subscales relevant to either
provider-parent relationships or content of discussions in the well-child
visit from the Promoting Healthy Development Survey to assess the
quality of the well-child appointment.
The mean age of the 150 respondents was 30 years, 56% were
African American, 68% received Medicaid, and 86% graduated high
school. Thirty-four percent of the respondents scored below a gth
grade reading level (low literacy). Parents with low-literacy were more
likely than those with normal or high literacy to report family centered
care (55% versus 27%, p=0.001 ), and helpfulness and confidence
(84% versus 56%, p<0.001 ). There was no difference, by literacy
level, in the mean percent of family well-being topics discussed or the
mean percent of anticipatory guidance topics for which the parents had
their informational needs met.
Discussion
The low-literacy respondents reported higher quality than the
normal/high literacy group regarding relationships and there was no
difference in quality by literacy level regarding content of discussions.
Potential mechanisms for the difference between low and high literacy
groups include that parents with low-literacy may have lower
expectations regarding relationships with their healthcare provider or
pediatric residents may be more effective at relationship building with
INTRODUCTION
Measuring pediatric quality of care is among the first steps to improve
quality and reduce disparities.1 The growing literature on improving pediatric quality of care has highlighted the gaps in quality by
socioeconomic status. Children with low income are more likely to
have parents report difficulty getting necessary care, difficulty getting
specialist care, not being listened to, and not being respected. The
children are more likely to be hospitalized for ambulatory-sensitive
conditions, such as asthma2-7 Although we have an incomplete understanding of the relationship between socioeconomic status and
quality healthcare, literacy may be an important factor. In adults, health
and quality of care are associated with literacy. Specifically, low
literacy is associated with poor health knowledge,8-10 poor receipt of
preventive services,11 increased hospitalization,12· 13 increased
complications from diabetes,14 and poor self-reported health status.15·
16
In pediatrics, few researchers have studied the association between
either child health or quality of pediatric healthcare and parental
literacy, and they found mixed results. Parental low literacy has been
diabetic children, 18 and parental report of a greater degree of illness in
the child.19 On the other hand, parental literacy was not related to
parental report of use of pediatric preventive services or parental ability
to follow medical instructions for the child.19
The majority of healthcare experiences for most children in the United
States are composed of health maintenance services. As such,
measuring the quality of health maintenance, also known as well-child
care, is a salient way to measure pediatric healthcare quality.20• 21
Process measures, measures that collect data on what happens during
the health care provider-patient visit, may be the best manner of
assessing quality.22 Researchers have traditionally used process
measures such as immunization rates and rate of physician visits to
document quality in well-child care. Because these measures do not
inform the broad range of recommended preventive and
developmental services, more inclusive process measures have been
developed and used in large, national studies.20 Since neither claims
data nor medical records can adequately describe the health
promotion that occurs in health maintenance visits, parent surveys may
As young children depend on their parents for healthcare services, we
hypothesized that low parental literacy would be associated with poor
well-child healthcare. We aimed to determine the nature of the
relationship between parental literacy and the quality of well-child care.
METHODS
Setting, Recruitment and Participants
Our design was a cross-sectional survey using face-to-face interviews
of the child's caregiver in the pediatric resident clinic at the University
of North Carolina at Chapel Hill. The clinic has approximately 10,000
visits per year, about half of which are well-child. Approximately half of
the children are African-American, the majority receive Medicaid or the
state Children's Health Insurance Plan (SCHIP) and of the parents,
75% have graduated high school.
Each morning, our trained research assistant used the clinic's
computer-generated schedule to identify potential participants. She
recruited and obtained informed consent prior to the office visit and
between January 2004 and March 2005. All caregivers were eligible if
their child was between the ages of 12 and 48 months and had had at
least one prior well-child visit at the clinic. Additionally, the caregiver
had to be at least 18 years old and English-speaking.
Our trained research assistant explained to potential participants that
she did not work for the clinic and that answers would be confidential.
She explained that the goal of the study was to improve care in the
clinic; she did not mention literacy while recruiting. In order to remove
the bias of parental literacy, the research assistant read every question
out loud. The University of North Carolina Institutional Review Board
approved the study protocol.
Measures
Parental Literacy: The Rapid Estimate of Adult Literacy in Medicine
(REALM) is a three-minute screening instrument used to identify
people who have difficulty reading. The test is scored on the number
of words pronounced correctly such that a score of 0-18 correlates to a
3'd grade reading level or below, 19-44 correlates to a 41h-6th grade
reading level, 45-60 correlates to a yth_8th grade reading level, and
well correlated with well-established reading comprehension
instruments such as the WRAT-R.23
Quality of Care: We used subscales of the Promoting Healthy
Development Survey (PHDS), a standardized, well-validated 52-item
parent survey designed to measure well-child quality of care.24 The
PHDS is the only established quality measure that specifically targets
the quality of well-child healthcare for infants and preschoolers.25 We
used the subscales of the survey that measure the quality of health
promotion and the quantity of health promotion messages.
The first two subscales, 1) family-centered care and 2)
helpfulness/confidence-building, concern the quality of the health
promotion regarding provider-parent relationships. Examples of topics
covered in family-centered care are a) if the provider takes time to
understand child's specific needs, and b) if the provider respects the
parent's expertise. The response set is a 4-point scale of never,
sometimes, usually, always. Examples of topics covered in
helpfulness/confidence-building are a) if the provider helped the parent
address her own needs while addressing those of the child, and b) if
helpfulness response set was a 5-point scale of very helpful, helpful,
somewhat helpful, not at all helpful, we did not discuss. The
confidence-building response set was a 4-point scale of "I feel. .. a lot
more confident, a little more confident, not more or less confident, less
confident."
The next two subscales, 3) family well-being and 4) anticipatory
guidance, concern the quantity of health promotion messages: the
content of the discussions within the well-child visit. Examples of
topics covered in family well-being are a) if the provider discussed if
the parent felt depressed, and b) if the provider discussed if the parent
felt safe at home. The response set was: yes, no. Examples of topics
covered in anticipatory guidance are a) if the provider discussed the
child's growth and development, and b) if the provider discussed
limit-setting techniques. The response set was a 4-point scale of "Yes, and
all my questions were answered; Yes, but my questions were not
completely answered; No, but I wish we had discussed; or No, but I
already had information on this topic and did not need to discuss it
Statistical Analysis
We defined low literacy as a score below 61 (or below a 9th grade
reading level) on the REALM and dichotomized the instrument
between sth and 9th grade. We chose to dichotomize at that point
because, according to the instrument developers, at a reading level of
eighth grade and below the patient "may struggle with most ... patient
education materials."23 Although our research question was not
specifically related to the respondent's ability to read patient education
materials, we thought this a good proxy for general comprehension.
For our quality instrument, as recommended by the instrument
developers, we analyzed the results of each subscale distinctly.20• 24
For the family-centered care subscale there were 8 questions; we
calculated the percent of parents who gave a positive response (e.g.,
responded "always" or "usually") to every question within the subscale.
We combined the 3 questions of the helpfulness subscale with the 4
questions of the confidence-building subscale and then dichotomized
the answers into positive and negative responses. We then calculated
the percent of parents who gave a positive response to every question
within the subscale. For the 10 questions in the family well-being
subscale, we assessed the percent of topics discussed. For the 33
percent of topics for which the parent had her informational needs met
for age-relevant topics. Having her informational needs met means the
parent answered either "Yes, and all my questions were answered" or
"No, but I already had information on this topic and did not need to
discuss it anymore."
We then assessed the bivariate relationships between literacy and
each of the four quality subscales. We assessed the bivariate
relationship between reported highest grade completed and
low-literacy. We created 4 categories of highest grade completed: 81h-111h
grade, 121h grade, and 13-21 years of education. We assessed the
percent of low-literacy respondents within each of these three
categories. We used chi square analysis for categorical variables and
t-tests for continuous variables.
In our multivariable analysis we created four regression models to
examine the relationship between our independent variable, literacy,
and our four outcome variables, the score on each of the four quality
subscales. To assess whether there were any characteristics of our
sample that might confound the relationship between low literacy and
literacy to each of the candidate covariates: age of parent, age of the
child, gender of parent, race, marital status, whether the parents were
living together, family income, and payment source. Candidate
covariates were retained in our final model only if they affected the
relationship between literacy and any of the quality outcomes.
Finally, to answer those who would argue that literacy as an
independent variable is no more precise in predicting well-child quality
than other, more commonly obtained individual characteristics, we
performed multivariable analysis using these other characteristics as
independent variables and the quality subscales as our dependent
variables. Specifically, we created four models for each of the six
family characteristics (gender, race, parents living together, source of
payment , family income and education) to see if they would act as
predictors of quality. We conducted data analyses using Stata 8.0
(College Station, Texas).
RESULTS
During the study period 250 adults meeting inclusion criteria were
approached and 150 (60%) agreed to participate. Our respondents
The mean age of the respondent was 30 years with a range of 18-64
years, 41% were white, 56% were African American, and 9% were
Latina/Hispanic. Fifty-nine percent of the respondents reported that the
child's mother lives with the child's father and 46% of the respondents
were married. The payment source was 68% Medicaid and 49% had a
family income of $20,000 or less. The child's mean age was 21
months with a range of 12-48 months.
Eighty-six percent of respondents graduated high school and the mean
REALM score was 60/66 with a range of 16/66 to 66/66 (Table 1 ). The
highest grade completed by the respondent ranged from 8 to 21 years
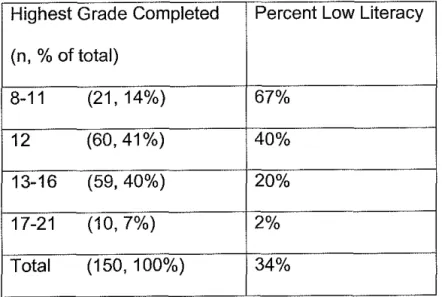
(Table 2). Fourteen percent of the sample reported that they did not
complete high school. Thirty-four percent scored below a 9th grade
reading level (low-literacy). In assessing the bivariate association
between highest grade completed and low-literacy, we found that for
individuals reporting they did not complete high school (n=21 ), 67%
had low-literacy; for individuals reporting that they completed 1 ih
grade and no more (n=60), 40% had low-literacy; for individuals who
completed between 13 and 16 years of education (n=59), 20% had
education (n=1 0), 2% had low-literacy. These data show that as the
highest grade completed increased, the percent of low-literacy
respondents decreased. This data also show, however, that within
every highest grade completed category, there are respondents with
low-literacy.
We then assessed the bivariate relationships between family
characteristics and low literacy (Table 1 ). We found the respondents in
our low literacy group were more likely to be female, African American,
to have parents live apart, receiving Medicaid, to have a family income
less than $20,000 a year, and to have not graduated from high school.
In our bivariate analysis comparing literacy and quality of care, we
found that parents with low-literacy were more likely than those with
normal or high literacy to report family centered care (55% versus
27%, p=0.001 ), and helpfulness and confidence (84% versus 56%,
p<0.001) (Figure 1 ). There was no difference, by literacy level, in the
mean percent of family well-being topics discussed or the mean
percent of anticipatory guidance topics for which the parents had their
We then created four models, one for each of the quality subscales.
We included as confounders each variable where we demonstrated a
difference in the bivariate analysis. Ultimately, when we adjusted for
confounders the associations we found in the bivariate analysis did not
change: those with low literacy reported greater family centered care
and helpfulness/confidence and there was no difference, by literacy, in
the family well-being topics discussed or the anticipatory guidance
topics for which they had their informational needs met.
The results of the logistic regression models for the six family
characteristics (race, whether the parents live together, receipt of
Medicaid, income less than $20,000, and high school graduation
status) showed no difference for any of the quality scores.
CONCLUSION
Measuring quality of care in children is difficult. It is difficult because
bad outcomes are rare, because normal health and development in a
child is defined by change, because developmental outcomes from
poor quality of care might not manifest themselves during childhood,
resources-such as school and day care-as it is on the healthcare
system.4· 21 Measuring quality is, however, necessary for improving
quality of care. In our study we used parental report of process
measures to report quality of care.
Respondents with low-literacy were more likely to report that the health
care providers from their child's well-child visit were family centered,
helpful, and that the information they received from them improved
their confidence in parenting. These same low-literacy parents did not,
however, report that their health care providers had more discussions
with them about topics related to family well-being or that they had
their informational needs met more often for topics of anticipatory
guidance.
Thus, regarding relationships with their health care providers, the
low-literacy respondents reported higher quality than the normal/high
literacy group. Regarding recollection of information discussed, there
was no difference in quality by literacy level.
As these results are different than our hypothesis, where we proposed
to examine our results critically. Our literacy instrument is
well-validated and generally administered in the manner in which we did it.
Our quality instrument is also well-validated. Whereas our research
assistant was face-to-face with the respondent and read the questions
out loud to the respondents, the instrument's use in other studies has
been a self-administered questionnaire or a telephone interview.20• 24
This may have increased the likelihood that our respondents would
give a socially acceptable answer, and be less critical of the quality of
the well-child visit, but we expect that this would have affected
respondents of all literacy levels.
In other studies, when years of education of the respondent was used
as an independent variable and the same quality subscales as
dependent variables, there were no differences by education.24· 26 We
were not deterred by this in designing our study as there is ample
evidence that measuring literacy is different than measuring education:
self-report of number of years of school completed may be up to five
years higher than reading ability and up to 20% of those who graduate
high school may have marginal literacy skills.27-30 There is evidence
years of education.31 In our study, we found similar results: in our
bivariate analysis we found that there were respondents with
low-literacy in each of the categories describing highest grade completed.
Thus, that we found no difference in quality subscale scores in our
multivariable analysis, when we used high school graduation as the
independent variable and we did find differences when we used
literacy level as the independent variable is not surprising.
In rejecting our hypothesis we have considered potential mechanisms
for our results. One mechanism for the difference in provider-parent
relationships between low and high literacy groups might be that
parents with low-literacy may have lower expectations regarding
relationships with their healthcare provider. The low literacy families
may not be activated to think about their needs or desires prior to the
well-child appointment. They may come into the appointment with few
preconceived notions and are therefore very accepting of the care that
is delivered. Families with normal or high literacy may have more of an
agenda for the well-child appointment and may be holding the
Another potential mechanism is that pediatric residents may be more
effective at relationship building with low-literacy families. Although
physicians are generally unsuccessful in predicting which caretakers
have low literacy,9· 32 other characteristics associated with literacy in
our study may function to alert physicians to increased potential need.
This may be related to preconceived notions that doctors in training
have about family characteristics.
Our study is limited in that it is a cross-sectional analysis that describes
an association and not causality. Generalizability may be limited as it
was a single institution study with doctors in training.
We believe the data argue for further study to assess the quality
measures of provider-parent relationships and discussions by
comparing parental report to other modes of measurement such as
audiotape or videotape. For if our data are due to lowered
expectations of parents with low literacy then we may need to
re-examine our measurement of quality of care. If, on the other hand, our
data show a true phenomenon then we may need to understand and
harness the relationship-building success of physicians-in-training
Table 1. Family Characteristics and Literacy
All Respondents Low literacy High/Normal p-value
(N=150) (n= 51) Literacy (n=99)
Respondent gender 86 94 82 0.04
(%female)
Respondent relationship 80 84 78 0.34
(%mother)
Respondent mean age 30.2 (8.2) 29.8 (8.9) 30.6 (7.8) 0.56
(standard deviation)
.
---
. - . --- --- --- ------All Respondents Low literacy High/Normal p-value
(N=150) (n= 51) Literacy (n=99)
Race (% African 56 69 49 0.025
American)
Ethnicity (% Latino) 9 6 10 0.38
Parents live together(%) 59 47 65 0.038
Married (%) 46 37 51 0.12
Source of payment is 68 82 63 0.013
Medicaid(%)
Family income <=$20,000 49 65 40 0.005
(%)
Child mean age (standard 21.3 (8.8) 21.7(9.4) 21.2 (8.5) 0.74
0 ~-·- 0 0 0 _ , . . . -··-·--M .... 00-M0-- _,_ -·M-·-- , __ ,,_,, ___
All Respondents Low literacy High/Normal p-value
(N=150) (n= 51) Literacy (n=99)
High school graduate(%) 86 73 93 0.001
Mean REALM score 60.1 (8.1) 52.4 (9.9) 64.2 (1.4) <0.001
Table 2. Association between highest grade completed and low-literacy (N=150)
Highest Grade Completed Percent Low Literacy
(n, % of total)
8-11 (21, 14%) 67%
12 (60, 41%) 40%
13-16 (59, 40%) 20%
17-21 (10, 7%) 2%
Total (150, 100%) 34%
I
-• - - · - - · - - - · · · J - · - - · - - J . _ , , , .. J .. · - · · · - - - · - · · - · - · - - - · · - - · - - _ _ J _ _ _ _ _
("'~·--··--Family p- Helpfulness p- Family p- Anticipatory
p-Centered value & value Well- value Guidance value
Care(%) Confidence Being (%)
(%) (%)
Race
African-American 35 0.75 65 0.75 45 0.06 84 0.62
Other 38 65 56 82
Parents live
Together 37 0.88 62 0.23 49 0.76 85 0.35
Apart 35 72 51 81
Education
HS grad 35 0.63 64 0.27 50 0.99 83 0.98
< HS grad 41 78 50 83
Medicaid
Yes 40 0.20 65 0.72 52 0.19 84 0.84
No 27 69 44 81
Income
<$20,000 42 0.26 70 0.43 50 0.99 83 0.96
<:$20,000 31 63 50 83
Figure 1. Quality of Care by Literacy
~t:;;;;,~y(n=51) ..
I'll
High Liter~~9>]100%-1 ~
75%
50%
25%
0%
Family Centered Care*
* p<0.005
Helpfulness & Confidence*
87%
1. Halfon N, Olson LM. Introduction: results from a new national survey of children's health. Pediatrics. Jun 2004;113(6 Suppl): 1895-1898. 2. Institute of Medicine. Crossing the Quality Chasm: A New Health
System for the 21st Century. Washington DC: National Academies
Press; 2001.
3. McGlynn EA. Introduction and overview of the conceptual framework for a national quality measurement and reporting system. Med Care. Jan2003;41(1 Suppl):Il-7.
4. Ferris TG, Dougherty D, Blumenthal D, Perrin JM. A report card on quality improvement for children's health care. Pediatrics. Jan 2001; 1 07(1 ): 143-155.
5. Kelley E, Moy E, Kosiak B, et al. Prevention health care quality in America: findings from the first National Healthcare Quality and Disparities reports. Prev Chronic Dis. Jul2004;1(3):A03.
6. Olson LM, Inkelas M, Halfon N, Schuster MA, O'Connor KG, Mistry
R. Overview of the content of health supervision for young children: reports from parents and pediatricians. Pediatrics. Jun 2004;113(6 Suppl):1907-1916.
7. Simpson L, Owens PL, Zodet MW, et al. Health care for children and youth in the United States: annual report on patterns of coverage, utilization, quality, and expenditures by income. Ambul Pediatr. Jan-Feb 2005;5(1):6-44.
8. Davis TC, Arnold C, Berkel HJ, Nandy I, Jackson RH, Glass J. Knowledge and attitude on screening manunography among low-literate, low-income women. Cancer. Nov 1 1996;78(9):1912-1920. 9. Lindau ST, Tomori C, Lyons T, Langseth L, Bennett CL, Garcia P.
The association of health literacy with cervical cancer prevention knowledge and health behaviors in a multiethnic cohort of women. Am
J Obstet Gynecol. May 2002;186(5):938-943.
10. Miller LG, Liu H, Hays RD, et al. Knowledge of antiretroviral regimen dosing and adherence: a longitudinal study. Clin Infect Dis. Feb 15 2003;36(4):514-518.
11. Scott TL, Gazmararian JA, Williams MV, Baker DW. Health literacy and preventive health care use among Medicare enrollees in a
managed care organization. Med Care. May 2002;40(5):395-404. 12. Baker DW, Gazmararian JA, Williams MV, et al. Functional health
literacy and the risk of hospital admission among Medicare managed care enrollees. Am J Public Health. Aug 2002;92(8):1278-1283.
13. Baker DW, Parker RM, Williams MV, Clark WS. Health literacy and the risk of hospital admission. J Gen Intern Med. Dec
14. Schillinger D, Grumbach K, Piette J, et al. Association of health literacy with diabetes outcomes. Jama. Jul24-31
2002;288(4):475-482.
15. Weiss BD, Hart G, McGee DL, D'Estelle S. Health status of illiterate adults: relation between literacy and health status among persons with low literacy skills. JAm Board Fam Pract. May-Jun
1992;5(3):257-264.
16. Baker DW, Parker RM, Williams MV, Clark WS, Nurss J. The
relationship of patient reading ability to self-reported health and use of health services. Am J Public Health. Jun 1997;87(6):1027-1030.
17. Kaufinan H, Skipper B, Small L, Terry T, McGrew M. Effect of literacy on breast-feeding outcomes. South Med J. Mar
2001 ;94(3):293-296.
18. Ross LA, Frier BM, Kelnar CJ, Deary IJ. Child and parental mental ability and glycaemic control in children with Type 1 diabetes. Diabet Med. May 2001;18(5):364-369.
19. Moon RY, Cheng TL, Patel KM, Baumhaft K, Scheidt PC. Parental literacy level and understanding of medical information. Pediatrics.
Aug 1998;102(2):e25.
20. Bethell C, Reuland CH, Halfon N, Schor EL. Measuring the quality of preventive and developmental services for young children: national estimates and patterns of clinicians' performance. Pediatrics. Jun
2004;113(6 Suppl):l973-1983.
21. Mangione-Smith R, McGlynn EA. Assessing the quality ofhealthcare provided to children. Health Serv Res. Oct 1998;33(4 Pt 2):1059-1090.
22. Donabedian A. The Definition of Quality and Approaches to Its Assessment. Chicago: Health Administration Press; 1980.
23. Davis TC, Long SW, Jackson RH, et al. Rapid estimate of adult literacy in medicine: a shortened screening instrument. Fam Med. Jun
1993;25(6):391-395.
24. Bethell C, Peck C, Schor E. Assessing health system provision of well-child care: The Promoting Healthy Development Survey. Pediatrics.
May 2001;107(5):1084-1094.
25. Beal AC, Co JP, Dougherty D, et al. Quality measures for children's health care. Pediatrics. Jan 2004;113(1 Pt 2):199-209.
26. Zuckerman B, Stevens GD, Inkelas M, Halfon N. Prevalence and correlates of high-quality basic pediatric preventive care. Pediatrics.
Dec 2004;114(6):1522-1529.
27. Williams MV, Parker RM, Baker DW, et al. Inadequate functional health literacy among patients at two public hospitals. Jama. Dec 6
28. Baker FM, Johnson JT, Velli SA, Wiley C. Congruence between education and reading levels of older persons. Psychiatr Serv. Feb
1996;47(2):194-196.
29. Meade CD, Byrd JC. Patient literacy and the readability of smoking education literature. Am J Public Health. Feb 1989;79(2):204-206.
30. Wilson FL. Measuring patients' ability to read and comprehend: a first step in patient education. Nursingconnections. Winter 1995;8(4):
17-25.
31. Feldman JJ, Makuc DM, Kleinman JC, Coruoni-Huntley J. National trends in educational differentials in mortality. Am J Epidemiol. May
1989; 129(5):919-933.
32. Bass PF, 3rd, Wilson JF, Griffith CH, Barnett DR. Residents' ability to identify patients with poor literacy skills. Acad Med. Oct