Current Use of Global Coronary Heart Disease Risk Assessment by a Sample of US Physicians
By
Benjamin Shillinglaw
A Master’s Paper submitted to the faculty of the University of North Carolina at Chapel Hill
in partial fulfillment of the requirements for the degree of Master of Public Health in
the Public Health Leadership Program.
Chapel Hill 2010
__________________________
Advisor:
____________________________________ Date
_________________________________
Second Reader:
_________________________________
Table of Contents
I. Literature Review……… 3
II. Original Manuscript……… 17
III. Appendix A: Quality and Evidence Tables……… 33
IV. Appendix B: Physicians’ Survey……… 40
V. Appendix C: Manuscript Tables and Figures………... 44
VI. Appendix D: Geographic Regions of Respondents vs Nonrespondents 51
I. Literature Review:
ABSTRACT
Background: Little is known about United States (US) physicians’ understanding and utilization of global CHD risk assessment in clinical practice.
Purpose: To assess the current level of evidence regarding physicians’ use of global CHD risk assessment in primary prevention of cardiovascular disease by examining if there are valid and reliable tools available for clinicians to calculate patients’ global CHD risk scores, if calculation and communication of global risk scores translate into improved patient level outcomes, and if physicians understand/use global risk scoring in primary prevention of CVD.
Methods: The MEDLINE database (from inception to 20 March 2010) was searched for studies involving physicians’ use of global CHD risk scores. Studies of any design were considered
using the search terms, ―global coronary heart disease risk score‖, ―cardiovascular disease‖, ―primary prevention‖, and ―physicians‖. Reference lists from related systematic reviews and
primary articles were searched and additional citations were provided by experts in the field of cardiovascular disease prevention. Studies were limited to those written in English.
Results: The search resulted in one good quality recent systematic review that assessed the tools available for calculation of CHD risk scores, two good quality recent systematic reviews of the literature that assessed whether global CHD scoring results in improved patient outcomes, and three poor to fair quality original physician survey studies that examined physicians’ use of global CHD risk scores.
factors over the short-term, and improve the accuracy of risk perception with no reported clinical harm. Physicians may also overestimate the absolute risk of CHD events and effects of
Inroduction:
The goal of this review was to systematically assess the current level of evidence
regarding physicians’ use of global CHD risk assessment in primary prevention of cardiovascular
disease (CVD). Specifically I sought to answer three questions: (1) Are valid and reliable tools available for clinicians to calculate patients’ global CHD risk scores? (2) Do calculation and communication of global risk scores translate into improved patient level outcomes? (3) Do physicians understand/use global risk scoring in primary prevention of CVD?
Selection of Articles:
To identify relevant articles I searched the MEDLINE database from inception to 20 March 2010 for studies involving physicians’ use of global CHD risk scores. I combined search
terms for global coronary heart disease risk score, cardiovascular disease, primary prevention, and physicians and I limited the search to English language articles. I also reviewed reference lists from related systematic reviews and primary articles and additional citations were provided by experts in the field of cardiovascular disease prevention.
Articles of any study design were considered in the search. All abstracts were reviewed and articles were excluded if they were deemed not applicable to the study questions based on the study populations, interventions, or outcomes assessed. The search resulted in six research articles addressing the three clinical questions. Three original physician survey studies examined physicians’ use of global CHD risk scores, two recent systematic reviews of the literature
assessed whether global CHD scoring results in improved patient outcomes, and one recent systematic review assessed the tools available for calculation of CHD risk scores.
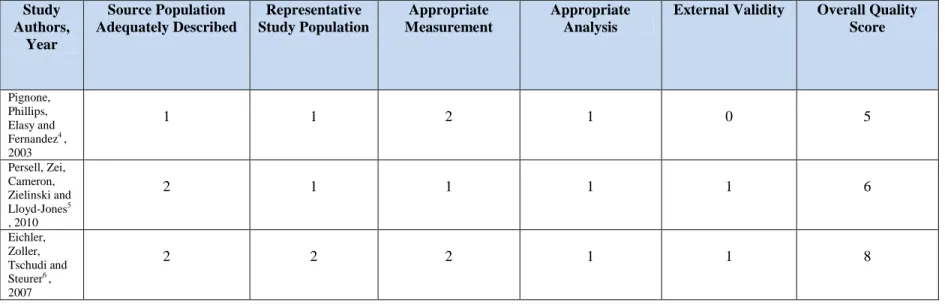
Quality ratings were assigned to each of the six included studies in our review. Quality ratings for the three survey studies were based on a scale from 0-2 (0 = poor, 1 = fair, 2 = good) and assessed overall potential for selection bias, measurement bias, appropriate analysis of the data, and generalizability of the findings from each study. The potential for selection bias in each study was assessed by identifying the source population and determining whether it was adequately described and whether the study population was a representative sample of the source population. Additionally, due to the survey design of each study, non-response error was
assessed and included in the determination of overall potential for selection bias. Measurement bias was assessed by the authors’ descriptions of how each survey was developed, piloted and
validated. When available, the individual surveys were also read to assess the likelihood of measurement error. This was also taken into account for each measurement quality grade. The quality of analysis for each study was assessed by demonstrating use of appropriate statistical methods as well as acknowledgement of, and controlling for, potential confounding factors. Lastly, the grade for potential external validity of each study was given based on the studies applicability to populations outside the study and source populations.
Results:
(1) Are valid and reliable tools available for clinicians to calculate patients’ global CHD risk scores?
One recent systematic review by Sheridan, Pignone, and Mulrow1 , reviewed the available CHD risk calculation tools based on Framingham equations to help guide providers in selecting the best tools for their practices. They searched articles and websites to identify tools available, determine the accuracy of the available tools when information about sensitivity and specificity were given, and to determine the feasibility using these tools in clinical practice. Overall, they identified many available tools in a variety or formats available to clinicians including: risk charts, calculators for PDA’s, spreadsheet programs for computers, and web-based calculators. Some of the web-based tools also included individualized evidence based treatment guidelines with the calculated risk score. Most of the tools they identified displayed good to excellent sensitivity and specificity for the detection of patients at increased CHD risk; however, data available to complete the Framingham calculations in these studies was insufficient in 5-49% of cases with no imputation of average risk factor information to account for this in the analyses.
The review provided evidence to suggest that physicians have many available options for calculating a global CHD risk score. A comprehensive search of the literature was done,
They were unable to compare sensitivities and specificities across studies as there were varying numbers of indeterminate assessments, difference reference standard cut points, and diverse study populations.
(2) Does the use of global CHD risk scoring translate into improved clinical outcomes for patients?
I identified two recent systematic reviews conducted in the U.S. that examined the effect of giving global CHD risk information to physicians and patients on clinical outcomes.
with education alone; however, this study provided the intervention at only one time point, analyzed adherence as a secondary outcome, lacked statistical power, and did not adjust for baseline differences in CHD risk. Lastly, for studies analyzing change in predicted CHD risk they found mixed effects of providing global CHD risk information on changes in predicted CHD risk that were related to the intensity of the intervention. They reported that studies using repeated global risk score presentation or repeated bouts of counseling showed 0.2-2%
reductions in predicted 10-year risk.
This was a methodologically strong review of 18 trials inclusive of over 24,000 patients. Their literature search was comprehensive, clearly outlined, and included searches on multiple databases, hand searching of bibliographies, expert consultation, and related articles searches. Appropriate inclusion and exclusion criteria for the studies they selected were clearly articulated. Studies were only included in the review if they specified global CHD risk information
presentation directly to individuals as a primary intervention and measured one of their outcomes of interest. They used a standard appraisal method to assess study quality. Two independent reviewers assessed the full text articles and assigned a grade of poor, fair, or good. These grades were converted to numerical values (poor = 0, fair = 1, good = 2) that held equal weight for each aspect of internal validity being judged. The scores for each study were then combined and averaged for a final quality rating. Meta-analysis was not done in this review due to the heterogeneity in study designs, study populations and outcomes measured; however, evidence tables were reported for each outcome.
question examined clinical benefits, as they defined them, of a physician’s knowledge of
patients’ global CHD risk score. They also included studies that examined harms associated with
screening using global risk scores as a secondary question. They found that in high risk patients, physician knowledge of CHD risk is associated with increased prescribing of cardiovascular drugs, and improvements in blood pressure. They also reported that one study found no
improvement in proportion of patients at high risk; however, this may have been attributed to the large number of patients at high baseline risk in the study. No studies examined the effect of global risk calculation on actual CHD outcomes and the remaining studies in their review were too methodologically limited to draw significant conclusions. No clinical harms were associated with a patient’s knowledge of their CHD global risk score when presentation was followed by
scheduled follow-up or counseling.
(3) Do physicians understand/use global risk scoring in primary prevention of CVD?
I identified three original physician survey studies that met the criteria for inclusion in this review that assessed physicians’ ability to accurately predict patients global CHD risk score and whether CHD risk scoring is used in clinical practice. One study also assessed the barriers to implementation of risk scoring in physicians who reported never or rarely using global CHD risk scoring.
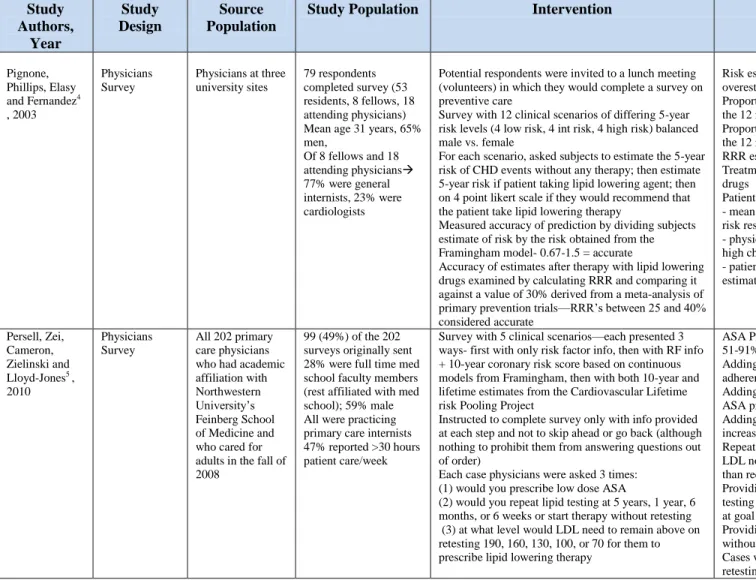
The first article by Pignone, Phillips, Elasy and Fernandez4 examined physicians’ ability to predict the risk of CHD events and the effect of lipid lowering therapy for 12 hypothetical primary prevention scenarios concerning patients with different levels of CHD risk. Each scenario also asked the physician to rate on a 4-point Likert scale whether or not they would recommend lipid lowering therapy for that patient. The authors found that overall; the 5-year CHD risk estimates provided by the physicians were accurate for only 24% of the total responses. Of the responses that were inaccurate, 66% were overestimates while 10% were underestimates of risk. When the physicians were asked to report the relative risk reduction after the patients in each scenario were provided lipid lowering therapy, 43% of their estimates were considered accurate. They also reported that most physicians recommended lipid lowering therapy in every scenario except one.
The authors used a convenience sample of internal medicine residents at three university sites. They recruited a total of 79 respondents by offering an invitation to a lunch. In an effort to increase the validity of their findings, they mention that they did not inform the physicians of the specific nature of the study prior to the lunch meeting; however, it is mentioned that the
compared to those physicians who did not attend the lunch meeting. Furthermore, of those who completed the survey, 53 were residents, 8 were fellows, and 18 were attendings. It is plausible that the difference in knowledge from resident to fellow to attending physician could have biased the results of the survey as it possible that an attending would more accurately estimate a patients CHD risk than a first year resident. The external validity of their results is fair at best as they used a convenience sample of university physicians that is not representative of the general physician population.
The author’s pilot tested their survey, balanced the number of scenarios involving low,
intermediate, and high risk patients, and based the answers on Framingham data. Every physician received the same survey and there was no mention of blinding. Their analysis was appropriate, and they did not attempt to compare the results of residents vs. attendings or cardiologists vs. general internists as their sample size was too small. They also made no mention of how their accuracy grade cut-offs were determined, or what they did in the case of incomplete survey data. Lastly, it is important to note that the physicians completing the survey were not allowed to use any form of risk calculator or chart to help them predict the patients CHD risk. Even when the authors attempted to control for the inherent lack of precision by setting an accuracy threshold, the majority of physicians failed to appropriately estimate CHD risk.
In a second study by Persell, Zei, Cameron, Zielinski, and Lloyd-Jones5 , 202 primary care physicians who had an academic affiliation with Northwestern University’s Feinberg School
of Medicine were mailed surveys to determine how providing 10-year CHD risk estimates influenced preventive cardiology decision making and whether providing lifetime risk
information had any significant impact. Each survey had five clinical scenarios presented in three ways: first with only risk factor information, then with the addition of a calculated 10-year CHD risk score, then with the addition of lifetime CHD risk. The physicians were then asked, after each iteration, whether they would prescribe low-dose aspirin, at what interval they would repeat lipid testing, and at what LDL cholesterol level they would prescribe lipid lowering therapy. Their answers were compared to contemporary guidelines.
Overall, the authors found that 37% of the primary care physicians in their study reported using risk calculating tools never or rarely to make primary preventive treatment decisions. Furthermore, they often made preventive treatment decisions that were not guideline concordant. While most recommended aspirin when the short term coronary risk was low, 20% did not recommend it for a male with a 10-year coronary risk of 15%. For patients not at goal LDL, the physicians recommended repeat testing less promptly than recommended by guidelines, and for patients at goal LDL they recommended repeat testing more frequently than guideline
recommendations. Provision of 10-year CHD risk estimates increased guideline concordant prescribing slightly, but most physicians who gave guideline discordant responses did not change their answer when they were given the 10-year risk information. Adding lifetime risk
information did not alter physicians’ aspirin prescribing decisions appreciably, but did lead more
The authors of this study achieved a 49% response rate (99 total physicians) to their survey with all included physicians having affiliation with the medical school. They reported that 8% of the non-responders were full-time medical school faculty members compared to 28% of the responders. The potential for significant non-response error is present in this study as the authors failed to give any demographic information for the non-responders. They also did not report any information regarding the generation of their survey and whether it was pilot tested prior to deployment raising the likelihood of potential measurement error. The survey also did not have the ability to restrict the physicians from going back to previous questions after they were provided with the different risk levels. The survey was based on valid aspirin and lipid screening/treatment guidelines and all physicians received the same survey. 90-95% of physicians responded to all three scenarios for each question but no mention is made of how incomplete surveys were handled. The generalizability of their results was fair at best, as all physicians were affiliated with one medical center in one city.
In summary, many physicians reported never using CHD risk calculating tools when making primary preventive prescribing decisions. Additionally, even when physicians were presented with 10-year CHD risk estimates, their prescribing and screening behaviors were largely unchanged. It may be important for risk estimation tools to include guideline concordant decision support along with risk estimations to aid clinicians in prevention decisions.
clinical practice. The most common barriers to the use of CHD risk scoring reported were: the feeling that a single risk value does not take into account the complex situation of the patient, that the results of prediction rules may lead to overtreatment, that ―I know my patients well enough‖ to estimate their risk without prediction rules, and that the results of prediction rules are
not helpful for decision making in practice. Interestingly, the authors pointed out that while 58% of physicians argued that a single risk value derived from risk calculations is an
oversimplification, 46% of physicians reported using information derived from a single risk factor to guide preventive therapy.
The authors of this study employed a much larger sample size than that used in previous studies. They achieved a 49% response rate with a final sample size of 356. Although they did sample a large number of physicians from different regions of the country, no characteristics of non-responders were reported. It is possible that the true rate of global CHD risk scoring among Swiss physicians may be even lower as motivated physicians may have been over-represented in this study. Although no pilot testing was done to assess the validity and internal consistency of their survey, they outlined an extensive development process for their survey. They also reported that each questionnaire was done quasi-anonymously and that the authors were blinded from the names of responders. They used simple descriptive statistics to report their findings; however, didn’t mention how missing responses were handled in the analysis. The generalizability of their
results was fair and it is unclear how the attitudes of physicians in Switzerland compare to those of physicians in the U.S and other countries.
interventions are needed to increase the acceptance of these tools in clinical practice in Switzerland. While this may also be valid in the U.S., more data is needed on U.S. physicians attitudes regarding CHD risk scoring.
Conclusion:
Overall, the evidence from the studies reviewed reveal that physicians have difficulty assessing a patient’s global CHD risk and making prescribing decisions based on this risk. These
studies also showed that many physicians in Switzerland do not use global CHD risk scoring and harbor negative attitudes towards its application in clinical practice. Presenting global CHD risk to patients can improve the accuracy of their perceived risk and may also increase intent to initiate preventive therapy. Furthermore, physicians’ use of global CHD risk scoring may
increase prescribing of preventive medications and decrease CHD risk factors in the short-term. Finally, many valid, reliable tools are available in a variety of formats to aid physicians in accurately assessing a patient’s global CHD risk score.
II. Original Manuscript
Current Use of Global Coronary Heart Disease Risk Assessment by a Sample of US
Physicians
Benjamin Shillinglaw Anthony J. Viera Stacey L. Sheridan
Teresa Edwards
Corresponding Author: Anthony Viera, MD, MPH 590 Manning Drive
CB 7595
Chapel Hill, NC 27599 Office: 919-966-0758 Fax: 919-966-6125
ABSTRACT
Background: Use of global coronary heart disease (CHD) risk assessment is recommended to guide primary preventive pharmacotherapy; however, little is known about United States (US) physicians’ understanding and utilization of global CHD risk assessment in clinical practice.
Purpose: This study examined US physicians’ self-reported knowledge and attitudes about global CHD risk calculations, characteristics associated with global CHD risk assessment use, and whether global CHD risk assessment is used to guide primary preventive therapy
recommendations.
Methods: Using a web-based survey of US family physicians, general internists, and
cardiologists, we examined awareness of tools available to calculate CHD risk, perceptions of 10-year CHD risk levels that corresponded to high and low risk, and frequency of using global CHD risk to guide prescription of aspirin, lipid-lowering and blood pressure (BP) lowering therapies for primary prevention. Likert-scales of 0 (lowest) to 5 (highest) were used to assess self-reported attitudes and importance of barriers to use of CHD risk assessments. Characteristics of physicians indicating they use CHD risk assessments were compared in unadjusted and
adjusted analyses.
Results: A total of 952 physicians completed the questionnaire. Of those responding to each question, 100% reported awareness of tools available to calculate CHD global risk scores and over 80% agreed that CHD risk calculation is useful, improves patient care, and leads to better decisions about recommending therapies for CVD prevention; however, only 41.4% of
aspirin therapy recommendations; and 32% use it to guide BP lowering therapy. Only 39% of respondents routinely tell patients their risk score. Physicians who use CHD risk assessments were more likely to classify high and low risk patients in accordance with current guideline thresholds. Physicians who use PDAs were most likely to use CHD risk assessments (adjusted OR 1.54; 95% CI 1.15-2.05).
INTRODUCTION
Coronary heart disease (CHD) was the cause of one out of every six deaths in the U.S. in 2006 and is the largest major killer of American males and females.7 Remarkably, CHD is also largely preventable. According to a case control study of 52 countries, nine easily measured and potentially modifiable risk factors account for over 90% of the risk of an initial acute myocardial infarction (MI).8 Unfortunately, the majority of individuals with elevated CHD risk factors are not using appropriate risk reducing therapies.2 One contributing factor is that clinicians often do not accurately estimate a patients risk for CHD.4
Primary prevention of CHD should be a top priority due to the high rate of first events that are fatal, disabling, or requiring of expensive management.9 The risk for the development of CHD varies greatly among individuals. Effective primary prevention of CHD therefore requires individualized interventions that range in intensity. In order to appropriately select interventions for primary prevention it is necessary to stratify patients based on an assessment of risk for development of cardiovascular disease.10
While guidelines for the management of individual risk factors put forth by the Adult Treatment Panel report of the National Cholesterol Education Program, the Joint National Committee of the National High Blood Pressure Education Program, and the American Diabetes Association exist, these reports also promote adjustment of
intervention intensity based on a patient’s global cardiovascular disease risk.10 Current
diabetes.9 There are many user-friendly, easily accessible tools available for estimating a patients CHD risk including risk charts and risk calculators for personal digital assistants, personal
computers, and web-based use.1 When compared to the full Framingham equations for identifying patients at increased risk, these tools are generally very accurate.1
Effective classification of a patients’ risk for CHD has many advantages in clinical
practice. Firstly, global risk calculation allows improved prediction of incident events. Furthermore, physicians armed with a better understanding of a patient’s actual risk of
developing CHD are better able to identify patients at high risk who need immediate
intervention.3 Global risk scores also provide a reference to help physicians compare the risks of an intervention to the benefits it may provide the patient. Use of global risk may also improve intermediate and long-term outcomes for patients.3 Patients may gain an improved understanding of their risk and the reason for any proposed interventions, which may increase motivation to adhere to any preventive medications that are prescribed.3
While the advantages to using global risk assessment in the primary prevention of CHD have been documented and recommended for use in clinical practice, little is known about the actual use of global CHD risk in clinical practice. The purpose of this study was to examine U.S. physicians’ understanding and utilization of global CHD risk assessments when considering
clinical interventions for primary prevention. METHODS
Overall Design
and automated by survey experts at the Odum Institute for Research in Social Science affiliated with the University of North Carolina at Chapel Hill. Data on physician’s awareness and
attitudes about global CHD risk scores and reported use of such scores in primary
cardiovascular disease prevention were collected through the web-based questionnaire. This study was approved by the Institutional Review Board of the University of North Carolina at Chapel Hill.
Study Sample and Invitations to Participate
The sampling frame was family physicians who are members of the American Academy of Family Physicians (AAFP) and general internists and cardiologists who are members of the American College of Physicians (ACP). A mailing list of 9000 members randomly selected from a database of members of the AAFP (family physicians) and the ACP (general internists and cardiologists) was obtained. The list consisted of 2623 family physicians (377 members were excluded because they were medical students), 3000 general internists, and 3000 cardiologists.
Personalized letters of invitation were mailed to the 8623 physicians. These letters described the study and provided a URL for the online survey with an individualized
identification code to allow tracking of non-responders. At two and four weeks after the initial invitation was sent out, non-respondents were mailed reminder letters. As an incentive to
participate, physicians who wished to do so could have their name entered into a drawing for one of two $500 gift cards.
Variables
Data obtained from the survey included physicians’ awareness of tools available to
risk scores are used to guide prescription of aspirin, lipid-lowering and blood pressure lowering therapies for primary prevention. Additionally, we collected data on attitudes regarding the usefulness of CHD risk scores, and among those who reported not using CHD risk scores, reasons for not doing so. Information regarding respondents’ specialty type, sex, year of graduation from medical school, amount of patient care time, type of practice setting, region of the country, use of electronic medical records and computers in exam rooms, and use of a personal digital assistant (PDA) during patient encounters was also collected.
Analysis
Responses to each of our items were tabulated, and differences were compared by respondent characteristics. Testing for significant differences was performed using analysis of variance (ANOVA) for Likert-scaled outcomes and chi-square for categorical outcomes. Attitudes towards CHD risk scoring were examined using five statements about CHD risk scoring. Physicians responding, ―Strongly Agree‖, or Agree‖ were combined into an ―Agree‖ category, while subjects who responded, ―Disagree‖ or ―Strongly Disagree‖ were combined into a ―Disagree‖ category. Proportions agreeing with each statement were tabulated and compared
between specialty groups. Characteristics of physicians who indicated that they ―occasionally‖, ―most of the time‖, or ―always‖ obtain a calculation of a patients global CHD risk for primary
prevention were compared in unadjusted analyses and then by logistic regression to adjust for specialty, years in practice, amount of patient care time, and PDA use.
Among respondents indicating ‖never‖ or ―rarely‖ calculating a patients global CHD risk
important). The ratings were averaged for each statement and compared in unadjusted analyses by specialty.
The percentage of physicians responding to two questions aimed at classifying a high and low risk patient based on CHD risk score were examined by comparing the responses of
respondents who routinely use CHD risk scoring for primary prevention and those who do not. The percentage of physicians who chose the single high and low guideline concurrent
Framingham-based risk thresholds (> 20% for high risk and < 10% for low risk) was also examined. Physicians’ use of CHD risk scoring to guide primary preventive pharmacological
therapy was examined as well. Respondents indicating that they use CHD risk scoring
―Occasionally‖, ―Most of the time‖, or ―Always or Nearly Always‖, were categorized as those
who use CHD risk scoring to guide preventive therapy and were compared to those do not. Results were also compared by specialty. Statistically significant differences were defined as a p-value <0.05. To assess the potential for nonresponse bias, geographic regions between
respondents and non-respondents were compared. All analyses were performed using Stata 10.1 statistical software (StataCorp, College Station, TX).
RESULTS
Study Participants
general internists, and 290 cardiologists. Nonrespondents were compared to respondents by geographic region, and the two groups were very similar (Appendix D).
Of those who responded, the majority were male (74%), spent more than 75% of work time in office based patient care (56%), use EMR in their practices (59%), have computers in patient exam rooms (56%), and have been in practice for 10 years or more (79%) (Table 1). Small group practices were the most common practice setting (32%), and the most common region of the country practiced in was the South region (33%). Cardiologists (94%) who responded were more likely than general internists (75%) and family physicians (58%) to be male. Cardiologists (88%) were also more likely than general internists (70%) or family physicians (40%) to have been in practice for more than 20 years. General internists and family physicians spent more time in office-based care than cardiologists. Family physicians (62%) were more likely than general internists (37%) and cardiologists (38%) to use a PDA when seeing patients in the office. Awareness and Use of Tools to Calculate Global CHD Risk
All physicians (N=839) who responded to the question, ―Have you heard about tools to
calculate a patients overall risk of coronary heart disease in the next 10 years (global CHD risk)?‖ responded yes (100%). Approximately 41% of respondents reported using global CHD
risk at least occasionally when considering primary prevention of CHD in adults, including 8% who reported always or nearly always doing so. One third of respondents (33%) who use global CHD risk in practice reported using a web-based application, while 29% use a paper chart and 25% use a program on a PDA to obtain their patient’s risk estimate. Few (13%) use other
The majority of respondents (with no significant difference between specialties) agreed or strongly agreed that global CHD risk calculation is useful, improves patient care, leads to better decisions about whether or not to recommend therapies to prevent heart disease events, and increases the likelihood that they will recommend risk reducing therapies to prevent heart disease (Table 2). However, a minority actually reported using global CHD risk to guide their primary preventive pharmacotherapy recommendations. Approximately 40% of respondents who
calculate global CHD risk indicated they use it to guide lipid lowering therapy recommendations; 35% use it to guide aspirin therapy recommendations; and 32% use it to guide blood pressure lowering therapy (Table 3). Cardiologists were more likely to report using CHD risk to guide lipid lowering therapy.
Approximately 39% of respondents who use CHD risk calculation reported that they tell their patients his/her CHD risk estimation, ―most of the time‖, ―nearly always‖, or ―always‖.
Cardiologists were more likely to tell a patient his/her CHD risk estimation (49%) than were family physicians and general internists (36% and 32% respectively) (p<.001).
Physicians who Use Global CHD Risk Assessments
Physicians’ reports of using global CHD risk assessments differed by specialty, years in
CHD risk assessments (p=0.002). Those who indicated they used a PDA when seeing patients were more likely to report using global CHD risk assessments (47% vs. 36% , p=0.001). There were no differences in use of global CHD risk assessments among those who used EMRs or those who had computers/internet connection in exam rooms. After adjusting for specialty, years in practice, office based care time, and PDA use, physicians who reported using a PDA were more likely to use CHD risk assessments than those who reported not using a PDA in practice (OR 1.54; 95% CI 1.15-2.05). Specialty was also an independent predictor of CHD risk
assessment use with cardiologists more likely to use CHD risk assessments, followed by family physicians and general internists respectively (OR 1.45; 95% CI 1.19-1.75).
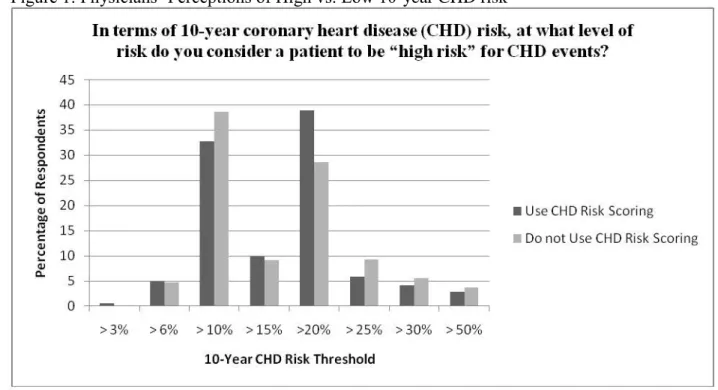
Physicians’ Perceptions of CHD Risk Levels
When asked, ―At what level of risk do you consider a patient to be ―high risk‖ for CHD
events based on 10-year CHD risk levels?‖, 36% of respondents chose a risk threshold of 10% or above, while 33% of respondents chose 20% or above (median 15% or above) (Figure 1). In response to the question, ―Below what level of 10-year CHD risk do you consider a patient to be ―low risk‖ for CHD events?‖, 30% of physicians selected a risk threshold of 10% or less, while 42% of physicians chose a risk threshold of 3% or less (median 6% or less). When physicians’
responses were compared to thresholds suggested by current guidelines (10-year CHD risk 20% or above = high risk, and 10-year CHD risk 10% or less = low risk)9, 11 , those who reported using CHD risk assessments were more likely to select the guideline concordant 10-year CHD risk threshold of 20% or above to indicate high risk (39% ), compared to those who reported not using CHD risk assessments (29%) (p=.002) (Figure 2). No differences were seen for
risk threshold higher than 20% to indicate high risk were significantly less likely to use CHD risk assessments compared to those who do (12% vs. 18% respectively) (p=.03). Similarly,
physicians who used CHD risk assessments were more likely to select the guideline concurrent 10-year CHD risk threshold of 10% or less to classify a ―low risk‖ patient (34%) than those who do not use CHD risk assessments (28%) (p=.04). No differences were seen for respondents who selected risk thresholds above and below 10% to classify a ―low risk‖ patient.
Reasons for Not Using Global CHD Risk Assessments
Among physicians’ who reported not using CHD risk assessments (N=492), the reason
with the highest mean importance rating (2.6 + 1.6) was, ―It is too time consuming‖ (Table 5). Family physicians (2.8) rated this reason higher than general internists (2.6) and cardiologists (2.3) (p=.02). The reason with the next highest mean importance rating was, ―I do not find it useful in practice‖ (2.2 + 1.6). Cardiologists (2.9) rated this reason higher than general internists
(2.0) and family physicians (1.9) (p<.0001). Lack of familiarity with how to use the risk calculation and lack of easy-to-use tools were rated slightly less important, particularly by the family physician and general internist respondents. Lack of accurate tools and a perception that the risk calculation is not valid for [my] patients received ratings indicating they were the least important of the listed reasons.
DISCUSSION
to guide primary preventive pharmacologic therapy is low and used to guide aspirin recommendations by less than a third of physicians.
The major barrier to CHD risk assessment use is the perception that CHD risk assessment is too time consuming. It has been shown previously that one of the main barriers to delivery of preventive health services in primary care is lack of time.12
However, a study by Pollak, Krause, Yarnall, et al., found that even with limited time, primary care physicians address many ―A‖
rated preventive services adequately; including cholesterol and blood pressure management.12 While lack of time during primary care patient visits is certainly a valid concern, there are many tools available that offer very quick and accurate calculation of a patients CHD risk score. 1 Physicians in our study who use a PDA when seeing patients in the clinic were more likely to use CHD risk assessments than those who do not. This suggests a potential of CHD risk calculator programs for PDAs as a method of increasing CHD risk assessments among physicians. Fortunately, several CHD risk calculation tools are already available for PDAs..1
Cardiologists were most likely to indicate that CHD risk scoring is not useful in clinical practice, which could potentially be related to the lower proportion of patients seen for which primary prevention (rather than secondary prevention) is of concern. General internists and family physicians were more likely to indicate that they are not familiar enough with how to use CHD risk calculations, and that there are no accurate or easy tools available to calculate a CHD risk score. These responses suggest a need to develop educational interventions for physicians that discuss the use of global CHD risk calculations in clinical practice.2
The U.S. Preventive Services Task Force has reported that the risk levels for which the benefits of aspirin therapy outweigh the potential harms is a 10-year CHD risk of >4% (> 3% for women) for patients aged 45-59 years, > 9% (> 8% for women) for patients aged 60-69 years, and >12% (> 11% for women) for patients aged 70-79 years.13 Additionally, statin use could be associated with an increase in mortality of 1% in 10-years, which is large enough to outweigh the beneficial effects of statins on CHD mortality in patients with a 10-year CHD risk of < 13%.14 Due in part to these potential harms associated with preventive pharmacotherapy, calculating a patient’s global CHD risk is an important step, allowing adjustment of the intensity of risk factor
management to the overall risk:benefit ratio for the patient.11 9 10 Still, in our sample, the majority of physicians reported they did not use CHD risk assessments to guide primary preventive pharmacotherapy decisions. Overall, only 40% of respondents reported using CHD risk assessments to guide lipid lowering therapy and even less reported using it to guide
recommendations for aspirin therapy. A recent study showed that when 10-year coronary risk information was given to physicians’ prescription of guideline concordant lipid-lowering and aspirin therapies was slightly improved.5
Our findings illustrate the need for interventions to increase knowledge and acceptance of using global CHD risk assessment for guiding primary prevention of CVD. However, the type of intervention that is most effective remains unknown. The use of guideline concordant decision aids, programs embedded in EMRs that automatically calculate and display risk values and action thresholds, and risk charts in patient exam rooms are examples of system improvements that warrant further investigation.
Limitations
The major potential limitation of this study is that of non-response bias. If physicians who responded to our survey were more interested in cardiovascular disease prevention
compared to those who did not respond, then our results may be biased. Physicians who are more interested or passionate about primary prevention of CVD might be more likely to be aware of tools used to calculate global CHD risk and more likely to answer questions in agreement with the utility of global CHD risk score calculation. This would bias our results towards greater awareness and perceived usefulness of CHD risk assessments. Another potential limitation is that of sampling bias. If physicians who are members of the AAFP and ACP are different from physicians who choose not to be members, then our sample may not be reflective more generally of US physicians of the included specialties.
Conclusions
patient motivation. Use of PDAs by physicians may increase CHD risk assessment; however, educational interventions and system improvements are needed to improve U.S. physicians’
III.Appendix A: Quality and Evidence Tables
Table 1: Evidence Table for Studies examining physicians’ use/understanding of global CHD risk scores
Study Authors, Year Study Design Source Population
Study Population Intervention Significant Results
Pignone, Phillips, Elasy and Fernandez4
, 2003
Physicians Survey
Physicians at three university sites
79 respondents completed survey (53 residents, 8 fellows, 18 attending physicians) Mean age 31 years, 65% men,
Of 8 fellows and 18 attending physicians
77% were general internists, 23% were cardiologists
Potential respondents were invited to a lunch meeting (volunteers) in which they would complete a survey on preventive care
Survey with 12 clinical scenarios of differing 5-year risk levels (4 low risk, 4 int risk, 4 high risk) balanced male vs. female
For each scenario, asked subjects to estimate the 5-year risk of CHD events without any therapy; then estimate 5-year risk if patient taking lipid lowering agent; then on 4 point likert scale if they would recommend that the patient take lipid lowering therapy
Measured accuracy of prediction by dividing subjects estimate of risk by the risk obtained from the Framingham model- 0.67-1.5 = accurate
Accuracy of estimates after therapy with lipid lowering drugs examined by calculating RRR and comparing it against a value of 30% derived from a meta-analysis of primary prevention trials—RRR’s between 25 and 40% considered accurate
Risk estimates: accurate for only 24% of responses (66% were overestimates, 10% were underestimates)
Proportion of physicians overestimating risk ranged from 33-99% for the 12 individual questions
Proportion of physicians underestimating risk ranged from 0-29% for the 12 individual questions
RRR estimates: 43% of estimates were accurate
Treatment rec: most physicians recommended treatment with statin drugs
Patient factors effecting degree of overall risk estimation:
- mean degree of overestimation larger for low risk scenarios, int, high risk respectively (7.8x Framingham estimate vs. 2.8x vs. 1.5x) - physicians more likely to overestimate risk for patients with very high cholesterol levels
- patients with other CHD risk factors produced smaller over-estimations than when those factors were absent
Persell, Zei, Cameron, Zielinski and Lloyd-Jones5 ,
2010
Physicians Survey
All 202 primary care physicians who had academic affiliation with Northwestern University’s Feinberg School of Medicine and who cared for adults in the fall of 2008
99 (49%) of the 202 surveys originally sent 28% were full time med school faculty members (rest affiliated with med school); 59% male All were practicing primary care internists 47% reported >30 hours patient care/week
Survey with 5 clinical scenarios—each presented 3 ways- first with only risk factor info, then with RF info + 10-year coronary risk score based on continuous models from Framingham, then with both 10-year and lifetime estimates from the Cardiovascular Lifetime risk Pooling Project
Instructed to complete survey only with info provided at each step and not to skip ahead or go back (although nothing to prohibit them from answering questions out of order)
Each case physicians were asked 3 times: (1) would you prescribe low dose ASA
(2) would you repeat lipid testing at 5 years, 1 year, 6 months, or 6 weeks or start therapy without retesting (3) at what level would LDL need to remain above on retesting 190, 160, 130, 100, or 70 for them to prescribe lipid lowering therapy
ASA Prescribing:
51-91% guideline concurrent with RF info alone
Adding 10-year risk of 15% improved this 80% to 93% guidelines adherent
Adding low 10-year risk (2-3%) reduced non-guideline concordant ASA prescribing
Adding lifetime risk that was mod-high with low 10-year risk increased non-concordant ASA prescribing
Repeat Lipid Testing:
LDL not at ATPIII goal, physicians often selected wait time longer than recommended 6-months
Providing high lifetime risk increased immediate prescribing without testing (not guideline concordant) from 2-12% in patient who was not at goal with low 10-year risk
Providing high 10-year risk and lifetime risk increased prescribing without testing—guideline concordant
Compared physician answers to answers based on contemporary guidelines (AHA guidelines for ASA and NCEP ATPIII for cholesterol)
Overall, neither provision of 10-year estimates nor provision of lifetime estimates changed recs for timing of retesting Prescribing Lipid Lowering therapy:
44-75% of time initiated treatment concordant with guidelines with RFs only
Providing lifetime estimate led more physicians to lower threshold for prescribing- not guideline concordant
Addition of 10 year or 10 year and lifetime risk info led to increase in guideline concordant responses
Eichler, Zoller, Tschudi and Steurer6 , 2007
Physicians Survey
Physicians in the field of general medicine (GP’s and specialists for general internal medicine) working in their own practice in two swiss regions 1723 total general physicians
Recruited a sample of 772 of which 380 responded (49.3% response) excluded 24 who stated that they did not work as GP anymore 356 final Most docs
experienced—median time interval since medical license 25 years 63.7 percent work as GP
Surveys were sent to all eligible physicians in one region and a sample of eligible physicians from another region with a letter explaining the study—second mailing after 3 weeks to non-respondents
Contained a set of potential barriers from 3 different dimensions: lack of knowledge; distrust; practicability aspects
One open ended question asked for other reasons for rarely or never use of prediction rules
Collected data about frequency of use of prediction rules in three categories (often, rarely, never) Only physicians who answered never or rarely were included
73.9% (263/356) of GPs reported that they rarely or never used cardiovascular prediction rules while 22.5% reported tp use them often (13 with missing data)
Of the 263 who rarely or never used:
- 58% stated they did not use prediction rules because ―a single risk value does not take into account the complex situation of the patient‖ - 54% because ―the results of prediction rules may lead to
overtreatment‖
- 51% agreed to the statement ―I do not use prediction rules as I know my patients well and can estimate their global risk correctly without a prediction rule‖
- statements in the dimensions lack of knowledge, of aspects of practicability were much less common (4-35%)
Table 2: Evidence Table for Systematic Reviews examining effect of global CHD risk scores on clinical outcomes
Study Authors, Year Study Designs Included
Characteristics of Included Studies Characteristics of Included Populations Characteristics of Intervention Main Results
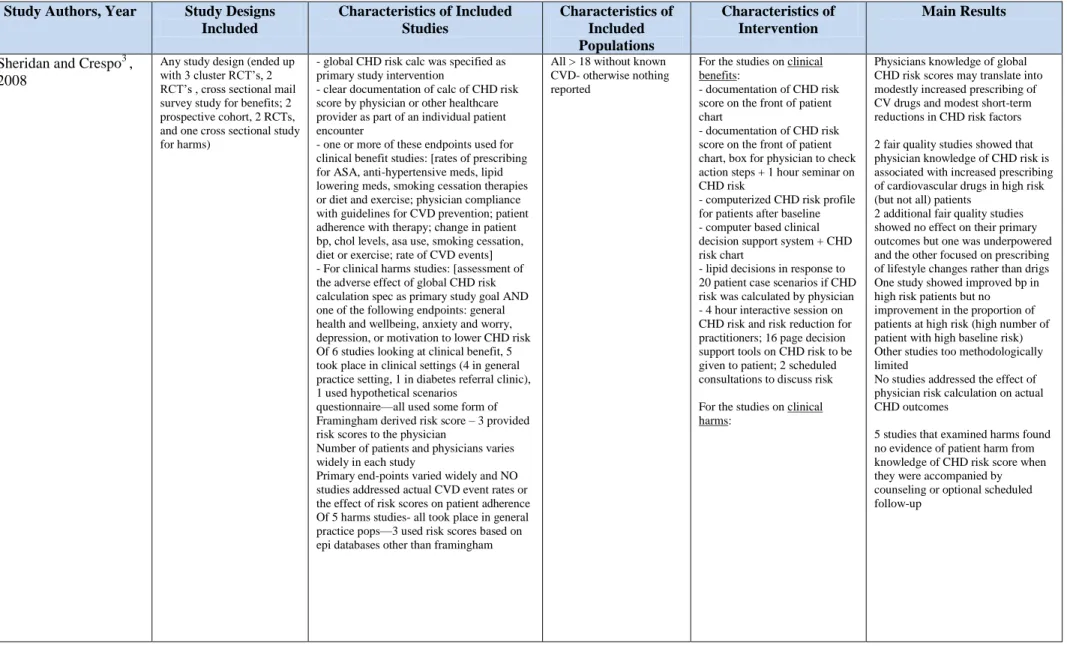
Sheridan and Crespo3 , 2008
Any study design (ended up with 3 cluster RCT’s, 2 RCT’s , cross sectional mail survey study for benefits; 2 prospective cohort, 2 RCTs, and one cross sectional study for harms)
- global CHD risk calc was specified as primary study intervention
- clear documentation of calc of CHD risk score by physician or other healthcare provider as part of an individual patient encounter
- one or more of these endpoints used for clinical benefit studies: [rates of prescribing for ASA, anti-hypertensive meds, lipid lowering meds, smoking cessation therapies or diet and exercise; physician compliance with guidelines for CVD prevention; patient adherence with therapy; change in patient bp, chol levels, asa use, smoking cessation, diet or exercise; rate of CVD events] - For clinical harms studies: [assessment of the adverse effect of global CHD risk calculation spec as primary study goal AND one of the following endpoints: general health and wellbeing, anxiety and worry, depression, or motivation to lower CHD risk Of 6 studies looking at clinical benefit, 5 took place in clinical settings (4 in general practice setting, 1 in diabetes referral clinic), 1 used hypothetical scenarios
questionnaire—all used some form of Framingham derived risk score – 3 provided risk scores to the physician
Number of patients and physicians varies widely in each study
Primary end-points varied widely and NO studies addressed actual CVD event rates or the effect of risk scores on patient adherence Of 5 harms studies- all took place in general practice pops—3 used risk scores based on epi databases other than framingham
All > 18 without known CVD- otherwise nothing reported
For the studies on clinical benefits:
- documentation of CHD risk score on the front of patient chart
- documentation of CHD risk score on the front of patient chart, box for physician to check action steps + 1 hour seminar on CHD risk
- computerized CHD risk profile for patients after baseline - computer based clinical decision support system + CHD risk chart
- lipid decisions in response to 20 patient case scenarios if CHD risk was calculated by physician - 4 hour interactive session on CHD risk and risk reduction for practitioners; 16 page decision support tools on CHD risk to be given to patient; 2 scheduled consultations to discuss risk
For the studies on clinical harms:
Physicians knowledge of global CHD risk scores may translate into modestly increased prescribing of CV drugs and modest short-term reductions in CHD risk factors
2 fair quality studies showed that physician knowledge of CHD risk is associated with increased prescribing of cardiovascular drugs in high risk (but not all) patients
2 additional fair quality studies showed no effect on their primary outcomes but one was underpowered and the other focused on prescribing of lifestyle changes rather than drigs One study showed improved bp in high risk patients but no improvement in the proportion of patients at high risk (high number of patient with high baseline risk) Other studies too methodologically limited
No studies addressed the effect of physician risk calculation on actual CHD outcomes
Sheridan, Viera, Krantz, Ice, Steinman, Peters, Kopin and Lungelow2 , 2010
All study designs (ended up with 3 cluster RCTs, 11 traditional RCTs, 3 quasi experimental studies, 1 open label follow-up of an RCT)
14 took place in clinical settings (9 general practice, 5 in specialty clinics), 4 in community settings (2 in work sites, 2 in individuals homes)
10 studies provided Framingham risk score, 6 used other risk score, one did not use formal calculator, one gave 4 different risk scores
All studies specified global CHD risk presentation as primary intervention of part of multi-part intervention
All studies clearly documented the presentation of CHD risk directly to individuals and measured an outcome of interest (accuracy of risk perception, intent to start asa, antihypertensive, lipid lowering meds, smoking cessation therapies, diet, or exercise, adherance to therapy, or change in predicted global CVD risk or CVD event rates)
Six studies determined to be of good quality, 12 of fair quality
Adults with no history of CVD
Individuals in nearly all studies averages moderate (6-10%) to high (>10%) risk scores as defined by current US asa guidelines
For risk perception outcome: - assess risk before and after presentation of global risk info - assess risk perception with global risk pres alone vs. + education
- assess risk perception with global risk + counseling
For Intent to start therapy: - Global risk info alone - Global risk info + education - Global risk info + counseling - global risk info + results of decision analysis
For adherence to therapy: - risk + educ vs. educ alone
For change in predicted CHD risk:
- repeated presentations of risk info
- repeated counseling
For Risk Perception: Global risk info, alone or with accompanying education or counseling increases the accuracy of perceived risk—evidence suggests best expected improvement in individuals ability to correctly categorize their risk is ~10% For intent to start therapy: Global risk info with education increases intent to start therapy by 15-20 absolute percentage points- larger effect sizes when risk is combined with counseling instead of education alone
For adherence to therapy: 1 cRCT small, non-statistically significant increase in adherence to decisions to take statins among those randomized to risk + education vs. education alone.
Risk + education reduced the number of participants missing a dose of statins in the past week compared with education alone
Table 3: Evidence Table for Systematic Review examining tools available for CHD risk calculation
Study Authors, Year
Study Designs Included
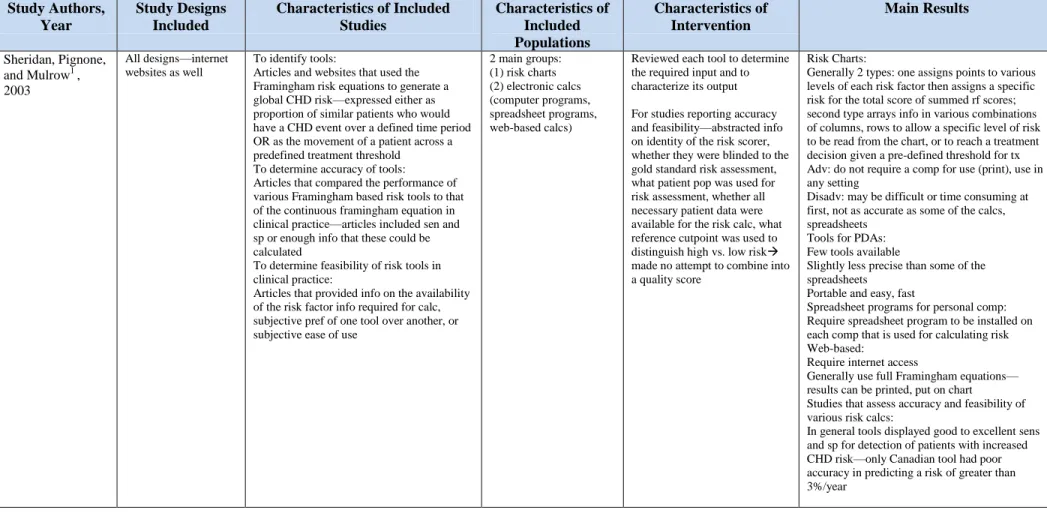
Characteristics of Included Studies Characteristics of Included Populations Characteristics of Intervention Main Results Sheridan, Pignone,
and Mulrow1 ,
2003
All designs—internet websites as well
To identify tools:
Articles and websites that used the Framingham risk equations to generate a global CHD risk—expressed either as proportion of similar patients who would have a CHD event over a defined time period OR as the movement of a patient across a predefined treatment threshold
To determine accuracy of tools: Articles that compared the performance of various Framingham based risk tools to that of the continuous framingham equation in clinical practice—articles included sen and sp or enough info that these could be calculated
To determine feasibility of risk tools in clinical practice:
Articles that provided info on the availability of the risk factor info required for calc, subjective pref of one tool over another, or subjective ease of use
2 main groups: (1) risk charts (2) electronic calcs (computer programs, spreadsheet programs, web-based calcs)
Reviewed each tool to determine the required input and to characterize its output
For studies reporting accuracy and feasibility—abstracted info on identity of the risk scorer, whether they were blinded to the gold standard risk assessment, what patient pop was used for risk assessment, whether all necessary patient data were available for the risk calc, what reference cutpoint was used to distinguish high vs. low risk
made no attempt to combine into a quality score
Risk Charts:
Generally 2 types: one assigns points to various levels of each risk factor then assigns a specific risk for the total score of summed rf scores; second type arrays info in various combinations of columns, rows to allow a specific level of risk to be read from the chart, or to reach a treatment decision given a pre-defined threshold for tx Adv: do not require a comp for use (print), use in any setting
Disadv: may be difficult or time consuming at first, not as accurate as some of the calcs, spreadsheets
Tools for PDAs: Few tools available
Slightly less precise than some of the spreadsheets
Portable and easy, fast
Spreadsheet programs for personal comp: Require spreadsheet program to be installed on each comp that is used for calculating risk Web-based:
Require internet access
Generally use full Framingham equations— results can be printed, put on chart
Studies that assess accuracy and feasibility of various risk calcs:
Table 4: Quality Ratings Table for Included Survey Studies: Each category was rated 0-2 for each study. 0 = poor, 1 = fair, 2 = good.
Study Authors,
Year
Source Population Adequately Described
Representative Study Population
Appropriate Measurement
Appropriate Analysis
External Validity Overall Quality Score
Pignone, Phillips, Elasy and Fernandez4 , 2003
1 1 2 1 0 5
Persell, Zei, Cameron, Zielinski and Lloyd-Jones5
, 2010
2 1 1 1 1 6
Eichler, Zoller, Tschudi and Steurer6 ,
2007
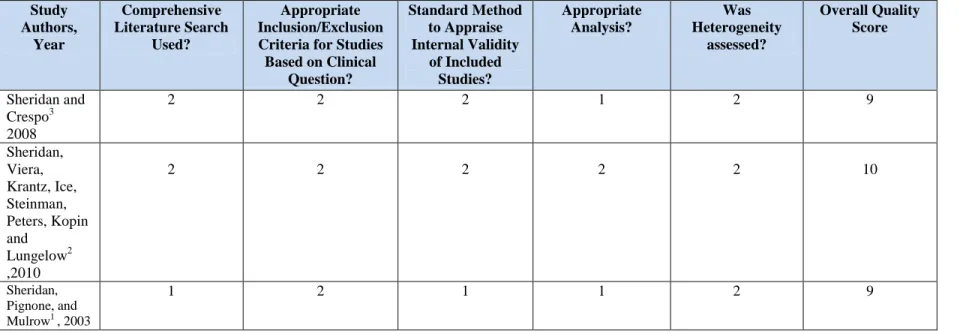
Table 5: Quality Ratings Table for Included Systematic Reviews: Each category was rated 0-2 for each study. 0 = poor, 1 = fair, 2 = good.
Study Authors,
Year
Comprehensive Literature Search
Used?
Appropriate Inclusion/Exclusion Criteria for Studies Based on Clinical
Question?
Standard Method to Appraise Internal Validity
of Included Studies?
Appropriate Analysis?
Was Heterogeneity
assessed?
Overall Quality Score
Sheridan and Crespo3 2008
2 2 2 1 2 9
Sheridan, Viera, Krantz, Ice, Steinman, Peters, Kopin and
Lungelow2 ,2010
2 2 2 2 2 10
Sheridan, Pignone, and
Mulrow1 , 2003
IV.Appendix B: Physicians’ Survey
This first section is about your clinical practice.
Do you see patients in the office or other ambulatory care setting?
o Yes
o No <If no, person is not eligible for this survey --- ―We are sorry, but you must be active in office-based patient care to participate.‖ Please click the Submit button below so we can remove you from our mailing list. END.>
Please indicate your specialty:
o Cardiology
o Family medicine
o General internal medicine
o Other _____________________
Approximately what percent of your work time is spent in office-based patient care?
o 75% or more
o Between 50 and 75%
o Between 25 and 50%
o Less than 25%
Which of the following best describes your office practice setting?
o Solo practice
o Small group practice (2-9 clinicians)
o Large single specialty group (10+ clinicians)
o Large multi-specialty group (10+ clinicians)
o Academic group practice
o Other _______________________
Does your office practice use an electronic medical record?
o Yes
o No
In your office practice, do you use computers in the exam rooms?
o Yes
o No <SKIP NEXT QUESTION>
<If yes> Are the computers in the exam rooms connected to the Internet?
o Yes
o No
o Yes
o No
This section is about global coronary heart disease (CHD) risk scores—that is, estimates of the likelihood of coronary heart disease events calculated by combining patients’ risk factors in an empirical equation-- and tools for their calculation.
Have you heard about tools to calculate a patients overall risk of coronary heart disease in the next 10 years (global CHD risk)?
o Yes
o No <SKIP REMAINDER OF THIS SECTION>
In terms of 10-year coronary heart disease (CHD) risk, at what level of risk do you consider a patient to be ―high risk‖ for CHD events?
o 3% or above
o 6% or above
o 10% or above
o 15% or above
o 20% or above
o 25% or above
o 50% or above
In terms of 10-year coronary heart disease (CHD) risk, below what level of risk do you consider a patient to be ―low risk‖ for CHD events?
o 3% or less
o 6% or less
o 10% or less
o 15% or less
o 20% or less
o 25% or less
o 30% or less
o 50% or less
When considering primary prevention of coronary heart disease in adults, how often do you obtain a calculation of a patient’s global (overall) coronary heart disease risk?
o Never
o Rarely (one to two out of 10 adults)
o Occasionally (three to five out of 10 adults)
o Most of the time (six to eight out of 10 adults)
o Always or nearly always (nine to ten out of 10 adults)
On a scale of 0 to 9, where 0 is not at all important and 9 is extremely important, rate the importance of each of the following reasons why you never or rarely obtain a calculation of a patient’s global (overall) coronary heart disease risk
o I am not familiar enough with how to use the risk calculation
o I do not find it useful in practice
o There are no accurate tools available for obtaining the calculation
o There are no easy to use tools available for obtaining the calculation
o It is too time consuming
o I do not think that the calculated heart disease risk is valid for my patient population
o Other __________________
<Those who ―never‖ calculate risk skip this question>
Which one of the following do you most commonly use to obtain a patient’s global (overall) coronary heart disease risk estimate?
o A paper chart
o A web-based application
o A non-web-based computer program (e.g., spreadsheet calculator on personal computer)
o A program on a personal digital assistant
o Other _________________
Please indicate your level of agreement or disagreement with the following statements.
Strongly
Agree Agree Disagree
Strongly Disagree
I find global CHD risk calculation useful. o o o o
Global CHD risk calculation wastes time.
o o o o
Global risk calculation improves patient
care. o o o o
Global CHD risk calculation leads to better decisions about whether or not to recommend therapies to prevent heart disease events.
o o o o
Global CHD risk calculation increases the likelihood that I will recommend risk-reducing therapies to prevent heart disease.
o o o o
How often do you tell the patient his/her global (overall) coronary heart disease risk estimate?
o Never
o Rarely (one to two out of 10 adults for whom I calculate risk)
o Most of the time (six to eight out of 10 adults for whom I calculate risk)
o Always or nearly always (nine to ten out of 10 adults for whom I calculate risk)
How often do you use the global (overall) coronary heart disease risk estimate to guide your recommendations about lipid lowering therapy?
o Never
o Rarely (one to two out of 10 adults)
o Occasionally (three to five out of 10 adults)
o Most of the time (six to eight out of 10 adults)
o Always or nearly always (nine to ten out of 10 adults)
How often do you use the global (overall) coronary heart disease risk estimate to guide your recommendations about aspirin therapy?
o Never
o Rarely (one to two out of 10 adults)
o Occasionally (three to five out of 10 adults)
o Most of the time (six to eight out of 10 adults)
o Always or nearly always (nine to ten out of 10 adults)
How often do you use the global (overall) coronary heart disease risk estimate to guide your recommendations about blood pressure lowering therapy?
o Never
o Rarely (one to two out of 10 adults)
o Occasionally (three to five out of 10 adults)
o Most of the time (six to eight out of 10 adults)
o Always or nearly always (nine to ten out of 10 adults)
A few final questions…
In what year did you graduate from medical school? <drop down menu>
Please indicate your sex:
o Female
o Male
Which of the following is the closest approximation of the region of the country in which you practice?
o Northeast
o Southeast
o Midwest
V. Appendix C: Manuscript Tables and Figures
Table 1: Characteristics of Respondents (n=952)
All Family
physicians (n=390) General Internists (n=272) Cardiologists (n=290) P-value % % % %
% Male 73.6 57.8 74.6 94.3 <0.001
Years in Practice <0.001
> 20 10-19 <10 63.1 18.8 18.1 40.2 26.0 33.9 70.2 19.9 9.9 88.0 8.0 4.0
Region of country 0.02
Northeast South Midwest West 23.7 33.2 24.2 18.9 18.3 34.3 24.5 22.9 25.7 33.6 24.2 16.6 29.3 31.4 23.9 15.4
Time spent in office based care <0.001
> 75% 51-74% 50% 25-49% <25% 56.5 14.7 8.5 10.2 10.0 71.0 9.5 5.6 9.0 4.9 63.5 11.1 6.6 6.6 12.2 30.3 25.1 14.3 15.3 15.0
Practice setting <0.001
Solo Practice
Small Group (2-9 clinicians) Large Single Specialty group (10+ clinicians)
Large multi-specialty group (10+ clinicians) Academic group Other 12.5 32.0 11.8 13.9 20.6 9.2 9.7 36.7 9.7 13.9 21.8 8.2 14.8 32.6 4.8 18.5 17.0 12.2 14.1 25.2 21.0 9.7 22.4 7.6
Use EMR 59.2 59.4 58.2 59.9 0.91
Computers in exam rooms 55.5 56.8 54.1 55.2 0.78
Internet connection for computers in exam rooms
94.1 92.7 95.9 94.3 0.46
Table 2: Percentage of respondents who agree with the given statements regarding Global CHD Risk assessment
All Family
Physicians
General Internists
Cardiologists P- value
% % % %
I find global CHD risk calculation useful (N=834)
83.8 85.6 80.9 84.0 0.33
Global CHD risk calculation wastes time (N=811)
18.7 17.1 18.3 21.4 0.40
Global risk calculation improves patient care (N=825)
80.9 82.8 80.6 78.5 0.41
Global CHD risk calculation leads to better decisions about whether or not to
recommend therapies to prevent heart disease events
(N=819)
81.1 82.8 82.8 77.3 0.19
Global CHD risk calculation increases the likelihood that I will recommend risk-reducing therapies to prevent heart disease (N=809)
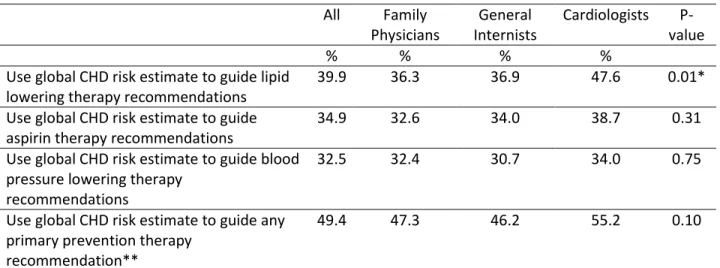
Table 3: Physicians’ Reports of Using CHD Global Risk Assessment to Guide Primary Prevention Pharmacologic Recommendations (N=802)
All Family
Physicians
General Internists
Cardiologists P- value
% % % %
Use global CHD risk estimate to guide lipid lowering therapy recommendations
39.9 36.3 36.9 47.6 0.01*
Use global CHD risk estimate to guide aspirin therapy recommendations
34.9 32.6 34.0 38.7 0.31
Use global CHD risk estimate to guide blood pressure lowering therapy
recommendations
32.5 32.4 30.7 34.0 0.75
Use global CHD risk estimate to guide any primary prevention therapy
recommendation**
49.4 47.3 46.2 55.2 0.10
* Significance of pairs tested using Pearsons Chi squared. P<.005 between cardiologists and Family Medicine physicians; p< .008 between Cardiologists and General Internists.
Table 4: Characteristics of Physicians who Report Using CHD Risk Assessment (n=952)
% P- value
All 41.4
Specialty <0.001*
Family medicine Internal medicine Cardiology 41.7 31.9 49.4
Years in practice 0.02
> 20 10-19 <10 38.9 49.7 41.3
Sex: 0.92
Male Female
41.6 41.2
Region of country: 0.48
Northeast Southeast Midwest West/West coast 44.0 42.0 37.0 43.1
Time spent in Office based patient care: 0.002**
> 75% 51-74% 50% 25-49% <25% 36.3 50.8 57.5 43.7 40
Office Setting: 0.37
Solo practice Small group
Large Single Specialty Large Multi-specialty Academic Group Other 39.4 42.1 44.2 33.1 45.9 41.1
Use EMR: 0.71
Yes No
40.9 42.2
Computers in Exam Rooms: 0.67
Yes No
42.0 40.6
Internet Connection available for computers in Exam Rooms: 0.53
Yes No
42.5 36.7
PDA Use: 0.001
Yes No
47.1 36.2
*Chi squared significance tests between paired groups gave p< .072 between Cardiologists and Family Medicine physicians; p< .0001 between Cardiologists and General Internists; and p< .018 between Family Medicine physicians and General Internists.