STEFAN JOHANNES GRIMBERG. Biofilm Growth and Blodegradation
of Ozonated Natural Organic Matter on Activated Carbon.
(Under the direction of FRANCIS A. DIGIANO.)
Biological activity on granular activated carbon (GAC)
offers an encouraging possibility for removal of organic
material in water purification processes. Natural organic
matter (NOM), the main organic pollutant in drinking water,
is generally considered to be resistant to biological
degradation. Preozonation enhances the NOM biodegradabi1ity.
Ozonated NOM could therefore serve as a primary substrate
for biofilm establishment. The degree of NOM blodegradation
in a GAC column is a function of column length due to the
heterotrophic NOM characteristics. Readily degradable NOM
fractions are degraded at the top of the column whereas
fractions more resistant to microbial metabolism are
degraded deeper in the bed.
Three fixed-film CSTRs in series were used to observe
the performance of the full scale GAC column. NOM
blodegradation along the GAC column was described with
biofilm observations and bioklnetic tests in each of the
CSTRs. Steady state removal of ozonated NOM through the
three CSTRs (EBCT = 15 min) was 40 %.
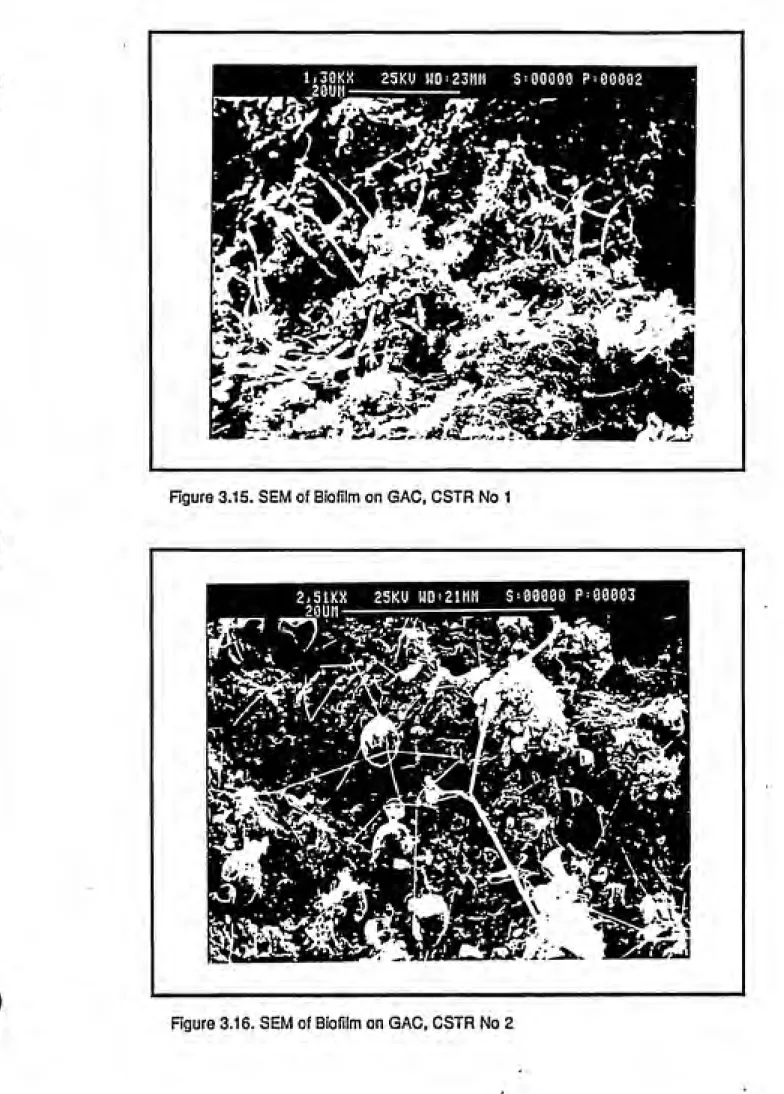
Scanning electron microscopy revealed that the observed
biofilm consisted of filamentous growth, extracellular
material, actinomycetes and distinct singular organisms. No
significant difference between the biofilm structure among
the CSTRs was observed.
High pressure size exclusion chromotography conducted on
the NOM effluents of the three CSTRs suggest that specific
NOM fractions are removed at different locations in the bed.
First order NOM blodegradation rate coefficients of
1 x 10 1/day, determined in-situ, were found in each CSTR.
However, the concentration where no blodegradation could be
that the microbial community adapts to the specific NOM
composition and maximizes its metabolic rate.
An attempt was made to determine in-situ biomass
concentration in the fixed film CSTR using ^^P upake rates.
The uptake rate of radiolabled phosphorus was correlated to
the amount of cells in suspended cultures. However,
adsorption of HPP4 onto GAC interfered with the
interpretation of the ^^P uptake rate tests conducted on the
ACKNOWLEDGEMENTS
I want to thank my advisor, Francis A. DiGiano, for his
steady interest and support in this work. Even though his
time was very limited in the last phase of this project he
made every effort to be involved in the progress made. Many
thanks to my committee, Micheal D. Aitken and Frederic K.
Pfaender, who gave lots of valuable suggestions in the
experimental design and helped interpreting the results
I want to J;hank the friends I was able to meet during
the last two years, Alex. Harriet, Michele, Steve. Carolyn.
Warren. David, Shiou Ling, Andy, Susan, Chris and many more,
who made the time in Chapel Hill worth while. A special
thanks to Joe Pedit, who developed the mathematical models.
I am very thankful to Jan DeWaters, my future wife, who
worked hard on my written English so that other people might
^^i^^
TABLE OF CONTENTSPage
Abs tract...1
Acknowledgements...iii
Table of Contents...Iv List of Tables...vi
List of Figures...vii
Chapter 1 . INTRODUCTION...1
1.1 Background...1
1.2 Objectives...3
Chapter 2. LITERATURE OVERVIEW___... . ...4
2.1 Applications of Granular Activated Carbon (GAC)...4
2.2 Characterization of Blofiln Behavior - The BAG Process...7
2.2.1 Biofilm Establishment...7
2.2.2 Biodegradation in the Biofilm...8
2.2.3 Interaction of Biodegradation and Adsorption: Mathematical Model...14
2.2.4 Suspended Versus Attached growth -Biokinetic Models...19
2.2.5 NOM in Drinking Water Application...21
2.3 Sunmary...26
Chapter 3. ADSORPTION AND BIODEGRADATION IN GAC FIXED-FILM CSTRs...27
3.1 Experinental Methods...27
3.1.1 Natural Organic Matter (NOM)...27
3.1.2 Experimental Set-up...31
3.1.3 Analytical Methods...37
3.2 Results and Discussion...39
3.2.1 Breakthrough Curves...39
3.2.2 Biofilm Growth on GAC...61
3.2.3 The Effect of BAC Treatment on the NOM Mixture...68
3.3 Sunnary...73
Chapter 4. IN-SITU BIOKINETIC TESTS...76
4.1 Background...76
4.1.1 Theory of In-situ Test...76
4.1.2 Biodegradation of NOM Fractions...79
4.1.3 Effect of the Mass Transfer Coefficent on the Flux Concentration Relationship...82
4.2. Experiaental Methods...85
4.2.1 Experimental Procedure for In-situ Rate Test...85
4.2.2 Estimating the Biofilm Thickness...88
CONCENTRATION USING ^^P UPTAKE RATES...103
5. 1 Background...103
5.2 Experlnental Methods...105
5.2.1 Batch ^^P Uptake Rate Test...105
5.2.2 ^^P Uptake Rate Tests in Biofilm CSTRs...106
5.2.3 Effect of ^^P Adsorption on GAC...109
5.3 Results and Discussion...110
5.3.1 ^^P Batch Rate Tests...110
5.3.2 ^^P Uptake Rates in Biofilm CSTRs...112
5.3.3 Adsorption of ^^P on GAC...125
5.4 Sunnary...128
CHAPTER 6. CONCLUSIONS AND RECOMMEMDATIONS... 130
6.1 Conclusions...130
6.2 Reconmendations...131
References...132
Appendix...141
1.1 Biodegradation of NOM Mixture in a Biofilm CSTR...141
1.2 Effect of Mass Transfer Coefficient on Flux-Concentration Relationship...144
LIST OF TABLES
2 . 1 Summarized Biof i Im Models...15
3 . 1 Ozonation Ope rat ing Parameters...30
3.2 Composition of Nutrient and Buffer Solution...32
3.3 Summarized Experimental Conditions for
Breakthrough Experiments...40
3.4 Summarized Results from NOM Breakthrough
Experiments...74
4.1 Summarized Experimental Conditions for In-situ
Rate Tests...91
4.2 Summary of First Order Rate Constants...100
5.1 Summary of Experimental Conditions for ^^P
LIST OF FIGURES
2.1 Concentration Profile around a GAC particle at
Different Stages of Operation...11
2.2 Predicted Effluent Concentration for Biodegradable and Adsorbable Component in a CSTR...18
3 . 1 Schematic of the Ozonation Set-up...29
3.2 Schematic of a Fixed-Film CSTR...33
3. 3 NOM Breakthrough Curves for Run No 1...42
3.4 Prediction of Adsorption Breakthrough Curves for One Component for Three CSTRs in Series ...43
3.5 NOM Breakthrough Curves for Run No. 2...46
3.6 NOM Breakthrough Curves for Run No. 3...48
3.7 Normalized NOM Breakthrough Curves for Run No. 1....51
3.8 Predicted Breakthrough Curve for Mixture of Biodegradable/Slightly Adsorbable and Nonbiodegradable/Adsorbable Components in a CSTR....54
3.9 Normalized NOM Breakthrough Curves for Run No. 2....55
3.10 Normalized NOM Breakthrough Curves for Run No. 3....56
3.11 Cumulative NOM Loading on GAC in Run No. 1...58
3.12 Cumulative NOM Loading on GAC in Run No. 2...59
3.13 Cumulative NOM Loading on GAC in Run No. 3...60
3. 14 Breakthrough Curve for Run No. 5...62
3.15 SEM of Biofilm on GAC of CSTR 1..___...64
3.16 SEM of Biofilm on GAC of CSTR 2...64
3.17 SEM of Biofilm on GAC of CSTR 3...65
3.18 SEM of Unpopulated GAC...65
3.19 SEM of Biofilm on GAC using Ruthenium Red Stain...67
3.20 SEM of Biofilm on GAC using no Ruthenium Red Stain..67
3.21 HPSEC Chromatogram of NOM Feed...69
3.23 Change in NOM Composition Throughout Experimental
Set-up: 3 CSTRs in Series...72
4.1 Flux into Biofilm vs. Biofilm SubstrateConcentration for Hypothetical Two Component
System...81
4.2 Effect of the Mass Transfer Coefficient on
the Flux into the Biofilm vs. Substrate Biofilm
Concentration Curves...83
4.3 Schematic of CSTR Configuration...86
4.4 Flowdiagram for In-situ Test Experiment...87
4.5 Results of In-situ Rate Test No 1: Flux into Biofilm
vs. Biofilm Substrate Concentration...92
4.6 Results of In-situ Rate Test No 2- Flux into Biofilm
vs. Biofilm Substrate Concentration...94
4.7 Results of In-situ Rate Test No 3: Flux into Biofilm
vs. Biofilm Substrate Concentration...95
4.8 Results of In-situ Rate Test No 4: Flux into Biofilm
vs. Biofilm Substrate Concentration...965.1 Flowchart of ^^P - Uptake Rate Experiments...107
5.2 Initial ^^P Uptake Rates vs. Suspended Cell
Concentration...Ill
5.3 Relative ^^P Activity vs. Time for Rate No. 3.1....114
5.4 Relative ^^P Activity vs. Time for Rate No. 3.2....115
5.5 Relative ^^P Activity vs. Time for Rate No. 3.3....116
5.6 Relative ^^P Activity vs. Time for Rate No. 4.1....119
5.7 Relative ^^P Activity vs. Time for Rate No. 4.2....120
5.8 Relative ^^P Activity vs. Time for Rate No. 4.3....121
5.9 Relative ^^P Activity vs. Time for Rate No. 5.1....122
5.10 Relative ^^P Activity vs. Time for Rate No. 5.2....123
1.1 Background
Chlorination of natural organic matter (NOM) in
drinking water treatment forms trihalomethanes (THMs), as
well as other disinfection byproducts (DBFs) (Symons et al.
1981, Krasner et al. 1989). THMs are presently regulated and
other DBFs will be regulated in the near future (expected
1991) (McGuire. 1989).
To reduce the DBFs in the drinking water, the
disinfectant chlorine could be replaced by other chemicals
(e.g. ozone, chloramines). Since the past research focused
primarily on identifying chlorination byproducts little is
currently known about the toxicity of DBFs resuting from
disinfectants other than chlorine (Kool et al. 1986). An
alternative to changing the disinfectant is to improve the
removal of NOM in drinking water.Activated carbon is well known in the U.S. as an
effective means to remove taste and odor causing compounds
adsorb a large variety of organic compounds. It may also be
useful for removal of NOM (Rlttmann et al. 198U). The
complex and hydrophilic nature of NOM does limit its
adsorbabi1ity. To circumvent this problem, it has been
suggested that GAC be considered as a support media for
biofilm to encourage biodegradation of NOM as well as SOCs
while still functioning as an adsorptive media (Jefeel. 1977,
Sontheimer, 1978). Microorganisms metabolizing the NOM and
the SOCs would increase the service life of the GAC bedsince the sorptive capacity will exhaust after longer
operation time (Werner et al. 1979).
Natural organic matter (NOM) is a macromolecular
decomposition product of plant material. By definition, the
end products of decomposition are not easily biodegraded.
Ozonation at low dosages (e.g. 1 mg 0_ per mg of TOC) was
found to increase the biodegradabi1ity of NOM (Gilbert,
1988).
While the importance of a stable biofilm in the GAC bed
for reliable biodegradation is recognized, little is known
about the interactions between adsorption and biodegradation
at the carbon surface and to what extent biological activity
will improve the treatment process. Of special interest is
the kinetics of NOM biodegradation in this environment
1.2 Objectives
The overall objective of this research was to develop a
better understanding of the biodegradation and adsorption of
NOM occurring in GAC filter adsorbers. This entailed:
1. Observe biofilm establishment in GAC filters receiving
ozonated natural organic matter (NOM).
2. Develop a technique to access "NOM biokinetic parameters
in-situ in fixed film systems
3. Study the biokinetics of NOM biodegradation in GAC filter
2.1. Applications of Granular Activated Carbon (GAC)
Activated carbon has long been recognized as an
effective adsorbent in water treatment applications. The
wide range of organics adsorbing on GAC favors the use of
activated carbon above other adsorbents. In water treatment,
activated carbon is generally applied in one of two forms.
For spills or temporary pollutions, such as seasonallyoccurring taste and odor causing compounds, activated carbon
is added in powdered form (PAC) prior to sedimentation. The
high surface area offered guarantees quick removal of the
undesirable compounds. Sludge production, however, isincreased by the addition of PAC. For permanent applications
of activated carbon the adsorbent is used in granular form
(GAC).
GAC is used as a replacement of sand in
filter--adsorbers. which remove colloids by filtration and organic
contaminants by adsorption processes. If the water is highly
contaminated, a longer contact time is required for thecomplete removal of organics by adsorption. In this case a
separate GAC pobt-filter adsorber unit is recommended since
\
short (on the order of 2 minutes as compare to 10 to 15
minutes for GAC applications).
GAC has been used in water treatment in the U.S. since
the late 1920's. By 1984. 50 to 60 utilities were using GAC
adsorption treatment in the U.S. (Symons. ISS**). The
increased concern over synthetic organic contaminants (SOC)
in drinking water has led to newer, stricter, maximum
contaminant levels (MCL) as proposed by the 1986 amendments
to the Safe Drinking Water Act, in which GAC is specified asthe best available technology for the removal of SOCs in
water. In the near future, therefore, the application of GAC
in water treatment is expected to increase significantly.
Biological activated carbon (BAC) applications have
been suggested (Hubele et al . 198'». Rlttmann et al . ISSit).
The biofilm, established on the external surface of the GAC
particle, metabolizes components already adsorbed on the GAC
(this process is also known as bioregeneration) as well as
those which are penetrating through the film toward the GAC
surface. As a result, sorption capacity of the GAC is pre¬
served and the service life time of the GAC bed can be
extended.
Attempts have been made to identify and quantify micro¬
organisms in the BAC - adsorbers. 'Be.ne.d.eM. (1980) estimated a
bacterial density of 10 cells per gram carbon by comparingthe available pore space on the GAC with the typical size of
9
7
10 ) were reported for BAC used in drinking water
applications (Van der Kootj. 1976). The lower con-centration
of biodegradable material in drinking water as compared towastewater might explain the lower amount of growth
observed. Werner (1982) conducted extensive identi-fication
assays before and after BAC filters with different
pretreatments. He observed that microbial species in the
effluent were different from those entering the adsorber.
The species found in the effluent depended to a great extent
on the composition of the water. He identified Pseudomonas
sp.. Flavobacteria and gram - positive bacteria in the
water.
In an environment with low organic substrate con¬
centrations, such as some relatively pristine drinking
waters, oligotrophic bacteria have been observed in fixed
film systems. These organisms are able to survive at
extremely low substrate concentrations. Oligotrophic bac¬
teria are characterized by the utilization of multiple and
varied compounds: the constitutive production of transport
enzymes with a high affinity for catabolic substrates:inducible synthesis of catabolic pathways, relatively low
maximum specific growth rates; and the possibility ofaccumulating reserve materials when carbon is available in
excess (Polntdexter, 1981). Astlccacaulis. Caulobacter.
et al, 198'*. 1985). McCarty et al (1981) estimated that
heterotrophs will predominate over oligo-trophs in biofilmswhen biodegradable organics exceed about 3 mg/1 COD.
Heterotrophs generally live at higher substrate
concentrations than oligotrophs.
2.2. Characterization of Blofiln Behavior - The BAC Process
2.2.1. Biofilm Establishment
Biofilms often determine the rate at which bio¬
degradable material is removed from the water in systems
with low substrate concentrations. Wuhrmann (1972) estimated
that 90 to 99 % of the bacterial activity in shallow streams
is associated with biofilms. Biofilm processes are
particularly effective at low substrate concentrations
because biofilm attachment and growth allows a high degree
of biomass accumulation (Rtttmann et al ,1986).
The rough and irregular surface of GAG particles, with
their complex network of macropores, has been shown to
provide an ideal environment for microbial attachment
(DlGiano. 1981). Increased rates of attachment may be
encouraged by the rough surface, which provides more surface
area as well as some degree of protection from fluid shear,
which may promote detachment (Characfells, 198**).
following advantages for microbial biofilm growth:
1. the biomass attached can be utilized during
starvation periods,
2. the biomass remains fixed within a flowing
environment and receives a constant supply of fresh
nutrients without motility requirements,
3. predation is reduced by the protection of the
surrounding media, and
4. extracellular enzymes may be shared between bacteria.
For establishing the biofilm, Characfells (198'*) distingishes f ive steps:
1. transport of substrate to the surface.
2. adsorption of the molecules to the surface,
resulting in a conditioned surface",
3. attachment of microbes to the conditioned surface,
4. metabolism by attached cells and associated
material, and
5. detachment of portions of the biofilm.
2.2.2 Blodegradation in the Biofilm
---- = - --- • --- 1 . 1
dt Y K + S
s
wi th
X = cell concentration (M/L^)
Y = yield coefficient (M cells produced/ M
substrate consumed)
u = max. specific growth rate (1/T)
^max r e> V 7
K = Half saturation constant (M/L )
s ^ '
S = growth limiting substrate concentration (M/L^).
For heterotrophic bacteria in low concentrations, K is
s
generally very large compared to S (Werner, 1982, Gantzer e t
al. 1988a and 1988b. McCarty et al. 1981). In this case theMonod equation simplifies to a first order rate model with respect to substrate concentration, S:
dS X u
---. _!jna^ . s. 1.2
dt Y K
s
Oligotrophic bacteria are characterized to prevail at low
substrate concentrations (TOC < 2 mg/1) and having a very
low half saturation coefficient (Rlttmann et al. 1986,Pointdexter, 1981, Van der Kooij et al. 1982). In the case
of K << S, the rate equation simplifies to a zero order
s
model with respect to the S:
dS fi
dt
Rittmann and McCarty (1980) introduced the concept of a
minimum substrate concentration, S . , for maintaining a
min
steady-state biomass in a biofilm:
S , = K •---j:— 1.4min s Lt - b '^max
with
b = first-order decay coefficient due to maintenance (1/T).
If S becomes smaller than S . , the biofilm begins to
min
decrease, i.e.. it decays faster than it grows. Oligotrophs
are adapted to low susbstrate concentrations because of low
K and b values (Rittmarxn e t al . 1986).
Biofilm processes are highly influenced by diffusive
processes as well as metabolic capabilities. There is
diffusion of substrate and nutrients, both externeal and
internal, to the biofilm as shown in Figure 2.1 at different
stages of BAG operation (Speltel, 1985). The diffusion
through the diffusion layer can be described by Pick's first
1 aw:
J = - D, -^ = k, • (S, - S ). 1.5
hdx l*^b s'wi th
J = steady state flux through the boundary layer
(M/T/L^)
bulk
liquid-liquid
phase
concentration
film
*---^ carbon
Solid
phase
loading
(a) Initial Period of Adsorption
bulk ,
Liquid
film Biofi m
liquid
\
D
liquid
phase
concentration
\
'Carbon
Solid
phase
loading
(b) Biofilm Development
bulk
liquid^
Liquid
film Biofilm
H---H »ͨ Carbon
liquid
phase
concentra¬ tion
p (c) Bioregeneration
Figure 2-1 Hypothetical Concentration Profiles for a Single GAC
ds/dx = concentration gradient in the boundary layer
(M/L")
k. = mass transfer coefficient (L/T)
S, = substrate concentration in the bulk (M/L^)
S = substrate concentration at the interfaces
biofilm boundary layer (M/L^).
The thickness of the hydrodynamic boundary layer is a
function of physical properties of the fluid (e.g. vis¬
cosity, molecular dlffusivity) and system properties as well
(velocity). Several empirical equations to estimate the mass
transfer coefficient are available in the literature
(Perry, 198'*. Bird, Stewart and Lightfoot . 1960. Jennlgs,
1975). For example Gnlellnskl (1975. 1978) proposed the
following equation to estimate the mass transfer coefficient
through the diffusion layer around spherical particles.
For Re < 2 Sh, = 0.664 Sc^''"^ Re^^^ 1.7
lamFor Re > 50
g, 0.037 Re^-^ Sc____________
turb ~ 1 ^ o 4^-3 D -0-1 Ao 2/3 ,, ^'^
1 + 2.443 Re (Sc - 1)
with
h - ͣ
^1%
Qo I)°1
°1
Re =
d u
P
u = -
^f
V^f
Sh = 2
e
./ Sh? + Sh? ,
lam turb1.9
The relationships described above were derived on single
particles. Schluender (1975) suggested adjusting the
estimated Sh for packed beds in the following way:
k, d
Sc. = —i-^
= 1 + 1.5 (1 - e.) Sh 1.10wi th
Sh Sc Re
u
u
Sherwood number (-) Schmidt number (-) Reynolds number {-)
bed porosity (-)
particle diameter (L)
kinematic viscosity (L^/T)
liquid diffusifity (L/T^)
bed velocity (Q/A)
interstitial velocity (L/T)
A mass balance for the substrate concentration (S.)
over a differential element of biofilm must account for
diffusion and biodegradatIon, the latter described with the Monod model. This results in the substrate uptake rate
(Rlttmann and McCarty 1981. Chang & Rlttmann. 1987. Speltel
et al. 1987):
dS, dt
= D,
d^S,
dr:
max
K +
S-s f
2.2.3 Interaction of Blodegradatlon and Adsorption:
Mathematical Model
The presence of an adsorptlve media may affect the
establishment of blofilm and the substrate removal rate.
Maloney and co-workers {I98k) found one hundred times more
bacteria on GAC after extended operation than on sand par¬
ticles operated for the same amount of time. However, the
authors suggested that the TOC removal rate after long
periods of operation was not due to blodegradatlon but
rather to adsorption phenonema. Den Blanhen (1982) also
observed that the biological activity on slow sand filters, operated with a loading rate of 0.4 m/hour. was similar to
that achieved in a biological activated carbon filter (BAG).
Van der Kooij (1976) considered improved organics removal tobe due to higher blomass concentrations on GAC as opposed to
adsorption. Weber et. al. (1978) reported a higher cumu¬
lative TOC removal on GAC. as compared to anthracite, but did not analyze the adsorption behavior of the wastewater
treated. LI and DlGiano (1983) used non-adsorbing material
(sand and anthracite) to show that bioregeneration occurred
on GAC.
Several mathematical models have been developed to
describe simultaneous adsorption and blodegradatlon in fixed
film systems. A summary of the main features of the models
Characiarlatics of Avallabia Hathaaatlcal Medala
-for Adsorption and Blodagradatlan (updatad tram DtGianot 1901>
Charactariatica Banadak 1980 Ying 1980 Chang 1987 Spaital 1987 Hubala 1989 Bio«lla Thichnaaa Bloflla Klnatlca Fixad Zaro-Ordar Varlabla tlonod Variabli Monod Variable Monod Varlabla Honod HBBB Trantfr EKtarnal Tila Diffuaion through Blofila Intarnal Piffuaian Yaa Yaa Yaa, Paaudo No Staady-Stata
Ulnaar Surfaca Driving F^rca 1) Diffuaion 2)
Vm
Surfaca
Diffualon 2>
Surfaca
Diffualon 2>
Yaa
Yaa
Surfaca
Oiffuaion 2)
Adaorntion Enulltbrlua
Fraundlich 3> Fraundlich Fraundlich Fraundlich Fraundlich
Raaetor Daaerlntion Plug Flow, Plug Floa, C8TR
Stationary Bad Diaparalva
FlOM
Plug FtoM, CSTR Plug Floa
VBrtfUi<i>9n 9f nfltfBt
Pilot Plant Laboratory Scala Laboratory Bcala Laboratory Scala Pilot Plant
TOC Slucosa, Sucroaa Phanol, PNP Phanol, PNP TOC
11 Blaufchauf'a llnaar diffualonal driving forea aedall blorganaratlon alloMad by conaldarlng ravaraal of
aorption fluK to aupply biofila
2> Coaplata profila of aolid phaaa coneantration davalopad by finita diffaranca tachniqua
3} Earllar aodal by Banadak conaidarad production of adaorbabla, non-biodagradabla organico by aicrobial
were developed before 1983 and have been verified on systems
with high substrate concentrations. The earlier models
simulated situations which might be applicable in water
treatment. Spettel and co-workers (1987) specifically ad¬
dressed the principle of GAC bioregeneration in their model.
The model developed by Hubele (1985) is currently the most
comprehensive approach to describe the BAC process. The
model is able to simulate a multicomponent adsorption, which
is described by the Ideal Adsorption Theory (lAST). as well
as biodegradation of the mixture in a GAC column. Shear and
transport of the biofilm in the deeper portions of the bed
is also incorporated in their model description. Due to lack
of experimental data for the biodegradation of different
components, the model was calibrated using an overall meta¬
bolic behavior.
The major factors to be considered in formulating a
model for simultaneous adsorption and biodegradation are
(Speitel, 1985):
1. microbial kinetics.
2. biofilm growth and decay.
3. substrate transport through the biofilm.
4. substrate transport within the GAC,
5. adsorption equilibria, and
6. substrate transport from the bulk liquid to the
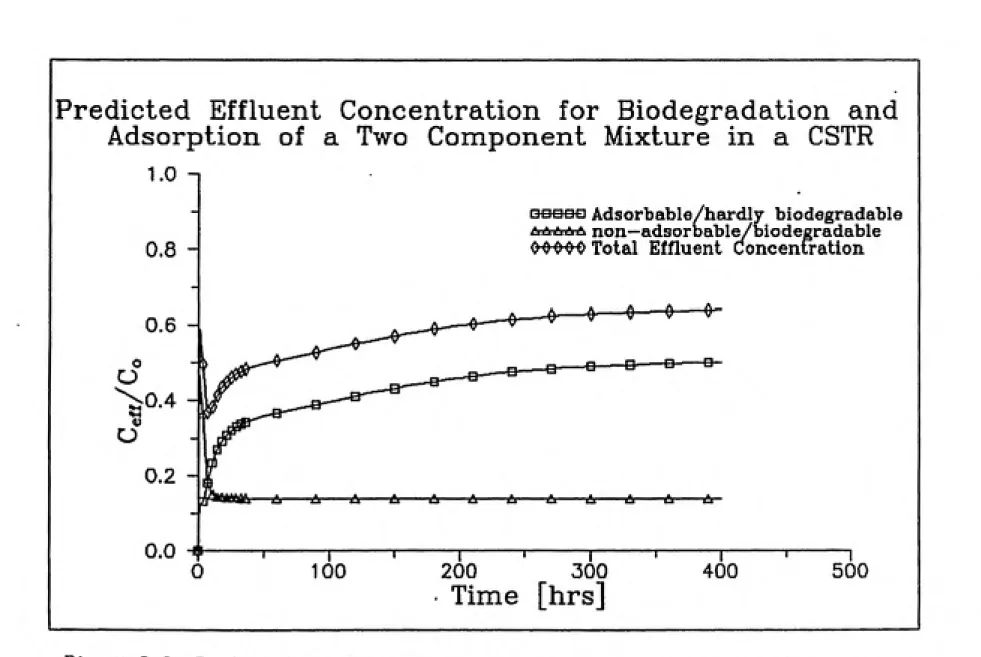
Of special interest in this research is the model
presented by Chang and Rittmann (1987). The model describes
biodegradation and adsorption of organic material at low
concentrations in a completely-mixed, fixed-film reactor.
Experiments conducted with glass beads and GAC separated the
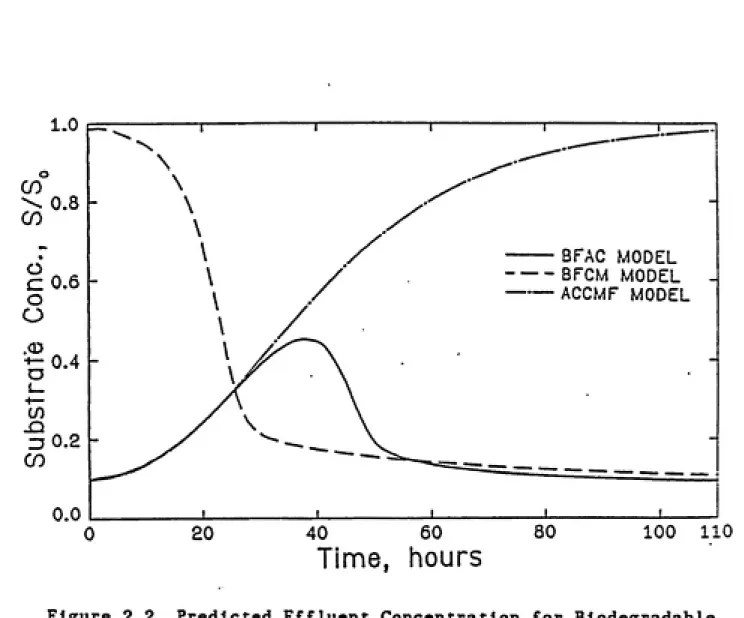
effects of adsorption and biodegradation. Predicted effluent
concentrations of a CSTR for different packed media are
shown in Figure 2.2. The effluent concentrations of bio¬
degradable substance in a CSTR packed with a non-sorptive
media (e.g., glass beads), decreases until the the biofilm
on the media reaches steady-state (as described by the BFCM
model). That of non-biodegradable in an adsorptive media
would follow a typical breakthrough curve (descibed by the
ACCMF model). The model predicts for a biodegradable sub¬
stance passing through a CSTR filled with adsorptive media
that effluent concentration will Increase at start up and
then decrease (BFAC model). This is caused by adsorption in
the beginning of the experiment but biodegradation later as
biofilm growth is established.
Pedlt (1989a) upgraded the Chang and Rittmann (1987)
model by including adsorption and biodegradation of more
than one component simultaneously. A mixture of different
components with different adsorption and biodegradation
characteristics can be used for BAC simulation. Pedit used
0.0
20
C 0.5
ZJ 0.2
40 60
Time, hours
- BFAC MODEL
- BFCM MODEL -ACCMF MODEL
80 100 110
Figure 2.2. Predicted Effluent Concentration for Biodegradable
is applied by all the other models presented; the finite
elements method is considered more accurate.
2.2.4 Suspended Versus Attached Growth - Biokinetlc Models
A common approach to characterize biodegradation in a
biofilm is to conduct suspended growth experiments to
determine the kinetic parameters used in the Monod model to
describe metabolism of substrate by the microorganisms
(Chang & Rlttmann. 1987. Speltel & DlGlano. 1988. Namkung &
Rlttmann. 1986. Rlttmann & McCarty. 1980). Parametersobtained from these tests are then used to describe the
biodgradation in fixed film flow through systems.
Differences in the substrate utilization rate between
suspended versus attached microorganisms have been noted
(Herson et al, 1987). Attached organisms are found to have
higher uptake rates and are more resistant to system poisons
such as heavy metals or chlorine. DeWotcrs (1987) determined
the biokinetlc parameters of bacteria grown in a biofilm in
suspended initial rate experiments with phenol serving as a
substrate. She observed little difference in the kinetics
between microorganisms grown in suspension and grown in a
biofilm.
A study by Ba>%ke and co-ioorkers (198'f), however, sug¬
gested, that there is no statistically significant
difference between attached growth and chemostat data. The
well with biofilm growth rates. Similar results were re¬
ported by Breyers & Characfells, 1982, and Trulear, 1983. The
investigators found that blokinetic parameters obtained from
chemostat experiments were applicable to biofilm systems insome cases. However, the authors raise questions with
respect to exocellular polymer production and microbial
detachment.The physi'^logic differences between attached and sus¬
pended microorganisms give rise to differences in their
metabolic behavior. This, therefore, implies that attached
microorganisms be removed from a biofilm in a fixed filmreactor in order to test the biokinetics of these bacteria
in suspended growth tests. Methods have been proposed to
remove microorganisms grown in a fixed film for use in thesuspended kinetic tests {Bone & Balkwlll, 1986, Camper et al
.1985. Dobbins &Pfaender. 1988).
Removing attached bacteria to obtain blokinetic
parameters does not necessarily solve the dilemma because
removal procedures proposed will alter the environment for
the microbial comrounity in converting from attached to sus¬
pended culture. This treatment may in turn alter the physio¬
logy of the bacteria. Moreover, the removal procedure may
only remove bacteria loosely attached to the surface. Thus,
the question arises as to how representative the bacteria
are which were removed from the surface. Rlttmana and
fixed-film reactor. The flux into the biofilm is measured
for different influent concentrations. The Monod kinetic
parameters are then determined by simply overlaying the experimentally determined flux into the film as a function
of substrate concentration in the biofilm with a family of
curves generated with a computer model which was derived by
Atkinson and Daules {197k) and Rlttmann and McCarty (1981).
The method was tested on biofilm established on glass beadsfor oligotrophic growth conditions.
2.2.5. NOM in Drinking Water Applications
General characterization of WOM. Natural organic matter
(NOM) in drinking water is derived from living and decaying
vegitation. It consists of complex polyaromatic compoundswith high molecular weight {Bouwer & Croioe, 1988). Its
molecular weight ranges from 100 to 50,000 g/mol (Summers et
al. 1987. El-Rahatll & Weber. 1986).The molecular weight of NOM. which is determined with
high-pressure liquid chromotoraphy (HPLC)or with ultra¬
filtration, depends to a great extend on the experimental
method and on the calibration standards used. Becher and
co-v}orhers (1986) conducted high-performance, size-exclusion
chromatography (HPSEC) of chlorinated and unchlorinated NOM.
They observed a molecular weight range of 3,300 to 16,800
g/mol. using dextrans to calibrate and 14.000 to 65,000
tests showed that the molecular weight of NOM was in a range
of 1.000 to 30.000 g/mol and the majority of the NOM
fractions were less than 10,000 g/mol. The effects of
physical / chemical treatment on NOM fractions can be •
observed if results are compared using one experimental
method (HPLC or ultrafiltration or HPSEC). Relnhard {I98k)
determined the molecular weight distribution by
ultrafiltration of dissolved organic carbon in advanced
treated wastewaters. He observed in the effluent a slight
increase in concentration of higher molecular weight
fractions (MW > 10.000 g/mol) after the wastewater had been
treated extensively (conventional treatment + ozone + GAC +
chlorination + injection well). A shift towards smaller
molecular weight fractions of NOM after chlorination was
observed by Becher et al (1986).
Besides these qualitative measurements of NOM
fractions, little is known about their specific charac¬
teristics, such as functional groups, structure and reaction
mechanistics. As a result, the observed change in
NOM-composition after treatment cannot be explained funda¬
mentally at this point.
The concentration of NOM in drinking water throughout
the U.S. varies between 1-20 mg/1 TOC (Montgomery. 1985).
NOM represents the major source of carbon pollution in the
drinking water supplies. The presence of NOM in water
with synthetic organic carbon (SOC) for adsorption sites in
GAC accelerates the breakthrough of SOC and reduces the
lifetime of the GAC bed (Summers et al. 1989). The GAC
column capacity for trichlorethylene was found to be more
than 50 percent less than in batch adsorption experiments.
The breakthrough was unpredictable because of long term
reduction of the adsorptive capacity due to NOM adsorption
on the GAC.
Chiou and co-ioorfeers (1986) observed an increased
solubility of SOCs in drinking water in the presence of NOM.
The adsorptive capacities for removal of SOCs are exhausted
earlier if NOM is present in the water.
The reaction between NOM and chlorine during
disinfection is now well known to produce trihalomethanes
(THMs) (Symons, 1981) or other disinfection byproducts
(DBFs). Amy et al (1987) showed that the THM formation
potential increases with increased NOM concentration.
Jacangelo and co-ioorkers (1989) observed a high concent¬
ration of aldehydes and lower concentrations of chlorinated
compounds after ozonation of drinking water as compared to
conventional chlorination. Little information is available
on the health effects of ingestion of ozone byproducts
(Jacangelo et al. 1989)
Biodegradation of NOM. Researchers have found that NOM
in drinking water can serve as a primary substrate to
support a biofilm which is capable of removing taste and
#
as SOCs {Chang & Rlttmann, 1987, DeWaters. 1987. Speitel.
1985). SOCs can be removed biologically even if their
concentration is below S . (Namfeung & Rlttmann, 1987b),
provided that other substrates are available to support
biofilm growth
Measurements of NOM removal from water by biological
activity in GAC beds have been reported (Jefeel, 1979,
Wilderer et al, 1985). Because the organic components of
each water supply are different and change with time,
absolute comparisons are not possible. The removal of
organic material (measured as dissolved organic carbon) in
bioactive processes range from 6% to 50%, reported in a
review by Rlttmann & Snoeylnfe (198't).
The process of biodegradation of NOM is not well under¬
stood. Little information about biodegradation rates of NOM
is available, although such information is necessary to
predict BAG process performance. Most NOM biokinetics were
determined in suspended growth tests (Werner, 1982). Due to
different environmental conditions other organisms might
prevail in biofilms than in suspensions. Therefore, the use
of kinetic data received from suspended growth tests might
be questionable (Rlttmann et al. 1986)
Impact of preozonation on NOM. Ozone, a powerful
oxidant, will react with NOM during preozonation. This
reaction has an impact on the NOM*s adsorbability and
bio-degradabi1ity.
to reduce the DOC of the solution (Amy et al. 1988).
However, the molecular weight distribution after ozone
treatment showed an increase in smaller fractions (MW <500;
500-10000; 10000-20000;) and a decrease in higher fractions
(MW 20000-40000; MW >40000) . The average molecular weight
of NOM was reduced after ozone application.
A decrease in adsorbabi1ity of NOM on GAC has been
observed with increased ozone dose by several researchers
(Fettlg, 1985. Harrington and DtGlano, 1989. Hubele, 1985).
Kaastrup (1987). however, found that the adsorbabi1ity of
NOM on GAC increased for low ozone dosages (ozone dose < 0.5
g 0^/g DOC), and decreased for higher dosages.
No statistical evidence of a change in adsorption
characteristics of NOM on GAC at ozone dosages of
approximately 1 g 0~/g DOC was detected by Glaze and
co-workers (1986). However, a slight shift of the adsorption
isotherm to the right (i.e. less adsorbabi1ity) was shown.
The biodegradabi1ity of NOM can be enhanced by
pre-ozonation. Gilbert (1987) conducted a series of BOD- tests
on humic acids derived from surface water and from
ground-water for different ozone dosages. He observed no biological
degradation in the non ozonated sample. However, a BOD^/COD
o
ratio of 0.4 could be detected after an ozone consumption of
6 mmol/1. which means that the biodegradabi1ity could be
Increased to 40 % of the COD with the applied dosage.
from 5% to 55% by applying an ozone dose of 1.82g O^/g DOC
(Hubele & Sonthetmer. 198k).
An increase in NOM removal up to 50 % has been observed
in a completely-mixed, fixed-film reactor, operating at an
EBCT of approximetely five minutes, after ozonation at a
dose of 1 mg O^/mg TOC (DcWaters. 1989).
2.3. Summary
Microbial activity in GAC filter adsorbers is well
documented in the literature. Attempts have been made to
model the process of simultaneous adsorption and
biodegradation of single- and multi-organic components on
activated carbon and other adsorbents.Suspended growth tests to characterize the microbial
community in the biofilm are commonly conducted. The use of
actual biofilm microorganisms for these tests is
advantageous for process characterization. An in-situ
technique, however, seems most preferable for the deter¬
mination of substrate uptake rates in a biofilm system.
Investigations to characterize NOM have recently been
conducted. The impact of physical and chemical treatments on
NOM fractions was observed. The biodegradabi1ity of NOM can
be enhanced by applying low dosages of ozone. The chemical
GAC FIXED-FILM CSTRS
3.1. Experiaental Methods
3.1.1. Natural Oreanic Matter (NOM)
Source of NOM. NOM was obtained from Lake Drummond. a
lake located in the Great Dismal Swamp in Suffolk. Virginia.
The lake water has a total organic carbon (TOC) content of
approximately 60 mg/1; depending on weather conditions
before sample collection, the TOC could be as high as 100
mg/1. The lake water was estimated to have a total Kjeldahl
Nitrogen (TKN) of 2.0 mg/1 and a total phosphorous content
of less than 0.5 mg/1 {Dunham, 1989). Lake water was
collected in 20 1 containers, filtered through a Ifxm
honeycomb filter (Brunswick Technics Filterite. Timonium.
Maryland) and stored at 4 °C until use.
Preparation of the ozonated NOM solution.
decomposition and mlcroflocculation processes In the
ozonated NOM mixture (Doioblggln & Singer. 1989). An ozone
dosage of 1 mg 0~/mg TOC was applied with a Grace LG-2-LI laboratory ozone generator (Union Carbide, South Plainfield, New Jersey). A schematic of the ozonation apparatus is given
in Figure 3.1 and a summary of the operating data in
Table 3.1. Ozone gas was delivered through stainless steel or teflon tubing to a glass reactor containing 20 1 of lake water. Generation rates were calculated by passing the ozone gas through a secondary circuit KI traps for 2 min before and after sample ozonation. An overall generation rate was estimated by averaging both measurements. The ozone dosage was calculated by applying a mass balance over the system.
After ozonation, which was generally 40 to 50 minutes.
Ng gas was passed through the reactor at a flowrate of 1
1/min for 15 minutes to purge all unreacted ozone from the
sample. The unreacted ozone remaining in the reactor was
collected in a KI trap. No attempt was made to account for
any decomposition of ozone; this effect should be small
compared to the ozone reacted at short contact times and at
neutral pH {Standard Methods. 1985). The ozone concentration
in each KI trap was determined using iodometric titration(Standard Methods. 1985). Free iodine, liberated from the KI
solution by 0^ was titrated at pH 2 with a standard 0.1 N
Main Switch
Valve
Ozone Generator
Secondary
'Circuit
N2
K
Kl Traps
ͨ
^ cr
Primary
CircuitH
Kl Traps
o
o
f|Ozone Reactor!
To Vent
Ozonation Operating Parameters
Op Pressure in Generator (psi)
Voltage Supplied to Generator (V)
Oxygen Gas Flowrate (1/min)
Ozone Generation Rate (mg/min)
Ozonation Time (min)
Ozone Dose (mg 0_/mg TOC)
Nitrogen Purge Time (min)
Nitrogen Gas Flowrate (1/min)
15 120
1
52 to 63 21 to 40
l:l
30
thiosulfate solution was calibrated with potassium biiodate.
(2) Nutrients and buffer solutions. Ozonated Lake
Drummond water was diluted with sterile distilled, deionized
water to a TOC of 7 mg/1 to serve as a standard feed.
Additional nutrients were added in order to ensure that
carbon was the growth limited substrate (see Table 3.2). The
nutrient dosage was estimated to provide an excess of
nutrients required for microbial growth, based on the
stoichiometric formula for bacterial "life" (C^„HoyO^~N.-P)
(McCarty, 1970). A safety factor of two was applied to
estimate the actual nutrient salt concentrations.
The pH of the feed water was held constant at value of
6.3, which was reasonable to simulate water treatment
applications, by using a carbonate buffer (5 % COp and
NaHCO~). Constant purging with a gas mixture of 5 % COp in
air kept the feed solution saturated at the required C0„
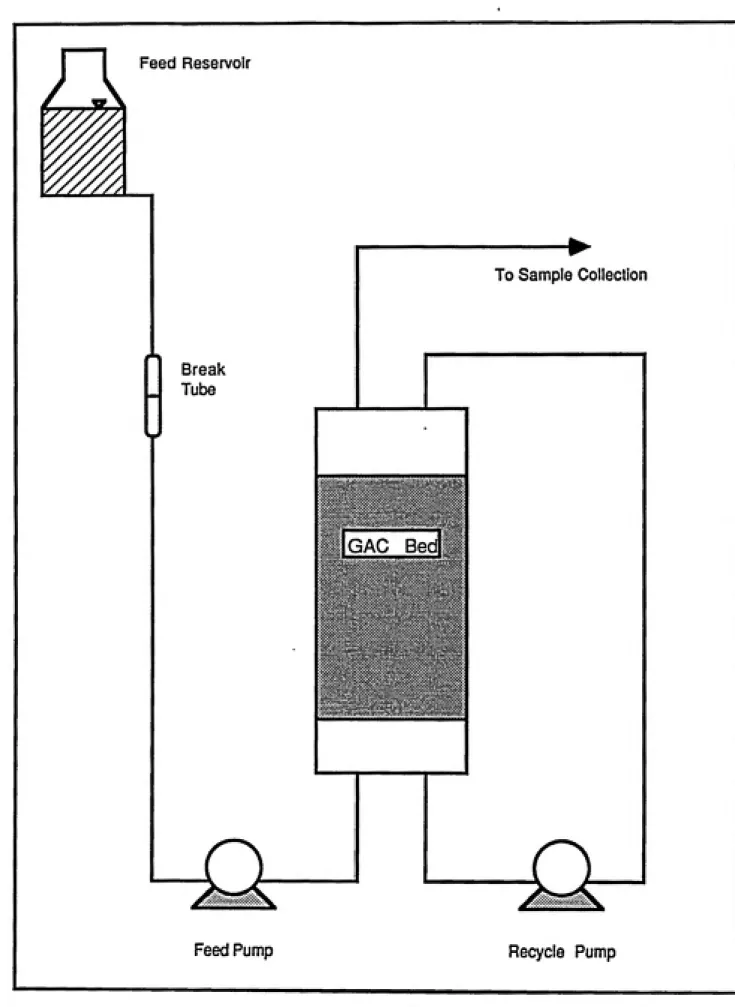
concentration.3.1.2. Experimental Set-up
Reactor design. A completly mixed fixed film reactor
(CSTR) was achieved by applying a high recycle flowrate as
compared to a slow feed flow rate to the short packed bed
#
Nutrients And Buffer For NOM Solution
Nutrients:
CaCl2-2H20
MgSO^
NH^Cl
KH2PO4
Buffer:
CO- in solution (CO^ gas 5 %)
NaHCO^
(mg/1)
15
5 3.5
14.5
(mg/l)
70.4
n
Break
J Tube
To Sample Collection
Feed Pump
Recycle Pump
concentration gradient in the bed was essentially zero; the
reactor represented a differential element of a flow through
column. This means that the axial concentration gradient is
eliminated which is important in assuring the same
biokinetics occurring throughout the GAC element. The
fixed-bed CSTRs were constructed of glass. Two different
sizes were used. The first CSTR design had a diameter of
3
1.85 cm and a length of 2 cm (empty bed volume of 5.4 cm ).
which held approximately 4 g of GAC. The second series of
experiments were conducted with an improved column design,
having a diameter of 1.5 cm and a bed length of 3.8 cm
3
(empty bed volume of 4.98 cm ), which held 3 g of GAC. The
void volume of the recycle line and the volume of the
headcaps was reduced in this improved design from
3 3
approximately 20 cm (of the first design) to 9 cm .The
columns were equipped with removable endcaps, which were
held in place by viton o-rings and metal clamps. The GAC was
retained in the bed with a stainless steel screen (50 mesh).
The feed pump (ISMATEC peristaltic pump, Cole Palmer
Instrument Comp., Chicago, Illinois) accurately delivered
feed at low flowrates. A constant feed flow rate of 2 1/day
was used throughout the CSTR experiments. The recycle pump
(Masterflex peristaltic pump. Cole Palmer Instrument Comp.,
differential element and in controlling the loading rate.
The loading rate was set at 17 m/hr, which is considered to
be a practical rate for GAC filter-adsorbers in water
treatment (Montgomery. 1985). The loading rate was monitored
with a rotameter (Dwyer Instruments, Michigan City,
Indiana); the feed flowrate was measured periodically with a
stopwatch and a graduated cylinder. Silicon tubing was used
for the feed pump; the recycle pump used nalgene tubing (ID
0.25 in), which is autoclavable and impermeable to gases.
All other tubing used in the system was Teflon (ID. 1 mm).
The empty bed contact time (EBCT), which was calculated by
dividing the empty bed volume through the feed flowrate, was
3.87 min for the first CSTR design and 4.39 min for the
Improved design.
Feed was stored in two different kinds of glass
containers. For long term experiments, a large container
(8 1) was used. Glass aspirator bottles (2 1) served as feed
containers for short term experiments. Both types of
reservoirs were capped with rubber stoppers. C0„ gas (5 %)
was bubbled continously through the feed as part of the
chosen buffer system; glass tubing with glass wool was used
as a gas vent to prevent atmospheric contamination of the
feed. Biodegradation in the reservoir was minimized by
chosing a small container, which required frequent cleaning.
type of run either dally or every four days in freshly
autoclaved reservoirs. The entire set-up was sterilized by
autoclaving for 30 minutes at 20 psi prior to initiation of
each experiment.
The experiments used several CSTR's operated either in
series or in parallel. When a series configuration was used,
T-shaped glass stopcocks (ID 1.5 mm) were installed to serve
as sampling ports between the reactors.
GAC sample. F-400 GAC (Calgon Corp.. Pittsburgh.
Pennsylvania) served as an adsorbent for all CSTR
experiments. The GAC was ground, either with a mortar and
pestle or with a grain mill, and sieved for 20 minutes per
batch to retrieve the U.S. Tyle Sieve 30 x 40 mesh fraction
(average diameter 0.5 mm). The carbon sample was rinsed with
distilled deionized water until no carbon fines were visible
in the water, dried at 105 °C. and stored in a dessicator at
room temperature until use. Prior to use, the sample was
rinsed again and autoclaved for 30 minutes at 20 psi.
Sample dry weights were obtained by drying at 105 °C
the GAC for several days and weighing with a Metier
3.1.3. Analytical Methods
NOM concentration. Total organic carbon (TOC) and
sometimes dissolved organic carbon (DOC) were used as
surrogate parameters to measure NOM concentration in the
water. DOC samples were vacuum filtered through a 0.2 fim
Nuclepore polycarbonate membrane filter (Nuclepore Corp.,
Pleasanton, California) which had been prerinsed with
distilled deionized water.
TOC and DOC were measured with an O.I. Model 700 Total
Organic Carbon Analyzer (O.I. Corporation, College Station,
Texas); sodium persulfate is used to oxidize the TOC to COp,
which is then analyzed with an infrared detector.
NOM composition. NOM composition was analyzed using
high-performance size-exclusion chromatography (HPSEC). The
chromatography was carried out at ambient temperature using
a waters HPLC system that consisted of a Model 6000 A pump,
a Waters Universal Model U6K injector, and a Model 440
absorbance detector operating at 254 nm. The column
(7.5 mm x 600 mm) was packed with TSK-G-3000 SW (Supelco
Inc., Belufonte, Pennsylvania). Separation of the high
molecular weight organic material was performed in a
phosphate buffer solution, pH 6.5 (0.02 M KHgPO +
0.004 M KgHPO^). at a flowrate of 1.0 ml/min. The injection
0.45 jxm cellulose membrane filter (MSI. Westboro. MA.) prior
to Injection. A similar set-up has been used in the past by
other reseachers (Becher e t al. 1985, Sonnenherg, 1989) to
determine the composition of NOM.
Biofilm observation. BAG samples were removed from each
of the CSTRs operating at steady state and examined under a
scattered electron microscope (SEM). The sample has to be
dry and of high conductivty for SEM microcopy so that the
electrons hitting the surface can leave the surface fastwithout building up a capacity. A series of steps had to be
conducted to preserve the shape of the biofilm even after
dehydration and drying. The samples were preserved at the
Department of Pathology at the University of North Carolinaat Chapel Hill using the following procedure:
1. replacement of the water with a 0.1 M phosphate
buffer,
2. replacment of the buffer with 2 % glutaraldeyde.
4 % paraformaldehyde fixative in a 0.1 M phosphate
buffer for at least one hour.
3. replacement of the fixative with 0.1 M phosphate
buffer,
4. staining of the sample duplicates in 0.05 %
ruthenium tetroxide.
series: 35 %. 50 %. 70 %. 95 %. 100 % (two baths in
each ethanol concentration).
6. replacement of the ethanol with freon 113,
7. critical point drying using CO- as the transition
fluid,
8. mounting of the particles on aluminum stobs,
9. sputter coating the mounted stubs with Au (60 %)
and Pd (40 %).
The prepared biofilm specimen were observed using a
Cambridge S-200 SEM.
A similar procedure was recommended by Chang (1985) for
identication of organisms growing on GAC.
3.2.Results and Discussion
3.2.1 Breakthrough Curves
Three CSTRs in series were used to simulate a flow
through GAC column behavior. The breakthrough of NOM from
CSTRs operating in series was observed in three different
experiments. The feed NOM concentration and the flowrate
were the same in all three cases. A summary of the
experimental conditions is presented in Table 3.3. Run No. 1
Summary of Experimental Conditions for Run No 1 to 5
Run No:
Start Run 9/8/88 11/22/88 2/7/89 6/2/89 5/8/89 End Run 11/10/88 12/23/88 4/20/89 8/20/89 5/31/89
NOM
Col lection 4/1/88 4/1/88 4/1/88 6/1/89 3/1/87 Ozonation 4/15/88 9/15/88 9/15/88 7/18/89 3/23/89 CSTR
Bed Diam. Bed Vol. CSTR Vol. Mass of CAC CSTRs
in Series Flowrate Feed
Recycle
1.85 5.95
75.1
4.0
44.21 3.7
— 1.5 cm — 4.93 cm^-13.96
cm-3.0 g —
-2
No. 2. The total reactor volume in Run No. 2 was reduced 3 3
from 75.1 cm to 44.21 cm by reducing the diameter of the
recycle tubing. Runs Nos. 1 and 2 both used approximately 4
grams of GAC (dry weight) per reactor.The modified
(improved) reactor design was used in Run No. 3. Three of 3
the smaller CSTRs (total reactor volume = 13.96 cm ) were placed in series for this run. Each reactor held
approximately 3 grams of GAC (dry weight).
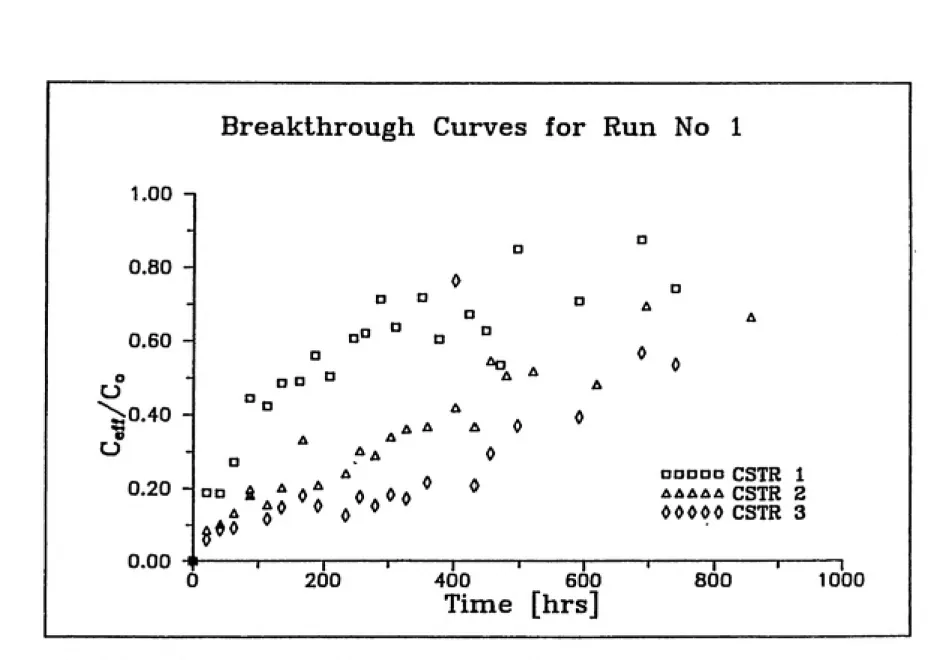
The effluent TOC concentrations from each reactor in
Run No. 1. normalized to the initial feed concentration at
any time, are presented in Figure 3.3. Because three CSTRs
in series were used in this experiment, the effluent TOC
concentration of the previous reactor served as feed for the
next (i.e., effluent of CSTR No. 1 serves as feed for CSTR
No. 2 and effluent of CSTR No. 2 serves as feed for CSTR No.
3).
In comparison, predicted effluent concentrations are
presented in Figure 3.4 for a hypothetical NOM solution that
is described by a single non-biodegradable but adsorbable component from the same experimental set-up (the assumed
input parameters to the model are presented in the table
below Figure 3.4) (Pedit. 1989b). The model incorporates the resistance of a hyrodynamic boundary layer around the GAC particle and a surface diffusion resistance of the compound on the activated carbon, which is assumed to be homgenous. A
#
Breakthrough Curves for Run No 1
1 00 n
-a
D
0.80
-0
O
- DO a
A
a A
0.60 -
D° ° D °
^ A
*
o
CJ D
DO ° ^ "" A
^0.40
-D A
A A A 0
V A A
O ^A 0
°° Aaa Oa ""oaOO ^ ^
DDDDa CSTR 1
0.20 - AAAAA CSTR 2
A JO 0 0^
00000 CSTR 3n nn u
e^o ^
U.UU ^ͣ 1 1 1 1 1 1 ͣ 1 1 1 1
c 200 400 600
Time [hrs]
800 1000
0.2
-400 600
Time [hrs]
Input Data for Bomogenous Surface Diffusion Modal
Syatam Paramatars: EBCT OAC bad Bad Volume Flowrata
Particle Diameter
Apparent Particle Density
Mass 6AC
ROM Properties:
Freundlich K Freundlich n
Film Transfer Coefficient Surface Diffusion Coefficient Molecular Weight
Influent Concentration
M Sarringien, 6., 1987
4.33 Bin 5.38 ml 2.00 l/day 0.50 am
0.70 «/cm* 4.00 s
6.28 (cmV«)° )
0.40 M
7.10 cm/hr M
7.10 'ͣ^ cm' /sec M
5000 g/mol 7.00 m«/l ͣ
similar model was used in the past by other researchers
(Crlttenden, J.C. et al. 1978) to predict adsorption of
organic compounds on GAC.
The experimental breakthrough curves differ from the model
predictions. While the breakthrough curve for CSTR No. 1 is
similar to that predicted in Figure 3.4, those for CSTR No.
2 and No. 3 show that the effluent concentrations in the BAC
process increase more slowly. In fact, the effluent
concentrations from each experimental CSTR never reach the
influent concentration, as would be expected if only
adsorption were occurring. Rather, a steady-state TOC
removal is attained due to NOM biodegradation in the GAC bed.
The overall TOC removal in 12.9 minutes of EBCT is
shown by the breakthrough curve of CSTR No. 3 in Figure 3.3: 45 % of the feed NOM is removed by biodegradation at steady state. At the beginning of operation and throughout the
first 400 hours, the effluent TOC concentration from CSTR
No. 3 was 1 mg/1 as TOC. Applying the concept that NOM is composed out of several hypothetical fractions with
different biodegradation and adsorption characteristics, this initial effluent TOC would represent the
non-adsorbable. slightly biodegradable fraction of NOM in the reactor feed.
that the biodegradation occurring in the recycle tubing is
negligible compare to the biodegradation in the carbon bed.
Biofilm growth outside the packed bed (e.g. tubing wall,
reactor wall and suspended growth in the void volume of the
CSTR) might effect overall NOM biodegradation. The
degradation contributed to the CSTR might be, therefore,
overestimated if biodegradation outside the packed bed
becomes significant. Two CSTRs in series were used in Run
No. 2. The Nalgene recycle tubing (ID = .25 in) was replaced by Teflon tubing (ID = 1 mm) to reduce the total volume of
3 3
the CSTR significantly (from 75.1 cm to 44.21 cm ). The
breakthrough of NOM from each CSTR, normalized to the
initial feed, are shown in Figure 3.5. The TOC breakthrough
curve from CSTR No. 2 in Run No.2 is significantly different
than from CSTR No 2 in Run No. 1. A steady-state removal of
25 % from CSTR No. 1 and 55 % from the total set-up was
achieved, in contrast to 40 % removal in Run No. 1 after
CSTR No. 2. The higher TOC removal in Run No. 2 cannot be
explained by reducing the void volume of the reactor (see calculations in Appendix 1). In fact, removal in Run No. 1
was expected to have been higher than that in Run No. 2,
because more empty reactr space was available in which
bacteria could attach to the walls on either end of the bed,
as well as be suspended in the recycle line.
1.00 n
0.80
0.60
-o
^0.40
U
0.20
-0.00
l-^
a a ° a
a aa a °
a aa ^ >*
X ^ X X X
X
X X
X X DoaoD CSTR 1
xxxxx CSTR 2
200 400
Time [hrs]
600 800
blodegradability of NOM. Although the NOM used in Run Nos 1
and 2 were from the same source of water, it was ozonated at
different times. The feed used in Run No. 1 was ozonated
five months before the start of the run whereas the feed solution used for Run No. 2 was ozonated two months in
advance. The TOC decreased from an initial concentration of
39.3 mg/1 to 30.8 mg/1 after two months storage, even though
the ozonated NOM was stored in a dark, cold room at 4 °C to
inhibit microbial activity. In addition, after extensive
storage a sediment was found in the bottom of the 20 1
containers in which the NOM mixture was stored. Ozonation
has been shown to enhance microflocculation and coagulation
processes. Biodegradation of the readily biodegradable
matter and microflocculation may have altered the
composition of the initially identical feed solutions. It is
apparent that the ozonated feed becomes biologically more stable, i.e.. less degradable. with extended storage time. since only readily degradable fractions will be degraded at 4 °C. The different results observed in Run Nos. 1 and 2 might therefore be explained by changes occurring in the NOM solution as a consequence of different lengths of storage.
The TOC effluent concentrations in Run No. 3,
normalized to the feed concentration of CSTR No. 1. are
shown in Figure 3.6. Breakthrough with this (improved)
1.00
0.80
0.60
-o
\0.40 A
V
u
0.20
0.00
D
^
QOB
° CD QD
A A
AA
„ A ^ ^A
%^^<
0<b
0 0
'4
_,---,---1---P
300
D
A ͤ
DODaa CSTR 1
AAAAA CSTR 2 00000 CSTR 3
T---1---r
900 600
Time [hrs]
T---1---1---1---1
1200 1500
400 hours of operation, the effluent concentration from CSTR
No 3 in Run 3 reached 31 % of the initial feed as compared
to 23 % observed in Run 1. The total NOM TOC removal at
steady state in Run No. 3 was 43 % as compared to 55 % in
Run No. 1. Steady-state in CSTR 1 was reached aftr 500 hours
of operation; in. CSTR 3, which represents the total bed behavior, after 900 hours (Figure 3.6).
The earlier breakthrough and the lower total removal observed in Run No. 3 can be explained by the different
reactor design. The CSTRs in Run No. 3 held 25 % less GAC (3 gr. versus 4 gr in the "old" design) and the total volume of 3 the reactor, including void volume, was reduced from 75 cm
3
to 14 cm Due to the loss of surface area available for biofilm establishment and the decrease in fluid volume for
suspended growth, the biodegradation rate is expected to be less than in the reactors used for the previous runs.
The ozonated NOM mixture used at the beginning of Run No. 3 had been stored for five months at 4 °C. After 500
hours of operation, the feed was switched to a freshly
ozonated batch.
An additional experiment (Run No. 4) was conducted with
fresh NOM ozonated immediately before the start of the run.
The objective of this run was to determine the extent of
overall NOM removal with three CSTRs in series; no data of
effluent concentrations for the initial phase of the
experiment (first six weeks) Is therefore available.
Effluent TOC measurements were taken periodically during the
last two weeks of the two-months run. A steady-state TOC
removal of 54 % from the entire set-up was achieved for the
freshly ozonated NOM mixture without being stored. This is
approximately 10 % higher than the removal achieved with the
NOM mixture which had been stored, after ozonation, for five
months before use. It suggests that a freshly ozonated NOM
mixture contains more bioegradable material.
NOM is a heterotrophic material and this could also
contribute to discrepancies in steady-state removals in each
run. Eventhough the source of NOM was the same in all
experiments, this does not ensure that the composition of
the NOM is identical. The observed variation in
biodegradabl1ity could very well be due to the fact that the feed solution was not the same in each run. However, changes in NOM feed composition with storage cannot be shown
quantitavely because TOC was the surrogate parameter used to measure NOM concentration and not HPLC analysis.
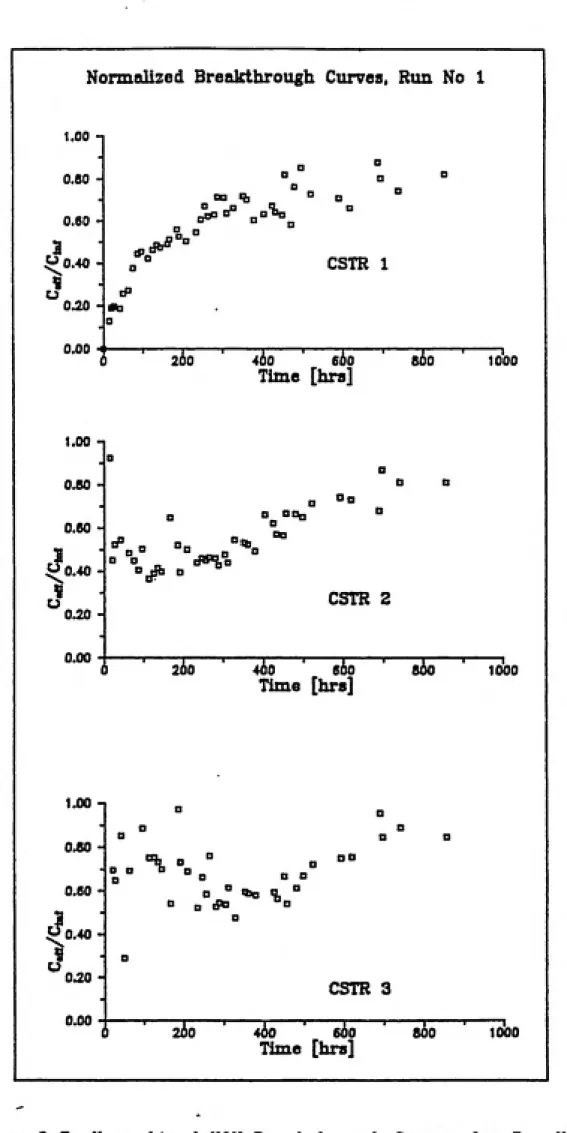
To demonstrate the performance of each single CSTR in
the series configuration the effluent concentration from
each CSTR was normalized with its specific influent feed concentration. The NOM breakthrough could be observed at
1.00 0.80 0.60 -3
^0.40
0.20 -0.00 a o00 % °
rToOo" „o1o
*'
/^o"
CSTR 1
15o ' 4S0 '
Time [hrs]
eSo ' aSo ' ^
10001.00 0.80 0.60 -iJ0.40 V 0.20 0.00 Oa
o a^
e
1^ o "%
CSTR 2
260
"400 ' tiSo ' sSo ' ioloo
Time [hrs]
1.00-]
n 0*
e 0 0 D D
0.80
-«»fc 0 " 0 "ͣ
0.60
-Jo.40.
0« D
U 0.20
-A -A-A .
CSTR 3
i
i ' 2A0 ' 460 ' 660 ' 800 '
loboTime [hrs]
shown In Figure 3.7. These breakthrough curves differ
substantially from each other. The hump which occurs at the
beginning of the breakthrough curves of CSTR Nr. 2 and Nr. 3
(Figure 3.7) can be explained by the presence of a slightly
adsorbable, biodegradable fraction in the NOM. Because this
fraction of NOM is not well-adsorbed, there is an immediate
rise in the effluent concentration at start-up of the
reactors. However, effluent concentration then decreased
due to the onset of biodegradation once the biofilm is
established on the GAC surface. Although the microbial
population probably reaches a steady state, the effluent
concentration again increases because some components are
not biodegradable but are adsorbable, and these will escape
the bed when the sorptive capacity is exhausted.
Steady state in the microbial community (as measured by the time before the final rise in effluent concentration)
was reached for each reactor at a different time, as shown
in Figure 3.7. No hump was observed in the effluent
concentration pattern of CSTR No. 1 because a constant and
high influent concentration made it possible to immediately establish a biofilm. For the following CSTRs, however, the influent concentration and composition varied with respect to time until steady state in the previous reactor was reached. The time to establish a steady-state microbial