Research Note
Multi-Attribute Decision Making on
Inter-Basin Water Transfer Projects
M. Zarghami
1, F. Szidarovszky
2;and R. Ardakanian
3Abstract. One of the best ways to control water shortages in the central region of Iran is Inter-Basin Water Transfer (IBWT). Ecient decision making on this subject is, however, a real challenge for the water authorities in Iran. These decisions should include multiple attributes, model uncertainty and, also, the optimistic/pessimistic view of the decision makers. The Ordered Weighted Averaging (OWA) operator can be used as an ecient Multi-Attribute Decision Making (MADM) method. This paper will introduce a new method to obtain the order weights of this operator. The new method is based on a combination of fuzzy quantiers and neat OWA operators. Fuzzy quantiers are usually applied in soft computing to model the optimism degree of the decision maker. In using neat operators, the ordering of the inputs is not needed, resulting in better computation eciency. The theoretical results will be illustrated in a case study by solving an MADM problem with four IBWT projects for the Zayanderud basin. The results demonstrate that more sensitive decisions can be obtained by using the new method.
Keywords: Multi-attribute decision making; Ordered averaging; Inter-basin water transfer; Iran.
INTRODUCTION
The increasing conict among stakeholders over limited water resources, including the relative absence of new and less expensive resources, is a usual characteristic of all water resource systems. These systems should be designed and managed by considering the present and future objectives of the society, including social, economic and environmental issues. Ecient decision making is, therefore, a complex problem.
This study develops a new extension of OWA, which is a special MADM method. Since the pioneering work of Yager [1], the OWA operator is used in many elds, including water resource management problems. Despic and Simonovic [2] compared the OWA with three other methods to select ood control measures in Manitoba, Canada. Yalcin and Akyurek [3] applied OWA for mapping ood vulnerability in a basin in
1. Department of Civil Engineering, University of Tabriz, Tabriz, P.O. Box 51666-14165, Iran.
2. Department of Systems and Industrial Engineering, Univer-sity of Arizona, P.O. Box 85721-0020, Tucson, AZ, USA. 3. Department of Civil Engineering, Sharif University of
Tech-nology, Tehran, P.O. Box 11155-9313, I.R. Iran. *. Corresponding author. E-mail: [email protected] Received 29 March 2007; received in revised form 11 May 2007; accepted 8 December 2007
Turkey. They used it as an aggregation operator to merge GIS (Geographical Information System) maps of various risk factors. There are two optional tools in the decision making module within IDRISI [4] as the GIS software: One is a simple additive weighting and the other is OWA. In applying OWA to multi-objective optimization, McPhee and Yeh [5] selected three criteria to choose scenarios in aquifer manage-ment. Fu et al. [6] developed climate change scenarios for the global mean temperature of the year 2050. They aggregated the possible scenarios, based on their probabilities, by using the OWA approach. The European commission developed MULINO [7] as a Decision Support System (DSS) for integrated water resource management, which contains three methods, including OWA. Makropoulos and Butler [8] used the OWA in urban water management. They extended it to Spatial OWA (SOWA) by applying it in GIS to produce prioritization maps for pipe replacement in a water distribution network.
This paper introduces a new version of OWA, which will be applied to solve a practical problem for selecting IBWT projects. The paper develops as follows. The next section introduces the multi-attribute case study with IBWT projects. Then, the details of the new method, called the Revised OWA, will be described. Next, the IBWT projects will be
compared by using the new method. The last section concludes the paper.
IBWT PROJECTS FOR CENTRAL IRAN Iran is an arid/semi-arid country. The mean annual rainfall of the country is about 250 mm, which is about 30% of the world average. The increasing water demand has caused an alarming decrease in annual per capita water resources. The uneven distribution of water across the country and the fast growth of the population have led to the present water shortages in major parts of the country, especially in the central and southeastern regions. Therefore, by the year 2025, Iran is expected to fall into the group of countries with critical water shortages.
The country is divided into six main hydrological basins, as shown in Figure 1 [9]. The main basins are: (1) Caspian Sea, (2) Lake Urumia, (3) Persian Gulf and Oman Sea, (4) Central, (5) Hamoun and (6) Sarakhs. The annual per capita water resource potentials in the main basins are shown in Figure 2 for the year 2000.
According to Figure 2, the main basin (Persian Gulf and Oman Sea) has the highest amount of water resources ( 4545 cubic meter/capita/year), while the neighboring main basin (Central) has only a quarter of that amount ( 1190 cubic meter/capita/year), which is facing a high degree of water shortage. The socio-economic life of the people in the central basin can be improved by water transfer from a neighboring basin, Large Karun, which is located in the southwest corner of the country. It is the most important basin in Iran, with respect to water potential and the possibility of further water resource development. The average long-term rainfall of Large Karun is about 760 mm. Part of its water potential is utilized inside the basin and trans-ferred to other basins. The remaining water amount, around 20 to 25 billion cubic meters per year, is spilled
Figure 1. IBWT project from basin 3 to basin 4 [9].
Figure 2. Water resources potentials in the main basins of Iran (cubic meter per capita in year 2000).
and lost through outow into the Persian Gulf. Part of the domestic and industrial wastewater returns to ground water aquifers or to surface drainages. The assessment of the overall water quality of the system (Large Karun) shows that the IBWT projects from upstream will worsen the water quality downstream. Due to the high potential of growth in the Karun basin, there are various concerns about water transfer to other basins, which generates conict among the stakeholders. Therefore, it is essential to evaluate any possible IBWT project for Large Karun before implementation.
In this study, the focus will be on the IBWT projects for the Zayanderud basin. It is located west of the central basin, as shown in Figure 1. It has a population of around four million and, in recent years, this basin has been developed very extensively. In order to meet the increasing water demand in this basin, four IBWT projects (Cheshmelangan, Kuhrang-III, Gukan and Behestabad) have been developed to transfer water from the Large Karun River. These projects transfer water to the Zayanderud River, which passes through Isfahan; an important and historical city of the country, which attracts around one million domestic and foreign tourists every year.
As the Decision Maker (DM), the Isfahan Re-gional Water Company wants to compare these IBWT projects. Before evaluating these projects, it is nec-essary to construct a general hierarchy of the crite-ria. As the rst step, the major watershed plans of twenty countries were examined, including plans from Turkey, Pakistan, India, Kenya, Sweden, the United States and Brazil. Based on the state-of-the-art reviews and the national acts of Iran, the preliminary hierarchy was then introduced [10]. In order to revise, simplify and nalize the preliminary hierarchy, the Value Management Methodology was used by thirty experts. Value Management is a style of
management particularly dedicated to motivate people, develop skills and promote synergies and innovation, with the aim of maximizing the overall performance of a system. This method was pioneered by Miles [11] in the 1940's and 50's and, in this study, the concept of value is based on the following relationship:
Value = Satisfaction of the needsUse of resources : (1) In conducting the Value Management study, stake-holders were selected from the Government, consulting companies, universities and, also, from NGOs (Non Governmental Organizations). The revised hierarchy is shown in Figure 3, consisting of seven main criteria and thirty-two attributes [9]. The main criteria are social and cultural, political, security and legal, technical and executive, environmental, economical and nancial, demand management and comprehensive management. In this case study, only seven attributes were selected from the hierarchy, since some of them were irrelevant to the IBWT projects and, also, there was a lack of reliable data to evaluate the projects with
respect to some of them. The nally selected attributes and their denitions are as follows:
Allocation of water to prior usages: Domestic, industrial, agricultural, environmental and recre-ational water usage has to be prioritized;
Diversication of nancial resources: The govern-mental budget for the construction of the projects is limited and uncertain. It is, therefore, an advantage if a project has other nancial resources; from the private sector or from foreign funds;
Resettlement of people: Any IBWT needs a reservoir in its origin and, consequently, it requires relocating the people from that area. However, it is a negative attribute and may create social hazards;
Public participation: IBWT projects create social conicts in the region. If the people have higher participation in relocation related decisions, i.e. in selling their lands, in labour supply and in regulating their water rights, then, the project will be accepted more easily and can become successful;
Consistency with policies: How much consistency is there between the alternatives and the national, regional and local policies?
Benet/cost: This is an index for the nancial eciency of the projects;
Range of environmental impacts: These impacts are assumed to be negative.
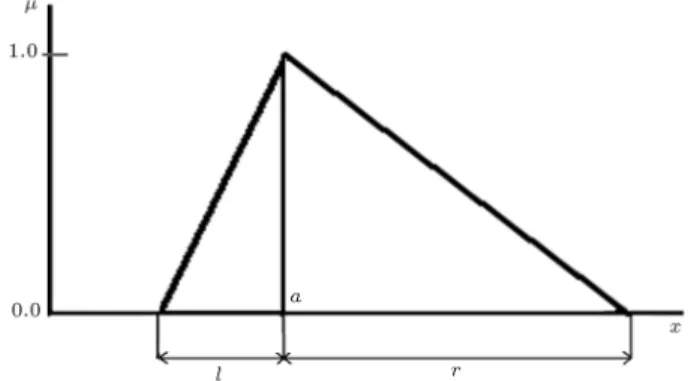
The data of evaluating the alternatives, with respect to the above seven criteria, is presented in Table 1. They were obtained by using a group of experts from the DM company. The uncertainty of the data is represented by using either triangular fuzzy numbers or linguistic variables. A general fuzzy number is dened by its membership function. A triangular form was used, which is shown in Figure 4. In the case of linguistic variables, the followings were used: Very Low (VL), Low (L), Slightly Low (SL), Medium (M), Slightly High (SH), High (H) and Very High (VH).
METHODOLOGY
The comparison of the decision alternatives given in Table 1 is based on their combined goodness measures.
Figure 4. A triangular fuzzy number (a, l, r).
OWA can be used to aggregate the evaluations of each alternative with respect to the criteria. An n-dimensional OWA operator assigns a combined good-ness measure for each alternative:
F (a1; a2; : : : ; an) = n
X
j=1
wjbj
= w1b1+ w2b2+ + wnbn; (2)
where F : In 7! I, with I = [0; 1] and b
j is the jth
largest element in the set of fa1; a2; ; ang. The
evaluations of an alternative, with respect to the n criteria and wj(j = 1; 2; ; n), are the order weights,
such that wj 0 and n
P
j=1wj = 1. That is, the OWA
operator is a convex linear combination of the bjvalues.
Notice that the components of the input vector have been ordered before multiplying them by the order weights. The OWA method has a large variety, due to the dierent selections of the order weights. Order weights depend on the optimism degree (well known as the Orness degree) of the DM. The greater the weights at the beginning of the vector, the higher the optimism degree will be. Yager [1] dened the optimism degree, , as:
= n 11 Xn
j=1
(n j)wj: (3)
Xu [12] gives a general overview of the dierent meth-ods for determining the order weights. In the next section, the new method, called the revised OWA, will be introduced.
REVISED OWA
In natural language, many linguistic terms are used, such as most, few, many and about half. Zadeh [13]
Table 1. Evaluation matrix of IBWT projects. Attributes Allocation
of Water to Prior
Usages
Diversication of Financial
Resources
Resettlement of People
Public
Partici-pation
Consist-ency with Policies
Benet/Cost
Range of Environ-mental Impacts Weights of Attributes
Alternatives VH M VH
(Negative) L H M
SL (Negative) 1 Gukan SH (5.0, 1.0, 1.0) (0.0, 0.0, 0.1) SH H (1.5, 0.1, 0.1) L 2 Cheshmelangan VH (0.0, 0.0, 0.2) (0.0, 0.0, 0.1) M VH (1.4, 0.3, 0.3) M 3 Kuhrang-III VH (3.0, 1.0, 1.0) (200.0, 50.0, 50.0) H VH (1.1, 0.3, 0.3) SL 4 Beheshtabad VH (4.0, 1.0, 1.0) (4000.0, 50.0, 50.0) VH H (1.6, 0.3, 0.3) SH
called them linguistic quantiers. Classical logic ben-ets from only two of these terms; the existential quantier, there exist, and the universal quantier, all, in forming logical propositions [14]. Zadeh [13] suggested the modeling of these linguistic quantiers by using fuzzy sets. In this paper, these linguistic inputs are modeled by Regular Increasing Monotonic (RIM) quantiers. An RIM quantier, Q, characterizes aggregation imperatives, in which higher satisfaction is obtained by including more objects. This quantier has the following properties:
R(Q) = [0; 1]; Q(0) = 0; Q(1) = 1;
Q(r1) Q(r2); if r1 r2: (4)
Yager [1] suggested obtaining the weights of an n-dimensional OWA operator as:
wj= Q
j n Q j 1 n
; j = 1; 2; ; n: (5) Notice rst that the derivative of the fuzzy quantier, Q, is as follows:
dQ
dr = limr!0
Q(r) Q(r r)
r : (6)
In a special case when n is large, we may select r = 1=n, and so:
dQ
dr
Q(r) Q(r 1=n)
1=n :
Yager [15] evaluated the value of dQ=dr at r = j=n by using Equation 5 as follows:
dQ dr r=j=n
Q(j=n) Q((j 1)=n)
1=n =
wj
1=n; so:
wj 1ndQdr
r=j=n
: (7)
These weights depend on only the order of the criteria. More accurate weight selection can be obtained if the weights depend on also the evaluations of the criteria. So, instead of using Equation 7, the following weight selection is proposed:
wj= 1ndQdr
r=1 bj
; (8)
where b1 b2 bn or (1 b1) (1 b2)
(1 bn). The reason for using the term (1 bj) instead
of bj is due to the opposite ordering of the criteria in
Equation 7, in comparison to the ordering of the bj
values in the case of RIM quantiers.
These values, however, do not satisfy the nec-essary conditions of OWA weights, since their sum usually diers from unity. After normalizing the wj
values in Equation 8, the nal weights are obtained as follows:
wj= Q 0(1 b
j) n
P
l=1Q
0(1 bl): (9)
This method of weights selection is called revised OWA [16], since it is based on the exact derivatives of the quantier. The weights obtained by Equation 9 satisfy all necessary conditions of the OWA weights. The revised OWA operator, with weights obtained by Equation 9 and with any fuzzy quantier, is a neat operator, since the combined goodness measure, F , is independent of the ordering of the inputs:
F (a1; a2; ; an) = n
X
j=1
wjbj = n
X
j=1
Q0(1 bj) n
P
l=1Q
0(1 bl)bj
=Xn
j=1
Q0(1 a j) n
P
l=1Q
0(1 al)aj
=
n
P
j=1Q
0(1 aj)aj n
P
l=1Q
0(1 al) : (10)
An additional benet of using neat OWA operators in comparison to the initial OWA is due to the fact that, in this case, more attention is given to the context of the problem (e.g. to the evaluation values, bj). It is,
however, a drawback of revised OWA that the weights have to be calculated separately for each alternative. RANKING THE IBWT PROJECTS
We can now return to the case study introduced earlier (second section). The combined goodness measures of four IBWT projects are determined by using the revised OWA. The calculation procedure is as follows: Step 1. At the beginning, the evaluations of the projects, with respect to the attributes, were either linguistic variables or triangular fuzzy numbers. The linguistic data were modeled by crisp numbers, according to the uniform scale shown in Table 2. Other scales could also be introduced based on non-uniform distributions. All triangular fuzzy numbers were also defuzzied by using the centroid method.
Table 2. Linguistic variables and equivalent crisp numbers.
Linguistic Variables Number Very Low 0.05
Low 0.20
Slightly Low 0.35 Medium 0.50 Slightly High 0.65
High 0.80
Very High 0.95
Step 2. The evaluations of the alternatives, with re-spect to the attributes, have been normalized into the unit interval [0, 1] as follows:
ai =
8 > > > < > > > :
Ai
max
1jn(Aj)
for positive criteria;
min
1jn(Aj)
Ai for negative criteria.
(11)
Step 3. In the original version of OWA, the attribute weights are considered to be equal, however, in this case, they are not equal, as shown in the rst row of Table 1. These weights are multiplied by evaluations of the alternatives after they are normalized in Step 2.
Step 4. The order weights are determined by using Equation 9. Table 3 shows the results for the alternative Gukan.
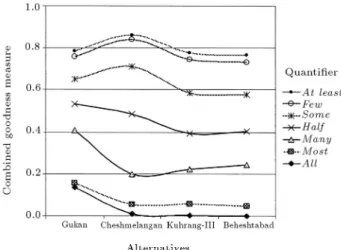
Step 5. The combined goodness measures have been nally calculated by using Equation 10. The results are shown in Figure 5.
According to Figure 5, Cheshmelangan is the most preferred project when the DM is optimistic (based on the quantiers At least, Few and Some). Gukan is, however, the most preferred project if the DM is neutral (by the quantier half) or pessimistic (by the quantiers Many, Most and All).
Figure 5. The combined goodness measures of IBWT projects.
The corresponding ranks of the alternatives are shown in Table 4. The rst column, \current state of project", reects the previous decisions of the DM, in which Cheshmelangan is in operation (rank 1), Kuhrang-III is under construction (rank 2), Gukan is in the nal study (rank 3) and Beheshtabad is under investigation (rank 4).
The most and least preferred projects, according to the column \current state of project", are the same as in the columns of some, few and at least, which represent the optimistic view of the DM. Therefore, one can conclude that the DM was optimistic about the IBWT projects. Water managers are usually not risk-taking individuals. However, in the case of Zayanderud, the DM is the water recipient and not the water supplier. He/she wants to bring as much water as possible to the Zayanderud basin, which explains the optimistic view.
However, the optimism degree of the DM is also subject to national and local policies. If the DM is felt to be pessimistic, due to risky conditions, the Gukan project would be the most preferred project. The ranks of the other projects also depend on the optimism degree. As an illustration, a sensitivity analysis was performed on the ranks of the alternatives, due to the
Table 3. The OWA weights for the alternative Gukan. Quantier/Situation Optimism
Degree w1 w2 w3 w4 w5 w6 w7 All 0.001 0.000 0.000 0.000 1.000 0.000 0.000 0.000 Most Pessimistic 0.091 0.071 0.012 0.000 0.910 0.000 0.007 0.000 Many 0.333 0.199 0.162 0.100 0.264 0.015 0.153 0.107 Half Neutral 0.500 0.143 0.143 0.143 0.143 0.143 0.143 0.143 Some 0.667 0.095 0.105 0.134 0.083 0.344 0.109 0.130 Few Pessimistic 0.909 0.056 0.067 0.104 0.043 0.562 0.071 0.098 At least one 0.999 0.047 0.058 0.094 0.036 0.615 0.062 0.088
Table 4. Ranks of IBWT projects.
Current State Fuzzy Quantiers
Alternatives of the Projects All Most Many Half Some Few At Least
Gukan 3 1 1 1 1 2 2 2
Cheshmelangan 1 2 3 4 2 1 1 1 Kuhrang-III 2 3 2 3 4 3 3 3 Beheshtabad 4 4 4 2 3 4 4 4
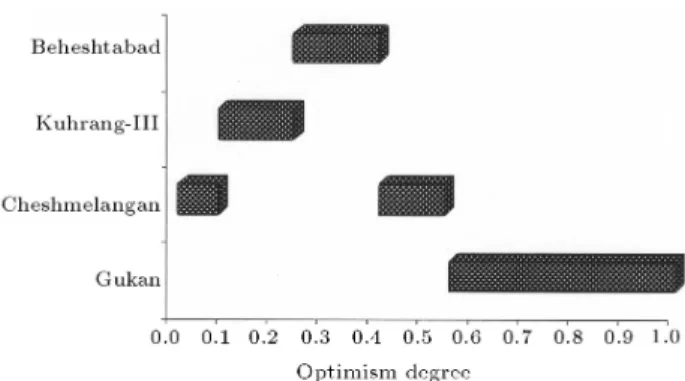
changes in the optimism degree. The interval [0.01, 0.99] was selected with an increment of 0.03 and the entire procedure was repeated for all particular values of the optimism degree. The results are shown in Figures 6 through 9, which illustrate the dependence of the preference order on the optimism degree, or how the ranks would change by the dynamic feature of the optimism degree.
According to Figures 5 through 9, the ranks of the projects are robust in the entire optimistic section, ( > 0:5). However, in the pessimistic section, their dependence on the optimism degree is not monotonic. Therefore, precise knowledge of the optimism degree of the DM in the pessimistic region, ( < 0:5), is very important for securing a safe and satisfactory decision.
Figure 6. Most preferred alternatives.
Figure 7. Second most preferred alternatives.
Figure 8. Third most preferred alternatives.
Figure 9. Least preferred alternatives.
CONCLUSIONS
The Revised OWA operator was introduced and ap-plied successfully in ranking IBWT projects for Zayan-derud, Iran. The results of this study show that this new method is better than the other traditional MADM methods [9], since by using a quantiable method, it reects the optimism/pessimism nature of the DM. The comparison of obtained results with the current state of the projects shows the optimistic character of the DM.
Revised OWA uses fuzzy quantiers to achieve a better characterization of the DM's satisfaction. It is, therefore, a context based model, in which the ordering of the initial inputs is not required, so it is a neat operator. This new method, therefore, oers a more ecient way of computing the OWA weights. A sensitivity analysis illustrated the
de-pendence of the rankings on the optimism degree of the DM.
ACKNOWLEDGMENTS
The authors are very grateful to Professor A. Memari-ani and Professor M. Modarres Yazdi for their valuable comments. The technical support of the Water Re-sources Management Company of Iran, Mahab Ghodss consulting engineers and the Isfahan Regional Water Company in Iran is appreciated.
REFERENCES
1. Yager, R.R. \On ordered weighted averaging aggre-gation operators in multi-criteria decision making", IEEE Transactions on Systems, Man and Cybernetics, 18(1), pp. 183-190 (1988).
2. Despic, O. and Simonovic, S.P. \Aggregation operators for soft decision making in water resources", Fuzzy Sets and Systems, 115, pp. 11-33 (2000).
3. Yalcin, G. and Akyurek, Z. \Multiple criteria analysis for ood vulnerable areas", in Proc. of 24th Annual ESRI International User Conference, San Diego, USA (August 9-13 2004).
4. IDRISI, Clark Lab: http://www.clarklabs.org/ (Ac-cessed 2006).
5. McPhee, J. and Yeh, W.W.-G. \Multiobjective op-timization for sustainable groundwater management in semiarid regions", Journal of Water Resources Planning and Management, ASCE, 130(6), pp. 490-497 (Nov.-Dec. 2004).
6. Fu, G., Hall, J. and Lawry J. \Beyond probabil-ity: new methods for representing uncertainty in projections of future climate", Tyndall Centre for Climate Change Research Working Paper 75: http:// www.tyndall.ac.uk (Accessed 2006).
7. Mulino: MULti-sectoral, INtegrated and Opera-tional Decision Support System, http://www.feem.it/ mulino/ (Accessed 2006).
8. Makropoulos, C.K. and Butler, D. \Spatial ordered weighted averaging: incorporating spatially vari-able attitude towards risk in spatial multi-criteria decision-making", Environmental Modeling and Soft-ware, 21(1), pp. 69-84 (2006).
9. Zarghami, M., Ardakanian, R. and Memariani, A. \Fuzzy multiple attribute decision making on inter-basin water transfers, case study: transfers to Zayan-derud basin in Iran", Water International, 32(2), pp. 280-293 (2007).
10. Ardakanian, R. and Zarghami, M. \Sustainability cri-teria for evaluating the water resources projects", First National Conference on Water Resources Manage-ment, IRWRA (Iranian Water Resources Association), Tehran, Iran (in Farsi) (2004).
11. Miles, L.D. \Techniques of value analysis and engineer-ing", Miles Value Foundation, http://www.wisc.edu/ wendt/miles/milesbook.html (Accessed 2006). 12. Xu, Z.S. \An overview of methods for determining
OWA weights", International Journal of Intelligent Systems, 20, pp. 843-865 (2005).
13. Zadeh, L. \A computational approach to fuzzy quanti-ers in natural languages", Computquanti-ers and Mathemat-ics with Application, 9, pp. 149-184 (1983).
14. Yager, R.R. \Quantier guided aggregation using OWA operators", International Journal of Intelligent Systems, 11, pp. 49-73 (1996).
15. Yager, R.R. \Families of OWA operators", Fuzzy Sets and Systems, 59, pp. 125-143 (1993).
16. Zarghami, M. and Szidarovszky, F. \Revising the OWA operator for multi criteria decision making prob-lem under uncertainty", European Journal of Opera-tional Research, doi: 10.1016/j.ejor.2008.09.014 (2008) (in press).
![Figure 1. IBWT project from basin 3 to basin 4 [9].](https://thumb-us.123doks.com/thumbv2/123dok_us/8399468.2231696/2.892.452.802.149.408/figure-ibwt-project-basin-basin.webp)
![Figure 3. Hierarchy of criteria for the evaluation of the projects [9].](https://thumb-us.123doks.com/thumbv2/123dok_us/8399468.2231696/3.892.172.738.570.1116/figure-hierarchy-criteria-evaluation-projects.webp)