Certain effects of agitation upon the release of phosphate from mud
10
0
0
Full text
(2) 372. WILLIAM. STEPHENSON. sea water, and between 1'15 and 1'18 for samples diluted with an equal volume of distilled water. Reagent blanks were determined as described by Cooper (1933) and allowances were made for salt errors in these blanks. Harvey (1948) has shown, in a paper published since this work was completed, that with stored reagents, blanks are largely due to silicomolybdate formation, and are not subject to salt errors. The results are thus too low by amounts up to about 2 mg. P20s/m.3. The experimental error is estimated at about :t 2 mg./m.3, and any arsenate present is included as phosphate (Atkins & Wilson, 1927). Mud. A scraping of the top centimetre of mud, containing Corophium, was collected on II December 1946 from mid-tide level on the south bank of the River Blyth, close to the Fever Hospital. Sand and grit were removed by" washing, and sea water, mud, silt, and Corophium were added to a greenish glass tank (35 x 27 x 35 em.) in a shaded corner of the laboratory. The solids settled as a loose brown layer about 7 mm. thick, and were kept for about a month before the experiments started. . Filtration. With turbid liquids, filtration was essential. Whatman No. 542 papers were used and the first 20 ml. of filtrate discarded. Distilled water, sodium chloride solution, and dilute sodium bicarbonate solution extracted no phosphate from these papers or from the glassware. pH determinations were performed colorimetrically, and the results, after correction for salt errors, are accurate to about the nearest 0'°5. RESULTS Preliminary experiments. .. Sea water in contact with settled mud w.as analysed. After stirring for 5 min., samples were pipetted at intervals from the middle of the water column, filtered, and analysed. Typical results are given in Table I, and these show, first, TABLEI 8/9 January. 1947; P20S at 23.00 hr. G.M.T., 125 mg./m.3; Interval between stirring and collection of sample "(min.) 0 75 120 195 240 265 460. Duration of filtration (min.) 15 15 10 15 15 15 15. stirred. 23.15-23.20. hr.. P20S (mg./m.3) III 110 120 122 109 123 112. considerable variation in phosphate concentration, and secondly that this concentration has decreased. Later experiments gave both increases (Table III) and decreases (Table II) in concentration..
(3) RELEASE. OF PHOSPHATE. 'FROM. MUD. 373. Ultrafiltration In the above experiment only the original sample was unfiltered, and particulate or colloidal material may have increased its phosphateconcentration. To evaluate the significance of a colloidal fraction, sea water and mud were stirred, then filtered, and then ultrafiltered through a collodion membrane. .After ultrafiltration the phosphate should be reduced by an amount equivalent to that released from the colloids. Collodion ultrafilters were prepared round a 2' 5 cm. boiling tube from the following mixture: 7'0 g. dry pyroxylin, 100 ml. absolute alcohol, 100 ml. ether, 4.8 g. ethylene glycol. A first coat was applied at 20° C. and dried for approximately 3 min., and a second similar coat added. A third coat was allowed to dry at 20° C. for about 10 min., and then at IS° C. for about 2t hr. The membrane was removed from the tube after standing in water for I hr. Many membranes were made similarly, but mostly burst under high pressures. Those finally selected withstood a pressure of 600 mm. Hg and filtered Congo Red from aqueous solution. During ultrafiltration, a pressure of 500-550 mm. Hg was used. Sea water and mud were stirred, and two samples collected, one for normal filtration, and the second for normal filtration followed by ultrafiltration. Analyses showed (see Table II) thatthe ultrafiltered samples gave the greater phosphate concentrations. These increases were not due to evaporation of water, as chlorinities. increased. only by o. 5 % during ultrafiltration.. TABLEII 9/10 January 1947; P.05 at 23.00 hr. G.M.T.,on unfiltered unstirred sea water, 123 mg.jm.3; stirred 23.15-23.20 hr. Interval between stirring and collection of sample (min.) 0. Duration filtration (min.) 15. P.05 (mg./m.3) lI5. 40. -. 2. 10. 120. 2. 35. 0. -. Duration ultrafiltration (min.). P.05 (mg./m.3). 125. 149. -. -. -. -. 139. 145. In the next experiment, sea water was stirred with mud, filtered, and analysed. Half the filtrate was ultrafiltered, and the remainder left stanqing in a covered beaker for the duration of ultrafiltration. The results (Table III) confirm the increase in phosphate on ultrafiltration, and show that when filtered samples stand in glassware, a marked reduction in phosphate concentration may occur. The anomalous effects of ultrafiltration might be complicated by changes on storage, and these were therefore investigated. 24-2.
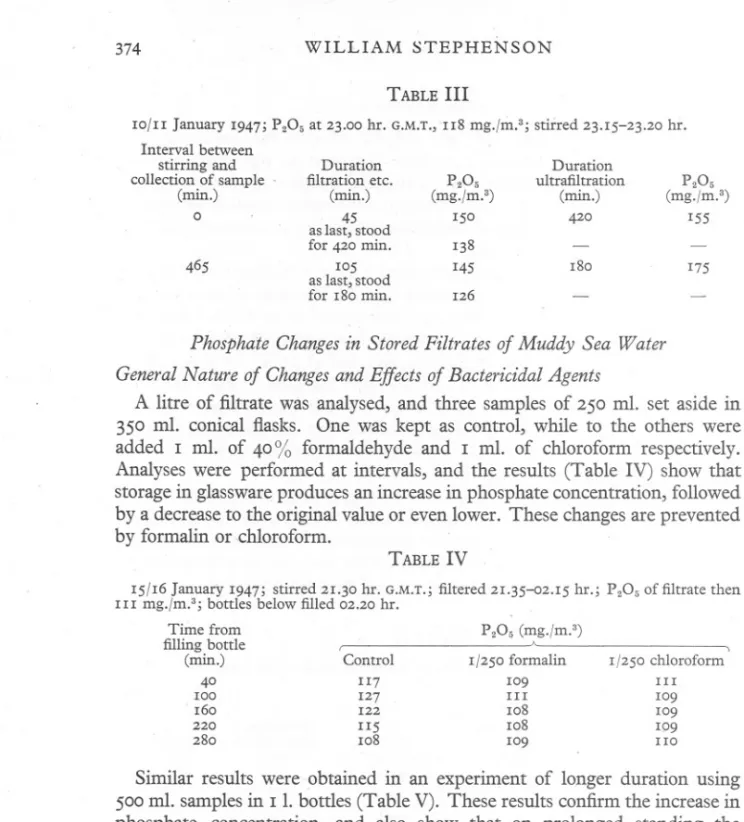
(4) WILLIAM. 374. STEPHENSON TABLE III. IOfII January 1947; p,O. at 23.00 hr. G.M.T.,u8 mg.fm."; stirred 23.15-23.20 hr. Interval between Duration Duration stirring and filtration etc. ultrafiltration collection of sample. p,O. p,O. (min.) (min.) (min.) (mg.fm.") (mg.fm.") 0 420 45 150 155 as last, stood 138 for 420 min. 180 465 145 175 105 as last, stood 126 for 180 min.. Phosphate Changes in Stored Filtrates of Muddy Sea Water General Nature of Changes and Effects of Bactericidal Agents A litre of filtrate was analysed, and three samples of 250 m1. set aside in 350 m1. conical flasks. One was kept as control, while to the others were added I m1. of 40% formaldehyde and I m1. of chloroform respectively. Analyses were performed at intervals, and the results (Table IV) show that storage in glassware produces an increase in phosphate concentration, followed by a decrease to the original value or even lower. These changes are prevented . by formalin or chloroform. TABLE IV I5fI6 January 1947; stirred 21.30 hr. G.M.T.; filtered 21.35-02.15 hr.; p,O. of filtrate then III mg.fm."; bottles below filled 02.20 hr. Time from filling bottle (min.) 40 100 . 160 220 280. p,O. (mg.fm.") A. Control II7 127 122 1I5 108. If250 formalin 109 III 108 108 109. If250. chloroform III 109 109 109 IIO. Similar results were obtained in an experiment of longer duration using 500 m1. samples in I 1. bottles (Table V). These results confirm the increase in phosphate concentration, and also show that on prolonged standing the phosphate concentration decreases to below the original value. It should, be noted that while the results given in Tables IV and V are similar, the changes are less marked in the latter. Further experiments confirmed both the initial increase 'and subsequent decrease, for example in one experiment phosphates increased from III to 144 mg.jm.3 on standing for an hour, and in another they decreased "from 100 t02 mg.jm.3 on standing for 18 hr. The results in ,Table V also confirm that both formalin and chloroform prevent both the increase and decrease in values, and further work showed that a Ij250 concentration of toluene had a similar effect..
(5) RELEASE. OF PHOSPHATE. FROM. MUD. 375. TABLE V 17 January 1947; stirred °9.3° hr. G.M.T.; filtered °9.3°-10.10 97 mg./m."; bottles filled 10.3° hr. Time from filling bottles (hr.) 1 2 3 d5t 6t 7t 8t 9':r. hr.; p.O. of filtrate then. p.O. (mg./m.3) A. , Control. 1/250 formalin 98 98 99 97 96 96 95 9;5 94. 1°4 101 101 98 98. 9°. 86 84 84. , 1/250 chloroform 97 99 98 98 95 96 95 96 95. The increase in concentration probably explains the high values after ultrafiltration because this process takes about the same time as the attainment. of maximum values on standing. Rise and fall are prevented by bactericidal agents, and this suggests that living organisms in the filtered samples are responsible. . Changes in the Physico-Chemical. Environment. Both rise and fall in phosphate concentration can occur during night or day, and when temperatures are either rising or falling (within the range II'0-17'So C.). The phenomena are not independent of temperature, since the fall at least is greatly retarded by low temperatures. For example, an original phosphate concentration of 10S mg./m.3 immediately after filtration was reduced after 19 hr. at 13-14° C. to 2 mg./m.3, but a parallel sample at 0° C. was only reduced to 87 mg./m.3. The phosphate increase on storage is accompanied by a small increase in pH, but the subsequent decrease occurs without further pH change (Table VI). TABLEVI 17 January Winchester.. 1947; stirred °9.3° hr. G.M.T.; filtration °9.3°-11.10 Time elapsed after filtration (min.) 10 7° 13° 19° 25° 310 370. p.O. (mg./m.") 91 lI8 1°9 1°9 108 108 107. hr.; solution stored in. pH 7'4 7'5 7'55 7'6 7'6 7.6 7'6. A filtrate of muddy sea water was poured into bottles, hydrochloric acid or sodium bicarbonate solution added, and the whole thoroughly shaken. (The.
(6) WILLIAM. 376. STEPHENSON. acid and bicarbonate contained negligible quantities of phosphate.) The results of a short experiment (Table VII) show that increasing the pH augments the risein phosphate, while decreasing it has virtually no effect. TABLEVII 20 January 1947; stirred ro.50-IO.55 hr. G.M.T.; filtration IO.55-12.ro hr. Interval between Alkaline filtration and , "-", collection of sample P,Os (min.) (mg.jm,3) pH 5 ro 8,8 IIO. 141. Control. Acid (I). "-",. P,Os (mg.jm,3) 121 -. 8,8. 126. ". pH 7"4 7'45. ,. Acid (2). ,. "-". P,Os (mg.jm,3). pH. P,Os (mg.jm,3). 128. 6,6 6'7. 129. 7'8. pH 6'4 6'5. For longer experiments, considerable volumes of filtrates are needed, and filtration takes so long that most of the rise in phosphate concentration has passed. When filtered samples are stored overnight, however, and the phosphate accordingly reduced, this can be regenerated by shaking. Vessels half full of liquid were shaken by hand for 5 min., and the subsequent change~ in phosphate concentration were exactly similar to those observed after filtration (see control sample, Table VIII). This is of great interest, and suggests that the normal initial rise in phosphate may be due to me<;hanical agitation of the mud and sea water. Further work upon the effect of pH was performed upon the changes occurring when filtered stored sea water is reshaken by hand for 5 min. Results Eiregiven in Table VIII, and these, in addition to demonstrating the effects of agitation, show that: (a) increases in pH augment the initial phosphate rise, but decreases have only a very slight effect; (b) pH changes have little effect on the subsequent fall in phosphate concentration. TABLEVIII 20 January 1947; stirred 10.50-10.55 hr. G.M.T.; filtered 14.3°-18.00 hr.; stored overnight at 8° C, At °9.35 hr. 21 January, P,Os, 98 mg.jm,3. At °9.4° hr. poured into flasks, acid and alkali added except to control; all shaken till 09.45 hr. Interval between Alkaline shaking and , "-" collection of sample P,Os (min.) (mg.jm.3) pH 5 9'1 65 125 9'01. ,. Control. ,. "-". P,Os (mg.jm.3). Acid (I) "-". P20s (mg.jm.3) 1°3. 102. pH 7'9 7'9. 125. 148. 9'1. II5. 7'9. 120. 6,8. 185 305 365. II9 1°3 94. 9'°5 9'°5 9'05. 1°4 78 7°. 7'9 7,8 7.8. II6 100 85. 6'9 6'9 6'9. 25 85. pH 6,8 6,8. After 385:min. (at 16.10 hr. G,M.T.) all shaken for 15 min. II9 9'05 89 7'85 95 6'9 1°5 9'05 74 7'8 89 6'9. ,. Acid (2) "-". P,Os (mg.jm.3) 1°3 125 125 102 88. pH 6'2 6'2 6'2 6'3 6'3 6'25. 87 1°4. 6'3 6'2.
(7) RELEASE. OF PHOSPHATE. FROM. MUD. 377. Size of the ContainingVessel At various times, different-sized bottles of different types of glass were used for storage. The changes were similar for all types, but seemed greater with small vessels. (Compare, for example, the results in Tabies IV and VI.) The effect of the size of the bottle was therefore investigated, using bottles of similar shape, and made of similar (white) glass. The results (Table IX) show that both rise and fall in phosphate values are greater in smaller vessels. Recovery of Phosphate after Disappearance on Long Standi1'1:g After standing overnight at 140 C. the phosphate concentration of a filtered sample of muddy sea water was reduced from 1°5 to 2 mg.Jm.3. About onethird of the phosphate which had disappeared was recovered from the containing vessel after treatment with distilled water on a water-bath for It hr. None was obtained from the liquid after boiling for It hr. TABLEIX 4 January 1947; stirred 09.20-°9.25 hr. G.M.T.; filtered 09.25-II.IO hr. At 11.40 hr. P,Os, 97 mg./m.". At 11.45 hr. all bottles filled to depth of 7 em. and shaken vigorously till II.50 hr. P,Os in mg./m.3 in bottles of Adifferent sizes (diameter, em.) 5'6 Interval between filling bottle and collection of sample (hr.) I 3 5 23. c. 148 107 105 100 75. 8'0 7'i Area in contact with liquid (em.') ' C.226 c.I96 101 99 102 98 100 96 81 92. 9'7 c.291 97 98 94 92. DISCUSSION. Preliminary experiments on the effect of agitation upon the exchange of phosphate between estuarine mud and sea water gave variable results. Sometimes phosphate was evolved, and sometimes absorbed by the mud. It was suspected that colloidal material in the samples was introducing complications, and that removal of colloids would reduce the apparent amounts of inorganic phosphate present. On the contrary, removing the colloids was accompanied by an increase in phosphate concentration. A similar increase occurs, however, when filtered sea water stands il).glassware for the duration of ultrafiltration, and this obscures any possible effects of colloids. The increase is not due to phosphate leaching from the glassware, and implies the conversion of a precursor into' Deniges active phosphate'. This process is more obvious in small containing vessels, which is reminiscent of the effects of size of the containing vessel upon the growth of bactetial populations in stored sea water (ZoBell & Anderson, 1936; Lloyd, 1937; ZoBell, 1946, p. 83). It is also prevented by bactericides. Redfield, Smith & Ketchum (1937) have shown that bacteria will pass extremely fine filters, and.
(8) 378. WILLIAM. STEPHENSON. Dr H. W. Harvey also informs me (personal communication)that cells up to 3fLin diameter can pass the filters here employed. It appears, therefore, that the above liberation of phosphate is due to the activity of living organisms, but work at present in progress shows that large quantities of phosphate can be freed from animal tissues solely as a result of enzymes in the tissues themselves. On more prolonged storage, phosphate disappears from solution, and is probably mainly immobilized on the walls of the containing vessel. This removal is slowed by cold and bactericides, and depends on the size of the I. vessel.This suggests that living organismsare alsoresponsible for the removal of phosphate. Mter this removal,phosphate can be regenerated by shaking the vessel, and if the previous reduction in concentration is due to removal by bacteria, regeneration is likelyto be due to destruction of bacteria, and release of phosphorus-containing compounds. The similarity between the phosphate release on shaking a filtrate and the initial releasewhen muddy water is filtered suggeststhat, in the latter process, phosphate is also derived from the protoplasm of destroyed organisms. It is impossible to say whether these are destroyed by the stirring of the mud and water or by the filtration which follows. Probably both processes assist in phosphate release. Waksman, Stokes & Butler (1937) and Renn (1937) have shown that phosphate'is rapidly regenerated from autolysing bacteria, but as they dealt with large bacterial populations, with different proportions cytolysing at any given time, there is no indication of how long it takes for an individual cell to free its phosphate. Under present conditions this process seems to take about 2 hr. to be completed. The followinghypothesis explains the observed facts: (i) When mud and sea water are mixed by stirring, or when muddy sea water is filtered, or when the filtrates are agitated, bacteria are destroyed. (ii) Their protoplasm, rich in phosphorus, is broken down by living bacteria, with release of phosphate. (ill) The bacteria grow, using the remaining organic matter, now poor in phosphorus. (iv) During growth, they reabsorb the phosphate previously released. The overall effect is therefore of phosphate absorption by the bacteria. Renn (1937) and Waksman et al. (1937) have already shown that when sea water is incubated in the dark, for the first day or two phosphate is absorbed. Work at present in progress has often given similar results. This work has been solelyconcerned with exchange of phosphate between a s~rface scraping of aerated mud and sea water. Similar results have been obtained with severalsamplesof aerated muds and silts, but there are preliminary indications that oxygen-freemuds give different results..
(9) RELEASE. OF PHOSPHATE. FROM MUD. .. 379. SUMMARY. When sea water is stirred with mud and then filtered, its phosphate concentration may either increase or decrease. When the filtrate is ultrafiltered, the concentration increases. Similar increases occur when the filtrate is stored in glassware, and these obscure any effectsof the presence of colloidal material. On storage concentrations rise for about 2 hr., and then fall to as low as 2 mg.fm.3P20Sin 18 hr. Rise and fall are both prevented by the addition of formalin, chloroform or toluene, and are more noticeable in small containing vessels. Both occur during either day or night, and when temperatures are either rising or falling. The increase in phosphate is accompaniedby a small increase in pH and is augmented by an increase in pH value. When a filtrate of muddy sea water is kept overnight, and the phosphate concentration reduced, phosphate can be regenerated by shaking. The phosphate which disappears on long-standing is largely immobilizedon the walls of the vessel. It is suggested that these changes are due to: (i) destruction of organisms by agitation with release of protoplasm; (ii) breakdown of this protoplasm by bacteria with release of phosphate; (ill) absorption of phosphate by bacteria growing on the walls of the vessel. REFERENCES ATKINS,W. R. G., 1923. The phosphate content of fresh and salt waters in its relationship to the growth of algal plankton. Journ. Mar. Bioi. Assoc., Vol. 13, pp. II9-50. ATKINS,W. R. G. & WILSON,E. G., 1927. The phosphorus and arsenic compounds of sea water. Journ. Mar. Bioi. Assoc., Vol. 14, pp. 6°9-14. . COOPER,L. H. N., 1933. Chemical constituents of biological importance in the English Channel. Journ. Mar. Bioi. Assoc., Vol. 18, pp. 677-728. COOPER,L. H. N., 1938. Salt error in the determiriation of phosphate in sea water. Journ. Mar. Bioi. Assoc., Vol. 23, 171-8. HARVEY,H. W., 1937a. The supply of iron to diatoms. Journ. Mar. Bioi. Assoc., Vol. 22, pp. 205-19. HARVEY,H. W., I937b. Note on colloidal ferric hydroxide in sea water. Journ. Mar. Bioi. Assoc., Vol. 22, pp. 221-5. HARVEY,H. W., 1945. Recent Advances in the Chemistry and Bioiogy of Sea Water. Cambridge Univ. Press.' HARVEY,H. W., 1948. The estimation of phosphate and of total phosphorus in sea water. Journ. Mar. Bioi. Assoc., Vol. 27, pp. 337-59. IBANEZ,O. G., 1933. Note on the effect of salts in the determination of phosphates in sea water by Deniges method. Journ. Conseii Int. Expior. Mer, Vol. 8, pp. 326-9. LLOYD, B., 1937. Bacteria in stored sea water. Journ. Roy. Tech. Coll. Giasgow, Vol. 4, pp. 173-7. ' .MARSHALL, S. M., 1947. An experiment in marine fish cultivation. III. The plankton of a fertilized Loch. Proc. Roy. Soc. Edinb., B, Vol. 63, pp. 21-33..
(10) 380. WILLIAM. STEPHENSON. MATTHEWS,D. J., 1916. On the amount of phosphoric acid in the sea water. off Plymouth Sound. I. Journ. Mar. Biol. Assoc., Vol. II, pp. 122-3°. MOORE,H. B., 193°. The muds of the Clyde Sea area. I. Phosphate and nitrogen contents. Journ. Mar. Bioi. Assoc., Vol. 16, pp. 595-607. REDFIELD,A. C., SMITH,H. & KETCHUM,B., 1937. The cycle of organic phosphorus ill the Gulf of Maine. Bioi. Bull. Woods Hole, Vol. 73, pp. 421-43. RENN, C. E., 1937. Bacteria and the phosphorus cycle in the sea. Bioi. Bull. Woods Hole, Vol. 72, pp. 190-5. STOCKFISCH, K. & BENADE,W., 193°. Die Charakt~isierung der Heilschlamme und verwandter Stoffe-physikalischen Eigenschaften. Mitt. Laborat. preuss. geol. Landesanst., Heft II, pp. 35-83. SVERDRUP, H. D., JOHNSON,M. W. & FLEMING,R. H., 1942. The Oceans. New York. 1087 pp. WAKSMAN,S. A., 1933. On the distribution of organic matter in the sea bottom and the chemical nature and origin of marine humus. Soil Sci., Vol. 36, pp. 125-47. WAKSMAN, S. A., STOKES,J. L. & BUTLER,M. R., 1937. Relation of bacteria to diatoms in sea water. Journ. Mar. Bioi. Assoc., Vol. 22, pp. 359-72. ZOBELL,C. E., 1946. Marine Microbiology. Waltham, Mass. 24° pp. ZOBELL, C. E. & ANDERSON,D. Q., 1936. Observations on the multiplication of bacteria in different volumes of stored sea water and the influence of oxygen tension and solid surfaces. Bioi. Bull. Woods Hole, Vol. 71, pp. 324-42..
(11)
Figure
Related documents
The purpose of the present study was to investigate the prevalence of post-traumatic stress disorder and personality disorders associated with it among veterans who
Time changing nature of pediatric practice imas been further illustrated in a recent article on time types of cases seen in practice oven the past 25 years.3 This report indicates
b) when 502 constraints are added, they entail a relatively moderate additional cost, of the order of $0.27/kg SO, in 1995, decreasing to $O.l1/kg in 2015, for a 50%
Human γδ T cell Recognition of lipid A is predominately presented by CD1b or CD1c on dendritic cells
In the group of γδ T cell+LA+DC+anti-TCRγδ mAb, γδ T cells were pre- incubated with anti-TCRγδ mAb at 37°C for 2 h; in the group of γδ T cell+LA+DC+anti-LA, LA-loaded moDCs
2 Variation in individual quality, vole abundance and territory land cover heterogeneity (Simpson ’ s Index) influencing the timing of breeding: ( a ) + 1-year parents (older adults);
“ ribosomal tree of life ” [19], it is a reasonable starting point for rooting the reticulate phylogeny, as it serves to polarize the proposed scaffold, allowing the full complexity
As shown in Figure 7, among the DOX-loaded NPs groups, DOX/DA exhibited the superior antitumor effect in vivo (70.9% ± 7.1% tumor growth inhibition), which benefited
Antimicrobial activities have been studied with the methanolic plant extracts of Abultilon indicum, Adenocalymma alliaceum, Carica papaya, Crotolaria laburnifilia, Croton
