533
DECLINE IN BLOOD HEMOGLOBIN CONCENTRATION IS ASSOCIATED WITH
FAMILIAL LONGEVITY
Yong-Han He1, Shao-Yan Pu1, Wen Li2, Xiao-Qiong Chen1, Fu-Hui Xiao1, Dong-Jing Yan3, Yao-Wen Liu1,
Rong Lin4, Xiao-Ping Liao5, Xing-Li Yang1, Ming-Xia Ge1, Wang-Wei Cai3,* and Qing-Peng Kong1*
1State Key Laboratory of Genetic Resources and Evolution, Kunming Institute of Zoology, the Chinese Academy of Sciences, Kunming 650223, China;
2Department of Endocrinology, Third People’s Hospital of Yunnan Province, Kunming, Yunnan, People’s Republic of China; 3Department of Biochemistry and Molecular Biology, Hainan Medical College, Haikou 571199, China;
4Department of Biology, Hainan Medical College, Haikou 571199, China;
5Department of Neurology, the Affiliated Hospital of Hainan Medical College, Haikou 571199, China.
*Corresponding authors: [email protected]; [email protected]
Received: August 13, 2015; Revised: September 30, 2015; Accepted: October 5, 2015; Published online: May 9, 2016
Abstract: Hemoglobin(HGB) in the blood carries oxygen from the lungs to other organs to produce energy. Calorie restric-tion has been shown to slow aging and extend lifespan. Thus, we hypothesized that HGB may be associated with human longevity as a link to energy metabolism. To test this hypothesis, HGB levels in the blood of 60 centenarian (CEN) families were measured and its association with age (20-80 and 20-100 years) was studied, as well as the associations of CEN HGB with levels in first generation offspring (F1) and their spouses (F1SP). The results showed no association of HGB with age between 20 and 80 years (r=-0.097, p=0.160); however a strikingly inverse relationship with age between 20 and 100 years (r=-0.526, p<0.001) was revealed. After dividing the samples into four age groups (20-39, 40-59, 60-80 and ≥100 years), the HGB in CEN were significantly lower than that of F1SP (p<0.001). Interestingly, the HGB levels of CEN were signifi-cantly associated with that of F1 (r=0.379, p=0.015) but not with F1SP (r=0.022, p=0.451), suggesting that HGB could be a heritable phenotype. Furthermore, the genes methylenetetrahydrofolate reductase(MTHFR), nuclear receptor subfamily 2, group C, member 1 (NR2C1) and NR2C2 were differentially expressed in CEN when compared to F1SP, which may likely be responsible for the changes in HGB levels. In conclusion,our results suggest that HGB is a heritable phenotype which associates with familial longevity.
Key words: aging; longevity; hemoglobin; centenarian; energy metabolism
INTRODUCTION
Aging is characterized by an increase in the incidence of degenerative disorders, such as cardiovascular dis-ease, cancer, type 2 diabetes and neurodegenerative diseases [1]. There are many theories to explain the aging phenotype. According to one prevailing theo-ry, increasing oxidative stress leads to elevated levels of free radicals, particularly reactive oxygen species (ROS) which are produced during cellular respira-tion, that damage biological molecules, including proteins, DNA and lipids, thereby accelerating the
above-mentioned evidence collectively suggests the importance of ROS and energy expenditure in influ-encing the aging process.
Oxygen is the most important and essential agent in cellular energy metabolism, which is coupled to the generation of ROS. Naturally, it can be inferred that the utilization of oxygen can play vital roles in the aging process. Human hemoglobin (HGB) is an iron-containing oxygen-transport metalloprotein that carries oxygen from the lungs to the other organs to produce energy. We hypothesized that HGB levels are related to human lifespan. To test this hypothesis, we investigated the association of HGB with age and longevity, and also studied its potential of inheritance in 60 centenarian families. Our results showed that HGB levels were significantly lower in centenarians, and could represent a heritable phenotype associated with familial longevity. However, whether low HGB levels are beneficial or detrimental to human longevity needs to be studied further.
MATERIALS AND METHODS
Subjects
Sixty centenarian families comprised of 61 centenar-ians (CEN), 63 members of the first generation off-spring (F1), 47 spouses of F1 (F1SP), 25 second genera-tion of offspring (F2) and 10 spouses of F2 (F2SP) were recruited from Hainan province in China. The average ages are 102.70, 62.23, 59.90, 31.87 and 31.11 years, respectively. Of the 61 CEN, 51 were female and 10 were male. All subjects belong to the Han nationality. Blood measurement
All subjects were invited to participate in a physical examination. Non-fasting blood samples were collect-ed from each family member in the clinical chemistry department of the hospital. Of the 60 CEN families, 40 were available to test the association of HGB be-tween CEN and F1 as well as F1SP. The study protocol was approved by the Ethics Committee at Kunming
Institute of Zoology, Chinese Academy of Sciences. Written informed consent was obtained from each of the participants.
RNA extraction and RNA sequencing analysis
Twenty-seven centenarians, 18 F1 and 18 F1SP were randomly selected for RNA sequencing (RNA-Seq). Total RNA was extracted from 3 mL of fresh blood us-ing the Trizol reagent (Invitrogen). RNA-Seq was per-formed at the Beijing Genomics Institute at Shenzhen according to the manufacturer’s protocol. The reads count was transformed into fragments per kilobase per million mapped (FPKM) reads [9], which reflects the abundance of the gene expression. Gene expres-sion was analyzed using the edgeR package, in which the P value was adjusted by the Benjamini-Hochberg (BH) method.
Data extraction of genes from the RNA-Seq dataset
To understand the changes in HGB, we retrieved genes associated with HGB metabolism by search-ing the NCBI (http://www.ncbi.nlm.nih.gov/) and the GWAS Catalog (http://www.genome.gov/). Of the 63 samples for RNA-Seq, there were 13 longevity families available for the association analysis of gene expres-sion between the CEN and F1 as well as F1SP. Statistics
RESULTS
Blood measurements
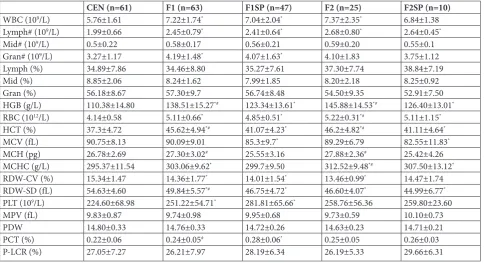
As shown in Table 1, there were significant differences in HGB levels among the CEN, F1, F1SP, F2 and F2SP groups (p<0.05). Post-hoc comparison revealed that HGB levels in CEN were significant lower than in F1, F1SP, F2 or F2SP. In addition, the levels of white blood cells (WBC), lymphocytes, granulocytes, red blood cells (RBC), hematocrit (HCT), mean corpuscular hemoglobin concentration (MCHC), red cell distri-bution width coefficient of variation (RDW-CV), red cell distribution standard deviation (RDW-SD) and platelets (PLT) were also significantly lower in CEN compared to F1, F2 and F2SP. Considering F1SP as the control group, HGB levels in F1 and F2 were sig-nificantly higher, while comparable in F2SP. Moreover, the levels of HCT, MCH and RDW-SD were higher
while those of platelet hematocrit (PCT) were lower in F1 than in F1SP. There were no differences in lym-phocyte percentage, neutrophil percentage, granulo-cyte percentage, mean platelet volume (MPV), platelet distribution width (PDW) and platelet large cell ration (P-LCR) among the groups.
Association of HGB with age, and HGB in CEN with that in F1 and F1SP
We observed a decreasing trend without significance for HGB with age between 20-80 years (r=-0.097,
p=0.160, Fig. 1A). However, when centenarians were included in the analysis, the association displayed considerable significance (r=-0.526, p<0.001, Fig. 1B). After dividing the samples into four age groups, we observed that the HGB levels in CEN were sig-nificantly lower than that in the older group (aged 60-80 years) (p<0.001, Fig. 1C), suggesting that the
Table 1. Blood parameters in 60 centenarian families.
CEN (n=61) F1 (n=63) F1SP (n=47) F2 (n=25) F2SP (n=10)
WBC (109/L) 5.76±1.61 7.22±1.74* 7.04±2.04* 7.37±2.35* 6.84±1.38
Lymph# (109/L) 1.99±0.66 2.45±0.79* 2.41±0.64* 2.68±0.80* 2.64±0.45*
Mid# (109/L) 0.5±0.22 0.58±0.17 0.56±0.21 0.59±0.20 0.55±0.1
Gran# (109/L) 3.27±1.17 4.19±1.48* 4.07±1.63* 4.10±1.83 3.75±1.12
Lymph (%) 34.89±7.86 34.46±8.80 35.27±7.61 37.30±7.74 38.84±7.19
Mid (%) 8.85±2.06 8.24±1.62 7.99±1.85 8.20±2.18 8.25±0.92
Gran (%) 56.18±8.67 57.30±9.7 56.74±8.48 54.50±9.35 52.91±7.50
HGB (g/L) 110.38±14.80 138.51±15.27*# 123.34±13.61* 145.88±14.53*# 126.40±13.01*
RBC (1012/L) 4.14±0.58 5.11±0.66* 4.85±0.51* 5.22±0.31*# 5.11±1.15*
HCT (%) 37.3±4.72 45.62±4.94*# 41.07±4.23* 46.2±4.82*# 41.11±4.64*
MCV (fL) 90.75±8.13 90.09±9.01 85.3±9.7* 89.29±6.79 82.55±11.83*
MCH (pg) 26.78±2.69 27.30±3.02# 25.55±3.16 27.88±2.36# 25.42±4.26
MCHC (g/L) 295.37±11.54 303.06±9.62* 299.7±9.50 312.52±9.48*# 307.50±13.12*
RDW-CV (%) 15.34±1.47 14.36±1.77* 14.01±1.54* 13.46±0.99* 14.47±1.74
RDW-SD (fL) 54.63±4.60 49.84±5.57*# 46.75±4.72* 46.60±4.07* 44.99±6.77*
PLT (109/L) 224.60±68.98 251.22±54.71* 281.81±65.66* 258.76±56.36 259.80±23.60
MPV (fL) 9.83±0.87 9.74±0.98 9.95±0.68 9.73±0.59 10.10±0.73
PDW 14.80±0.33 14.76±0.33 14.72±0.26 14.63±0.23 14.71±0.21
PCT (%) 0.22±0.06 0.24±0.05# 0.28±0.06* 0.25±0.05 0.26±0.03
P-LCR (%) 27.05±7.27 26.21±7.97 28.19±6.34 26.19±5.33 29.66±6.31
*p<0.05 − compared to the CEN group; #p<0.05 − compared to the F1SP group; CEN − centenarians; F1 − centenarians’ first generation of offspring;
HGB levels were associated with age, especially in the oldest subjects. Next we analyzed the associations of HGB between generations. Surprisingly, the HGB lev-els of centenarians were associated with F1 (r=0.379,
p=0.015) but not with F1SP (r=0.022, p=0.451), sug-gesting that HGB could be a heritable index (Fig. 1D).
Expression of genes involved in HGB metabolism
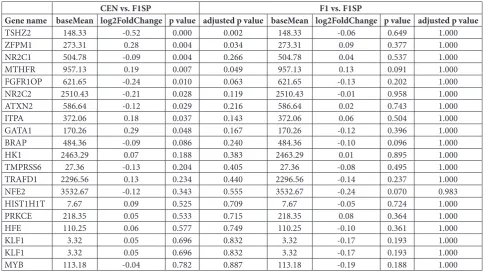
To understand the reason for the difference in HGB among the groups, especially between CEN and F1SP, we collected genes associated with HGB levels. The genes are listed in Table 2. Among them, we identified
Fig. 1. Association of HGB with age and between generations. (A) Association of HGB with age ranging from
20 to 80 years. (B) Association of HGB with age ranging from 20 to 100 years. (C) Changes in HGB levels in different age groups. (D) Association of HGB in CEN with that in F1 and F1SP. HGB − hemoglobin; CEN − centenarians; F1 − centenarians’ first generation; F1SP − spouses of F1 offspring.
Table 2. Expression comparisons of genes involved in HGB metabolism.
CEN vs. F1SP F1 vs. F1SP
Gene name baseMean log2FoldChange p value adjusted p value baseMean log2FoldChange p value adjusted p value
TSHZ2 148.33 -0.52 0.000 0.002 148.33 -0.06 0.649 1.000
ZFPM1 273.31 0.28 0.004 0.034 273.31 0.09 0.377 1.000
NR2C1 504.78 -0.09 0.004 0.266 504.78 0.04 0.537 1.000
MTHFR 957.13 0.19 0.007 0.049 957.13 0.13 0.091 1.000
FGFR1OP 621.65 -0.24 0.010 0.063 621.65 -0.13 0.202 1.000
NR2C2 2510.43 -0.21 0.028 0.119 2510.43 -0.01 0.958 1.000
ATXN2 586.64 -0.12 0.029 0.216 586.64 0.02 0.743 1.000
ITPA 372.06 0.18 0.037 0.143 372.06 0.06 0.504 1.000
GATA1 170.26 0.29 0.048 0.167 170.26 -0.12 0.396 1.000
BRAP 484.36 -0.09 0.086 0.240 484.36 -0.10 0.096 1.000
HK1 2463.29 0.07 0.188 0.383 2463.29 0.01 0.895 1.000
TMPRSS6 27.36 -0.13 0.204 0.405 27.36 -0.08 0.495 1.000
TRAFD1 2296.56 0.13 0.234 0.440 2296.56 -0.14 0.237 1.000
NFE2 3532.67 -0.12 0.343 0.555 3532.67 -0.24 0.070 0.983
HIST1H1T 7.67 0.09 0.525 0.709 7.67 -0.05 0.724 1.000
PRKCE 218.35 0.05 0.533 0.715 218.35 0.08 0.364 1.000
HFE 110.25 0.06 0.577 0.749 110.25 -0.10 0.361 1.000
KLF1 3.32 0.05 0.696 0.832 3.32 -0.17 0.193 1.000
KLF1 3.32 0.05 0.696 0.832 3.32 -0.17 0.193 1.000
MYB 113.18 -0.04 0.782 0.887 113.18 -0.19 0.188 1.000
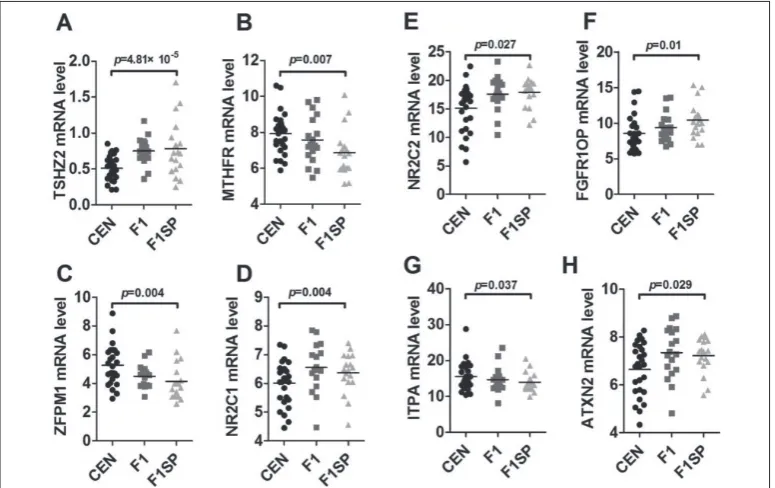
the TSHZ2, MTHFR, ZFPM1, NR2C1, NR2C2, FG-FR1OP, ITPA, ATXN2 and GATA1 as potential genes responsible for differential HGB levels (Fig. 2A-2H, Table 2), with significant differences in their expres-sions between the CEN and F1SP groups (p<0.05). Af-ter the BH adjustment, TSHZ2, MTHFR and ZFPM1
remained significant in both groups. There were no differences in these gene expressions between F1 and F1SP (p>0.05, Table 2). The other genes did not differ among the CEN, F1 and F1SP groups (Table 2). Association of gene expression of HGB
metabolism-associated genes in CEN with that in F1 and F1SP
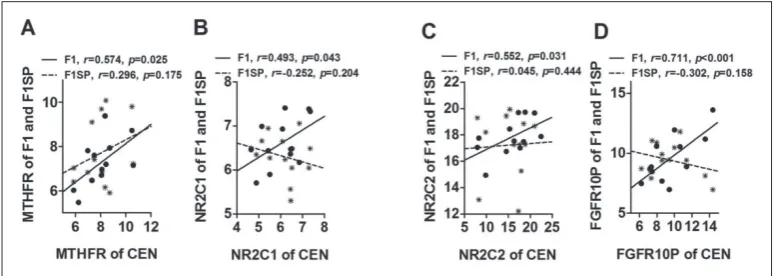
The expression level of the above-mentioned genes in F1 was between the CEN and F1SP, but was not dif-ferent from that in F1SP. Of them, the expression of
MTHFR, NR2C1, NR2C2 and FGFR1OP of centenar-ians was significantly associated with F1 but not with F1SP (Fig. 3A-D), indicating they might be involved in the inheritance of HGB of F1 from CEN.
DISCUSSION
In this study, we explored changes in blood HGB lev-els associated with age and found an inverse relation-ship between them, with a dramatic decrease in the extreme longevity subjects. We also report for the first time the association of centenarians’ HGB levels with their offspring, and identify the genes responsible for the difference in HGB in the longevity subjects and the elderly. As early as 1954, the association of variations in HGB levels with age and sex revealed a similar trend of HGB changes with age (6-98 years) [11] as described in our study. In 2012, a high prevalence of anemia based on HGB levels in octogenarians and centenarians was reported [12]. Reduced hemoglobin has been associated with adverse outcomes in some clinical diseases, such as heart failure [13] and chronic kidney disease [14]. However, a prospective study on 1205 participants re-vealed that higher HGB concentrations were associated with increased mortality [15]. Moreover, it has been suggested that higher hemoglobin may cause increased blood viscosity, blood pressure and dialysis-access
Fig. 2. Expression of genes involved in HGB metabolism. HGB − hemoglobin; CEN − centenarians; F1 −
thrombosis [16]. In addition, HGB has been shown to be the predominant factor that determines oxidative stress in blood red cells. HGB-generated oxidants could affect cellular membrane and cytoskeleton and cause red-cell aging [17]. Thus it seems that HGB has dual roles depending on its concentrations. A moderate level of HGB might be beneficial to health, but it remains unclear what the optimal HGB level should be [16]. As described above, HGB is in charge of transporting oxygen from the lungs to the other organs to produce energy, which is coupled with the production of ROS. Decreased HGB levels may be responsible for lower level of energy metabolism and an accordingly lower level of ROS production, resembling the state of energy restriction which has been suggested to prolong lifes-pan [18]. If this is the case, lower HGB levels may be beneficial to human longevity. In addition, the longevity subjects usually have a delayed or reduced prevalence of age-related diseases [19-21]. They should have a higher prevalence of disease if their lower HGB levels were as-sociated with the diseases. Additional evidence came from the study of Haslam et al. [22], who reported that anemia in centenarians was only associated with lower hand-grip and leg strength, but not with physical func-tion in everyday activities. Therefore, it seems that the impact of lower HGB in centenarians is not as simple as was once thought.
To understand why HGB levels were so low in cen-tenarians, we analyzed the expression of HGB-associ-ated genes. Of the candidate genes, the MTHFR and
ITPA gene polymorphisms were associated with plasma
hemoglobin levels [23-25]. NR2C1 and NR2C2 are two ligand-inducible transcription factors that regulate gene expression by binding to specific DNA sequences with-in promoters of target genes, which were demonstrated to affect fetal globin transcription in erythroid cells [26]. However, the mechanisms through which these candidate genes regulate blood HGB levels still need to be explored. The high association of MTHFR, NR2C1,
NR2C2 and FGFR10P expression between centenar-ians and their offspring lends additional support to the heritable potential of HGB.
In this study, several limitations should be ac-knowledged. One was that the gender ratio in samples were not equivalent. As we all know, females usually live longer than males, resulting in more female cente-narians than male. Another was the small sample size of F2 offspring, so that we just focused on the associa-tion of HGB between centenarians and F1 offspring. We believe that a larger number of F2 offspring would strengthen the conclusion that HGB is a heritable phe-notype. The third limitation was that we investigated the genes at the transcriptional level rather than the translational level: therefore, one should be cautious when interpreting the data.
Overall, our results suggest that centenarians have lower levels of blood HGB in comparison to the gen-eral population of elderly subjects. This phenotype is likely to be heritable. However, whether a lower HGB level is beneficial or detrimental to longevity warrants further study.
Fig. 3. Association of gene expression in CEN with that in F1 and F1SP. HGB − hemoglobin; CEN −
Acknowledgments: The study was supported by grants from Na-tional Basic Research Program of China (2013CB530802), Yun-nan Province (2013FB069), the Chinese Academy of Sciences, Natural Science Foundation of China (31322029, 31460290), and the Department of Science and Technology of Hainan Province (KJHZ2013-16).
Authors’ contributions: QPK and WWC conceived the study.
YYH, SYP, WL, XQC, FHX,DJY,YWL,RL,XPL,XLY and MXG performed the experiments and data analysis. YYH drafted the manuscript. All authors read and approved the final manuscript.
Conflict of interest disclosure: The authors declare no conflict
of interest.
REFERENCES
1. The au Lopez-Otin C, Blasco MA, Partridge L, Serrano M, Kroemer G. The hallmarks of aging. Cell. 2013;153(6):1194-217.
2. Harman D. Aging: a theory based on free radical and radia-tion chemistry. J Gerontol. 1956;11(3):298-300.
3. Cutler RG. Peroxide-producing potential of tissues: inverse correlation with longevity of mammalian species. Proc Natl Acad Sci US A. 1985;82(14):4798-802.
4. Ku HH, Brunk UT, Sohal RS. Relationship between mito-chondrial superoxide and hydrogen peroxide production and longevity of mammalian species. Free Rad Biol Med. 1993;15(6):621-7.
5. Sohal RS, Weindruch R. Oxidative stress, caloric restriction, and aging. Science. 1996;273(5271):59-63.
6. Bordone L, Guarente L. Calorie restriction, SIRT1 and metab-olism: understanding longevity. Nature reviews Molec Cell Biol. 2005;6(4):298-305.
7. Verdery RB, Walford RL. Changes in plasma lipids and lipo-proteins in humans during a 2-year period of dietary restric-tion in Biosphere 2. Arch Int Med. 1998;158(8):900-6. 8. Walford RL, Harris SB, Gunion MW. The calorically restricted
low-fat nutrient-dense diet in Biosphere 2 significantly lowers blood glucose, total leukocyte count, cholesterol, and blood pressure in humans. Proc Natl Acad Sci USA. 1992;89(23):11533-7.
9. Trapnell C, Williams BA, Pertea G, Mortazavi A, Kwan G, van Baren MJ, Salzberg SL, Wold BJ, Pachter L. Transcript assembly and quantification by RNA-Seq reveals unannotated transcripts and isoform switching during cell differentiation. Nat Biotechnol. 2010;28(5):511-5.
10. Atzmon G, Barzilai N, Surks MI, Gabriely I. Genetic pre-disposition to elevated serum thyrotropin is associated with exceptional longevity. J Clin Endocrinol Metabol. 2009;94(12):4768-75.
11. Hawkins WW, Speck E, Leonard VG. Variation of the hemo-globin level with age and sex. Blood. 1954;9(10):999-1007.
12. Haslam A, Hausman DB, Johnson MA, Davey A, Poon LW, Allen RH, Stabler SP, Georgia Centenarian S. Prevalence and predictors of anemia in a population-based study of octo-genarians and centenarians in Georgia. J Gerontol A-Biol. 2012;67(1):100-6.
13. Adams KF, Jr., Pina IL, Ghali JK, Wagoner LE, Dunlap SH, Schwartz TA, Stough WG, Mehra MR, Felker GM, Chiong JR, Patterson JH, Kim J, Butler J, Oren RM. Prospective evalu-ation of the associevalu-ation between hemoglobin concentrevalu-ation and quality of life in patients with heart failure. Am Heart J. 2009;158(6):965-71.
14. Finkelstein FO, Story K, Firanek C, Mendelssohn D, Barre P, Takano T, Soroka S, Mujais S. Health-related quality of life and hemoglobin levels in chronic kidney disease patients. Clin J Am Soc Nephrol. 2009;4(1):33-8.
15. Zakai NA, Katz R, Hirsch C, Shlipak MG, Chaves PH, New-man AB, CushNew-man M. A prospective study of anemia sta-tus, hemoglobin concentration, and mortality in an elderly cohort: The Cardiovascular Health Study. Arch Int Med. 2005;165(19):2214-20.
16. Gomez JM, Carrera F. What should the optimal target hemo-globin be? Kidney Int Suppl. 2002;80:39-43.
17. Ortuno-Sahagun D, Pallas M, Rojas-Mayorquin AE. Oxida-tive stress in aging: advances in proteomic approaches. Ox Med Cell Longev. 2014;2014:573208.
18. Smith JV, Heilbronn LK, Ravussin E. Energy restriction and aging. Curr Op Clin Nutr Metabol Care. 2004;7(6):615-22. 19. Andersen-Ranberg K, Schroll M, Jeune B. Healthy
centenar-ians do not exist, but autonomous centenarcentenar-ians do: a popu-lation-based study of morbidity among Danish centenarians. J Am Geriatric Soc. 2001;49(7):900-8.
20. Engberg H, Oksuzyan A, Jeune B, Vaupel JW, Christensen K. Centenarians--a useful model for healthy aging? A 29-year follow-up of hospitalizations among 40,000 Danes born in 1905. Aging Cell. 2009;8(3):270-6.
21. Hitt R, Young-Xu Y, Silver M, Perls T. Centenarians: the older you get, the healthier you have been. Lancet. 1999;354(9179):652.
22. Haslam A, Hausman DB, Davey A, Elaine Cress M, John-son MA, Poon LW. Associations between anemia and physi-cal function in Georgia centenarians. J Am Geriatric Soc. 2012;60(12):2362-3.
23. Fortunato G, Fattoruso O, De Caterina M, Mancini A, Di Fiore R, Alfieri A, Tafuri D, Buono P. RAS and MTHFR gene polymorphisms in a healthy exercise-trained population: association with the MTHFR (TT) genotype and a lower hemoglobin level. Int J Sports Med. 2007;28(2):172-7. 24. Scherzer TM, Stattermayer AF, Stauber R, Maieron A,
Stras-ser M, Laferl H, Schwarzer R, Datz C, Rutter K, Beinhardt S, Steindl-Munda P, Hofer H, Ferenci P. Effect of gender and ITPA polymorphisms on ribavirin-induced anemia in chronic hepatitis C patients. J Hepatol. 2013;59(5):964-71.
Y, Miyakawa Y, Kumada H. Influence of ITPA polymor-phisms on decreases of hemoglobin during treatment with pegylated interferon, ribavirin, and telaprevir. Hepatology. 2011;53(2):415-21.